AI PPT Maker
Templates
PPT Bundles
Design Services
Business PPTs
Business Plan
Management
Strategy
Introduction PPT
Roadmap
Self Introduction
Timelines
Process
Marketing
Agenda
Technology
Medical
Startup Business Plan
Cyber Security
Dashboards
SWOT
Proposals
Education
Pitch Deck
Digital Marketing
KPIs
Project Management
Product Management
Artificial Intelligence
Target Market
Communication
Supply Chain
Google Slides
Research Services
 One Pagers
All Categories
-
Home
- Customer Favorites
- Analysis
Analysis
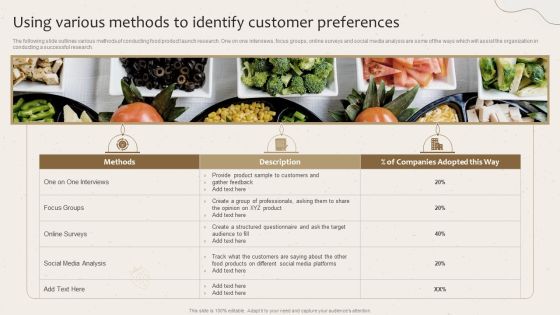
Using Various Methods To Identify Customer Preferences Launching New Beverage Product Designs PDF
The following slide outlines various methods of conducting food product launch research. One on one interviews, focus groups, online surveys and social media analysis are some of the ways which will assist the organization in conducting a successful research. Explore a selection of the finest Using Various Methods To Identify Customer Preferences Launching New Beverage Product Designs PDF here. With a plethora of professionally designed and pre-made slide templates, you can quickly and easily find the right one for your upcoming presentation. You can use our Using Various Methods To Identify Customer Preferences Launching New Beverage Product Designs PDF to effectively convey your message to a wider audience. Slidegeeks has done a lot of research before preparing these presentation templates. The content can be personalized and the slides are highly editable. Grab templates today from Slidegeeks.

Rebrand Kick Off Plan What Is A Brand Positioning Statement Template PDF
The following slide highlights smart agriculture technology market analysis with growth drivers to measure progress and track performance. It include growth drivers such as increase demand of weather monitoring system, increase in human resource investment and key insights such as estimated market value, forecasted revenue etc. If your project calls for a presentation, then Slidegeeks is your go to partner because we have professionally designed, easy to edit templates that are perfect for any presentation. After downloading, you can easily edit Rebrand Kick Off Plan What Is A Brand Positioning Statement Template PDF and make the changes accordingly. You can rearrange slides or fill them with different images. Check out all the handy templates.
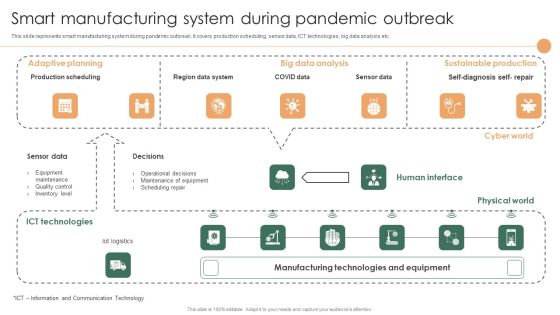
Smart Manufacturing Deployment Improve Production Procedures Smart Manufacturing System During Summary PDF
This slide represents smart manufacturing system during pandemic outbreak. It covers production scheduling, sensor data, ICT technologies, big data analysis etc.Here you can discover an assortment of the finest PowerPoint and Google Slides templates. With these templates, you can create presentations for a variety of purposes while simultaneously providing your audience with an eye-catching visual experience. Download Smart Manufacturing Deployment Improve Production Procedures Smart Manufacturing System During Summary PDF to deliver an impeccable presentation. These templates will make your job of preparing presentations much quicker, yet still, maintain a high level of quality. Slidegeeks has experienced researchers who prepare these templates and write high-quality content for you. Later on, you can personalize the content by editing the Smart Manufacturing Deployment Improve Production Procedures Smart Manufacturing System During Summary PDF.

Supplier Technical Capability Assessment Ppt PowerPoint Presentation File Icon PDF
This slide showcases technology ability analysis of supplier to improve procurement process ands reduce cost. It includes assessment factors such as technical support in installation , technical support in installation , response time to query and response time to maintenance. Do you have an important presentation coming up Are you looking for something that will make your presentation stand out from the rest Look no further than Supplier Technical Capability Assessment Ppt PowerPoint Presentation File Icon PDF. With our professional designs, you can trust that your presentation will pop and make delivering it a smooth process. And with Slidegeeks, you can trust that your presentation will be unique and memorable. So why wait Grab Supplier Technical Capability Assessment Ppt PowerPoint Presentation File Icon PDF today and make your presentation stand out from the rest.

Current And Future State Assessment In Business Case And Roadmap Strategies To Improve Customer Summary PDF
This slide provides information analysis of current and future state of CRM capabilities in order to provide better customer experience. Are you searching for a Current And Future State Assessment In Business Case And Roadmap Strategies To Improve Customer Summary PDF that is uncluttered, straightforward, and original Its easy to edit, and you can change the colors to suit your personal or business branding. For a presentation that expresses how much effort you ve put in, this template is ideal With all of its features, including tables, diagrams, statistics, and lists, its perfect for a business plan presentation. Make your ideas more appealing with these professional slides. Download Current And Future State Assessment In Business Case And Roadmap Strategies To Improve Customer Summary PDF from Slidegeeks today.

How Brand Gained Competitive Advantage And Maintain Brand Loyalty Mcdonalds Designs PDF
The following slide outlines in-depth analysis of McDonalds company. The case study covers various elements such as brand logo, slogan, target audience, strategic values, restaurants and services, company competitive strategies and future plan. Slidegeeks is one of the best resources for PowerPoint templates. You can download easily and regulate How Brand Gained Competitive Advantage And Maintain Brand Loyalty Mcdonalds Designs PDF for your personal presentations from our wonderful collection. A few clicks is all it takes to discover and get the most relevant and appropriate templates. Use our Templates to add a unique zing and appeal to your presentation and meetings. All the slides are easy to edit and you can use them even for advertisement purposes.

On Job Staff Coaching Program For Skills Refinement Evaluating Training Needs Of Individual Employees Microsoft PDF
This slide showcases assessment and evaluation of training needs of individual employees in organization. It can help to conduct gap analysis of employees and shortlist employees for training. This On Job Staff Coaching Program For Skills Refinement Evaluating Training Needs Of Individual Employees Microsoft PDF from Slidegeeks makes it easy to present information on your topic with precision. It provides customization options, so you can make changes to the colors, design, graphics, or any other component to create a unique layout. It is also available for immediate download, so you can begin using it right away. Slidegeeks has done good research to ensure that you have everything you need to make your presentation stand out. Make a name out there for a brilliant performance.
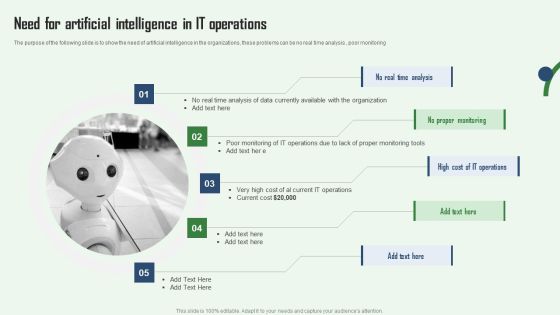
Need For Artificial Intelligence In IT Operations Aiops Integration Summary Report Information PDF
The purpose of the following slide is to show the need of artificial intelligence in the organizations, these problems can be no real time analysis , poor monitoring. Whether you have daily or monthly meetings, a brilliant presentation is necessary. Need For Artificial Intelligence In IT Operations Aiops Integration Summary Report Information PDF can be your best option for delivering a presentation. Represent everything in detail using Need For Artificial Intelligence In IT Operations Aiops Integration Summary Report Information PDF and make yourself stand out in meetings. The template is versatile and follows a structure that will cater to your requirements. All the templates prepared by Slidegeeks are easy to download and edit. Our research experts have taken care of the corporate themes as well. So, give it a try and see the results.

Facebook Advertising Target Audience Demographics Ppt PowerPoint Presentation File Gallery PDF
This slide represents the analysis of target audiences demographics for successful Facebook advertising campaign. It includes details related to maximum number of workplaces, connections, max. no. of cities etc. Coming up with a presentation necessitates that the majority of the effort goes into the content and the message you intend to convey. The visuals of a PowerPoint presentation can only be effective if it supplements and supports the story that is being told. Keeping this in mind our experts created Facebook Advertising Target Audience Demographics Ppt PowerPoint Presentation File Gallery PDF to reduce the time that goes into designing the presentation. This way, you can concentrate on the message while our designers take care of providing you with the right template for the situation.

Comparison For Shopper And Trade Marketing Strategy Professional PDF
This slide represents comparative analysis for shopper and trade marketing that enables marketers to develop plans and promotional strategies. It includes parameters for objective, target audience, functions and benefits. Crafting an eye catching presentation has never been more straightforward. Let your presentation shine with this tasteful yet straightforward Comparison For Shopper And Trade Marketing Strategy Professional PDF template. It offers a minimalistic and classy look that is great for making a statement. The colors have been employed intelligently to add a bit of playfulness while still remaining professional. Construct the ideal Comparison For Shopper And Trade Marketing Strategy Professional PDF that effortlessly grabs the attention of your audience Begin now and be certain to wow your customers.

Comparison Between Traditional And Synthesia AI Video Creation Inspiration PDF
This slide represents comparative analysis between traditional video creation and Synthesia AI video creation platform which allows businesses and individuals to develop realistic, interactive and professional videos by using AI an deep learning. It includes comparison based on accessibility, ease of use etc. Do you have an important presentation coming up Are you looking for something that will make your presentation stand out from the rest Look no further than Comparison Between Traditional And Synthesia AI Video Creation Inspiration PDF. With our professional designs, you can trust that your presentation will pop and make delivering it a smooth process. And with Slidegeeks, you can trust that your presentation will be unique and memorable. So why wait Grab Comparison Between Traditional And Synthesia AI Video Creation Inspiration PDF today and make your presentation stand out from the rest

Success Strategy Development Playbook Understanding Competitive Industry Dynamics Through Portrait PDF
This slide provides information regarding insights about competitive industry dynamics through strategy group maps by visual analysis of competitive positioning of competitors. Retrieve professionally designed Success Strategy Development Playbook Understanding Competitive Industry Dynamics Through Portrait PDF to effectively convey your message and captivate your listeners. Save time by selecting pre made slideshows that are appropriate for various topics, from business to educational purposes. These themes come in many different styles, from creative to corporate, and all of them are easily adjustable and can be edited quickly. Access them as PowerPoint templates or as Google Slides themes. You do not have to go on a hunt for the perfect presentation because Slidegeeks got you covered from everywhere.

WAF Introduction How Does Web Application Firewall Works Background PDF
This slide depicts the working process of the web application firewall, how it analysis the web traffic and detects harmful traffic, and stops it from reaching servers of web applications. This modern and well arranged WAF Introduction How Does Web Application Firewall Works Background PDF provides lots of creative possibilities. It is very simple to customize and edit with the Powerpoint Software. Just drag and drop your pictures into the shapes. All facets of this template can be edited with Powerpoint no extra software is necessary. Add your own material, put your images in the places assigned for them, adjust the colors, and then you can show your slides to the world, with an animated slide included.

Case Study Mondaycom Using AI Content Planning Tool Ppt Portfolio Clipart PDF
This slide showcases case study analysis in which Monday.com uses AI powered content planning tool Marketmuse and Codeless to optimize blog content. It provides details about articles, SEO rank improvement, content quality, etc. Welcome to our selection of the Case Study Mondaycom Using AI Content Planning Tool Ppt Portfolio Clipart PDF. These are designed to help you showcase your creativity and bring your sphere to life. Planning and Innovation are essential for any business that is just starting out. This collection contains the designs that you need for your everyday presentations. All of our PowerPoints are 100 percent editable, so you can customize them to suit your needs. This multi-purpose template can be used in various situations. Grab these presentation templates today

Optimizing Brand Equity Through Strategic Management Brands Current Value Perception Among Customers Themes PDF
This slide provides a gap analysis of the companys brand value perceived desired vs. received actual state of business performance. It includes various KPIs such as customers, satisfaction, and purchase. Create an editable Optimizing Brand Equity Through Strategic Management Brands Current Value Perception Among Customers Themes PDF that communicates your idea and engages your audience. Whether you are presenting a business or an educational presentation, pre-designed presentation templates help save time. Optimizing Brand Equity Through Strategic Management Brands Current Value Perception Among Customers Themes PDF is highly customizable and very easy to edit, covering many different styles from creative to business presentations. Slidegeeks has creative team members who have crafted amazing templates. So, go and get them without any delay.

5 Step Guide For Transitioning To Blue Ocean Strategy Using Blue Ocean With Existing Strategic Planning Microsoft PDF
This template cover companys strategies to use blue ocean with existing strategic planning model. It also depicts that SWOT analysis helps determine areas where organization is doing well and areas it needs to improve and by using both frameworks together, company will be able to identify how organization can grow in the future If you are looking for a format to display your unique thoughts, then the professionally designed 5 Step Guide For Transitioning To Blue Ocean Strategy Using Blue Ocean With Existing Strategic Planning Microsoft PDF is the one for you. You can use it as a Google Slides template or a PowerPoint template. Incorporate impressive visuals, symbols, images, and other charts. Modify or reorganize the text boxes as you desire. Experiment with shade schemes and font pairings. Alter, share or cooperate with other people on your work. Download 5 Step Guide For Transitioning To Blue Ocean Strategy Using Blue Ocean With Existing Strategic Planning Microsoft PDF and find out how to give a successful presentation. Present a perfect display to your team and make your presentation unforgettable.

Dashboard Ppt PowerPoint Presentation Background Images
This is a dashboard ppt powerpoint presentation background images. This is a four stage process. The stages in this process are business, marketing, management, dashboard, analysis.

Business Model Ppt PowerPoint Presentation Graphics
This is a business model ppt powerpoint presentation graphics. This is a three stage process. The stages in this process are business, marketing, management, finance, analysis.
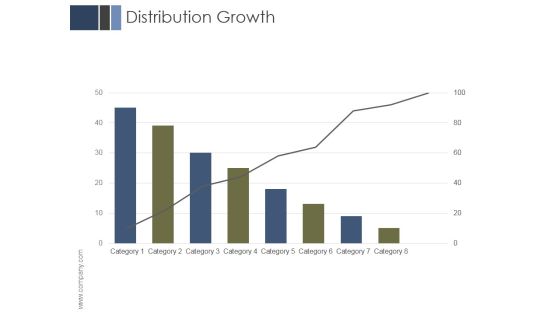
Distribution Growth Ppt PowerPoint Presentation Background Images
This is a distribution growth ppt powerpoint presentation background images. This is a eight stage process. The stages in this process are business, marketing, management, growth, analysis.

Competitive Intelligence Template Ppt PowerPoint Presentation Templates
This is a competitive intelligence template ppt powerpoint presentation templates. This is a seven stage process. The stages in this process are business, marketing, management, compare, analysis.

Dashboard Ppt PowerPoint Presentation Guide
This is a dashboard ppt powerpoint presentation guide. This is a four stage process. The stages in this process are business, marketing, management, dashboard, analysis.

Client Planner Comparison Worksheet For Establishing Financial Direction Ppt PowerPoint Presentation Deck
This is a client planner comparison worksheet for establishing financial direction ppt powerpoint presentation deck. This is a two stage process. The stages in this process are worksheet, financial direction, communication, financial analysis.

Slides You Need For Your Pitch Deck Ppt PowerPoint Presentation Example
This is a slides you need for your pitch deck ppt powerpoint presentation example. This is a ten stage process. The stages in this process are go to market plan, competitive analysis, management team, financial projections , financial projections, problem opportunity, value proposition, underlying magic.

Business Diagram Battery Connected With Bulb For Idea Generation PowerPoint Slide
This business slide displays battery icon connected with bulb. This diagram is a data visualization tool that gives you a simple way to present statistical information. This slide helps your audience examine and interpret the data you present.
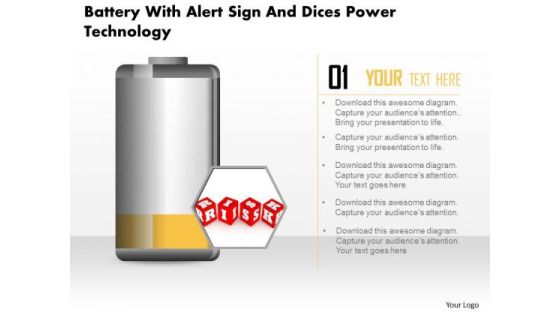
Business Diagram Battery With Alert Sign And Dices Power Technology PowerPoint Slide
This business diagram displays risk alert on battery icon. Use this diagram, in your presentations to display energy saving, battery and technology. Create professional presentations using this diagram slide.

Business Diagram 3d Colorful Pie Graph With Magnifier Data Search PowerPoint Slide
This business slide displays 3d colorful pie graph with magnifier. This diagram is a data visualization tool that gives you a simple way to present statistical information. This slide helps your audience examine and interpret the data you present.

Business Diagram Data Driven Pie Chart Inside The Magnifier PowerPoint Slide
This business slide displays 3d colorful pie graph with magnifier. This diagram is a data visualization tool that gives you a simple way to present statistical information. This slide helps your audience examine and interpret the data you present.
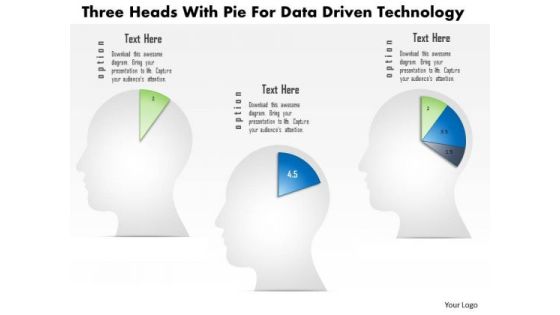
Business Diagram Three Heads With Pie For Data Driven Technology PowerPoint Slide
This business diagram displays three human faces with pie charts. This Power Point template has been designed to compare and present business data. You may use this diagram to impart professional appearance to your presentations.
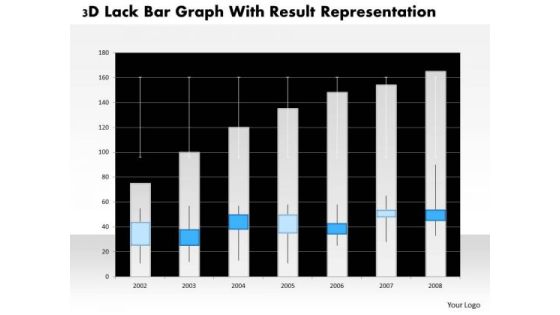
Business Diagram 3d Lack Bar Graph With Result Representation PowerPoint Slide
This business diagram has graphic of 3d lack bar graph. This diagram is a data visualization tool that gives you a simple way to present statistical information. This slide helps your audience examine and interpret the data you present.

Calculating Customer Lifetime Value Clv Ppt PowerPoint Presentation Styles Good
This is a calculating customer lifetime value clv ppt powerpoint presentation styles good. This is a five stage process. The stages in this process are average acquisition cost, average customer revenue, average customer costs, average customer profit, customer retention rate, cumulative retention rate, likely customer profit.

Changes In Competitive Environment Template 2 Ppt PowerPoint Presentation Professional Themes
This is a changes in competitive environment template 2 ppt powerpoint presentation professional themes. This is a four stage process. The stages in this process are brand, business, marketing, competitive landscape, growth.
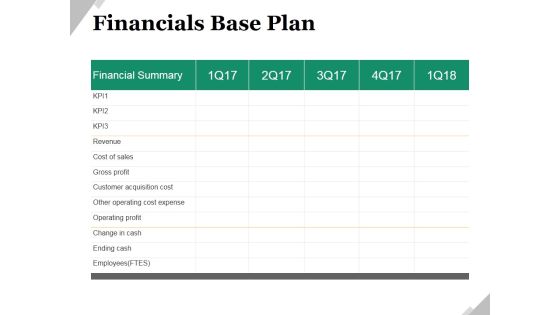
Financials Base Plan Ppt PowerPoint Presentation Model Shapes
This is a financials base plan ppt powerpoint presentation model shapes. This is a five stage process. The stages in this process are financial summary, business, marketing, revenue, cost of sales, gross profit.
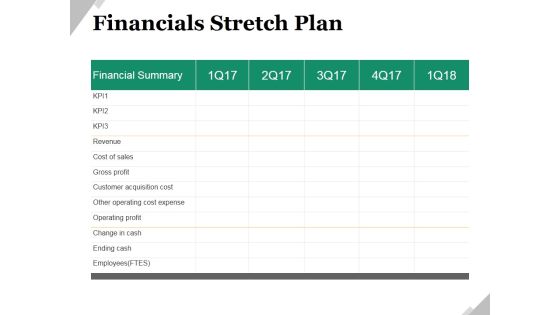
Financials Stretch Plan Ppt PowerPoint Presentation Ideas Shapes
This is a financials stretch plan ppt powerpoint presentation ideas shapes. This is a five stage process. The stages in this process are revenue, cost of sales, gross profit, customer acquisition cost, other operating cost expense, operating profit.
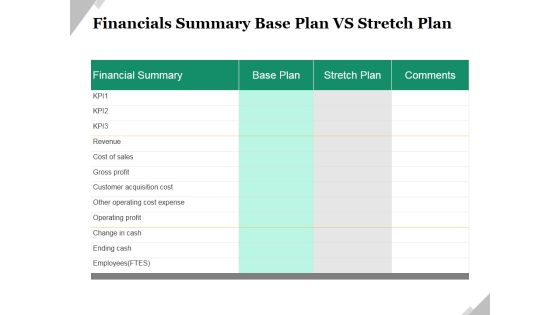
Financials Summary Base Plan Vs Stretch Plan Ppt PowerPoint Presentation Slides Information
This is a financials summary base plan vs stretch plan ppt powerpoint presentation slides information. This is a two stage process. The stages in this process are revenue, cost of sales, gross profit, customer acquisition cost, other operating cost expense, operating profit.
Business Diagram Battery Icon With Power Icons Energy Technology PowerPoint Slide
This business diagram displays battery icon with power charging. Use this diagram, in your presentations to display energy saving, battery and technology. Create professional presentations using this diagram slide.
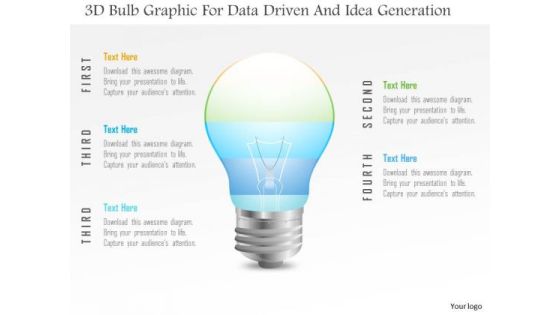
Business Diagram 3d Bulb Graphic For Data Driven And Idea Generation PowerPoint Slide
This Power Point template has been designed with 3d bulb graphic. Use this slide to represent technology idea and strategy concepts. Download this diagram for your business presentations and get exclusive comments on your efforts.
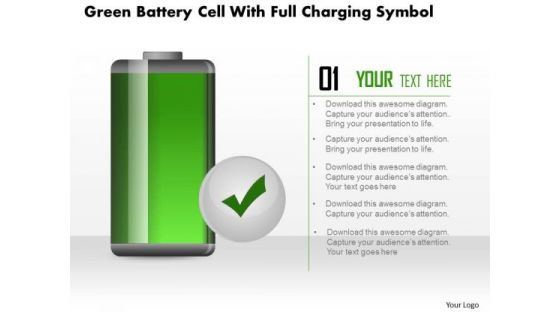
Business Diagram Green Battery Cell With Full Charging Symbol PowerPoint Slide
This business diagram displays full battery charge icon. Use this diagram, in your presentations to display energy saving, battery and technology. Create professional presentations using this diagram slide.
Business Diagram Battery With Empty Sign For Power Generation PowerPoint Slide
This business diagram displays empty sign alert on battery icon. Use this diagram, in your presentations to display energy saving, battery and technology. Create professional presentations using this diagram slide.
Business Diagram Hour Glass With 3d Man And Icons PowerPoint Slide
This diagram displays 3d man with hour glass and icons. This diagram contains concept of communication and technology. Use this diagram to display business process workflows in any presentations.

Business Diagram Flask With Data Driven Chart PowerPoint Slide
This data driven diagram has been designed with flask graphics. Download this diagram to give your presentations more effective look. It helps in clearly conveying your message to clients and audience.

Business Diagram Laptop With Data Driven Area Chart PowerPoint Slide
This diagram has been designed with laptop and data driven area chart. Download this diagram to give your presentations more effective look. It helps in clearly conveying your message to clients and audience.
Business Diagram 3d Capsule With Multiple Icons For Business Data Flow PowerPoint Slide
This diagram has been designed with 3d graphic of capsule with multiple icons. This data driven PowerPoint slide can be used to give your presentations more effective look. It helps in clearly conveying your message to clients and audience.

Business Diagram 3d Thumb Chart And Tablet For Data Representation PowerPoint Slide
This business diagram displays graphic of 3d thumb up chart with icons on computer screen. This business slide contains the concept of business data representation. Use this diagram to build professional presentations for your viewers.
Business Diagram Flask And Test Tubes For Data Driven PowerPoint Slide
This data driven diagram has been designed with flask and test tubes. Download this diagram to give your presentations more effective look. It helps in clearly conveying your message to clients and audience.

Business Diagram Two Tablets With Growth Bar Graph Data Driven PowerPoint Slide
This business diagram has been designed with comparative charts on tablets. This slide suitable for data representation. You can also use this slide to present business reports and information. Use this diagram to present your views in a wonderful manner.
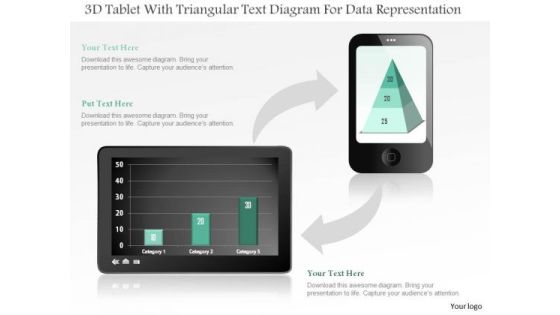
Business Diagram 3d Tablet With Triangular Text Diagram For Data Representation PowerPoint Slide
This business diagram displays bar graph on tablet and pyramid chart on mobile phone. Use this diagram, to make reports for interactive business presentations. Create professional presentations using this diagram.
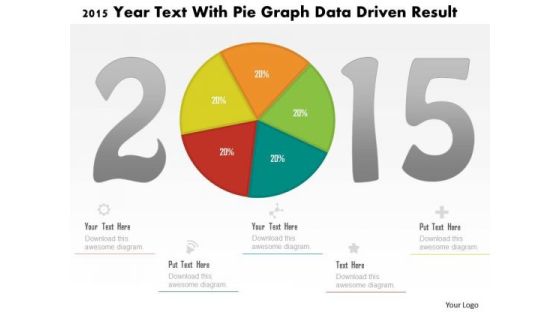
Business Diagram 2015 Year Text With Pie Graph Data Driven Result PowerPoint Slide
This business diagram displays 2015 year numbers with pie chart. This diagram is suitable to display business strategy for year 2015. Download this professional slide to present information in an attractive manner
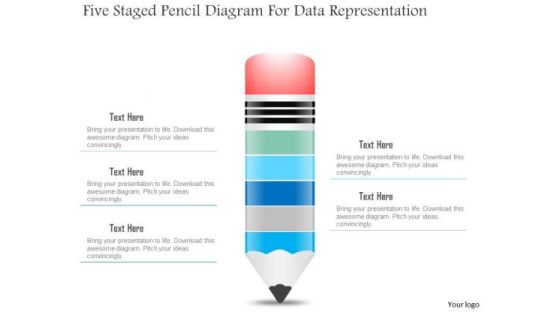
Business Diagram Five Staged Pencil Diagram For Data Representation PowerPoint Slide
This business slide displays five staged pencil diagram. It contains pencil graphic divided into five parts. This diagram slide depicts processes, stages, steps, points, options and education information display. Use this diagram, in your presentations to express your views innovatively.
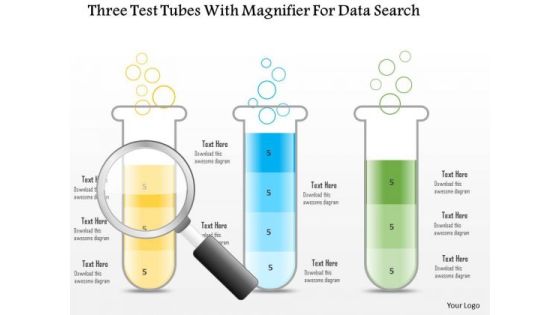
Business Diagram Three Test Tubes With Magnifier For Data Search PowerPoint Slide
This business diagram displays three test tubes with magnifying glass. This diagram is suitable to depict flow of business activities or steps. Download this professional slide to present information in an attractive manner.

Business Diagram Three Trucks For Data Representation For Business PowerPoint Slide
This business diagram displays three trucks graphic. This diagram contains trucks for percentage value growth. Use this diagram to display business growth over a period of time.

Business Diagram Human Mind Diagram With Pie Graph For Representation PowerPoint Slide
This diagram displays human face graphic divided into sections. This section can be used for data display. Use this diagram to build professional presentations for your viewers.

Business Diagram Six Staged Pie Charts For Text Representation PowerPoint Slide
This slide displays graphic six staged pie charts. Download this diagram to present and compare business data. Use this diagram to display business process workflows in any presentation.
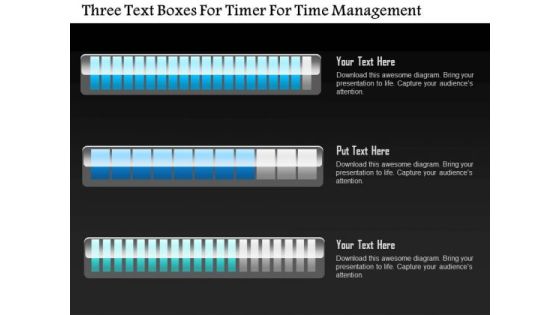
Business Diagram Three Text Boxes For Timer For Time Management PowerPoint Slide
This business diagram displays three text boxes. This diagram contains text boxes for data representation. Use this diagram to display business process workflows in any presentations.

Business Diagram 3d Lock With Pie Chart And Text Boxes For Business PowerPoint Slide
This Power Point diagram has been crafted with pie chart in shape of lock. It contains diagram of lock pie chart to compare and present data in an effective manner. Use this diagram to build professional presentations for your viewers.

Business Diagram 3d Lock With Pie Graph For Result Representation PowerPoint Slide
This Power Point diagram has been crafted with pie chart in shape of lock. It contains diagram of lock pie chart to compare and present data in an effective manner. Use this diagram to build professional presentations for your viewers.

Business Diagram 3d Pencil With Text Boxes For Representation PowerPoint Slide
This Power Point diagram displays graphic of pencil with icons and text spaces. It contains diagram of colorful pencil for data display. Use this diagram to build professional presentations for your viewers.
Business Diagram Human Icons With Bubbles And Different Icons Inside PowerPoint Slide
This diagram displays graph with percentage value growth. This business slide is suitable to present and compare business data. Use this diagram to build professional presentations for your viewers.

Business Diagram Three Staged Pencil Diagram For Graph Formation PowerPoint Slide
This business diagram displays set of pencils. This Power Point template has been designed to compare and present business data. Download this diagram to represent stages of business growth.

Business Diagram Five Staged Timeline Diagram For Business PowerPoint Slide
This PowerPoint template displays five points timeline diagram. This business diagram has been designed with graphic of timeline with five points, text space and start, end points. Use this diagram, in your presentations to display process steps, stages, timelines and business management. Make wonderful presentations using this business slide.
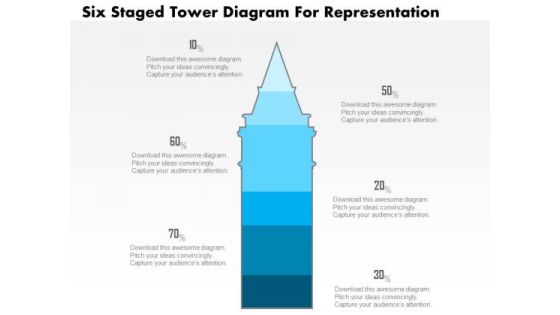
Business Diagram Five Staged Tower Diagram For Representation PowerPoint Slide
This business slide displays five staged tower diagram. It contains blue tower graphic divided into five parts. This diagram slide depicts processes, stages, steps, points, options information display. Use this diagram, in your presentations to express your views innovatively.
