AI PPT Maker
Templates
PPT Bundles
Design Services
Business PPTs
Business Plan
Management
Strategy
Introduction PPT
Roadmap
Self Introduction
Timelines
Process
Marketing
Agenda
Technology
Medical
Startup Business Plan
Cyber Security
Dashboards
SWOT
Proposals
Education
Pitch Deck
Digital Marketing
KPIs
Project Management
Product Management
Artificial Intelligence
Target Market
Communication
Supply Chain
Google Slides
Research Services
 One Pagers
All Categories
-
Home
- Customer Favorites
- Analysis
Analysis

Business Diagram Three Circular Financial Pie Chart PowerPoint Template
This power point template has been designed with graphic of three circular pie chart. This pie chart is suitable for financial data representation. Use this PPt for your business and finance related presentations.

Business Diagram Three Colored Text Boxes Representation PowerPoint Template
Three colored text boxes diagram has been used to design this power point template. This PPT contains the concept of process based data representation. This PPT is suitable for business and sales related presentations.
Business Diagram Three Icons Arrow Text Boxes PowerPoint Template
Graphic of three icons and arrow text boxes are used to craft this power point template slide. This PPT contains the concept of business growth. This PPT slide is suitable for business and marketing data flow related presentations.
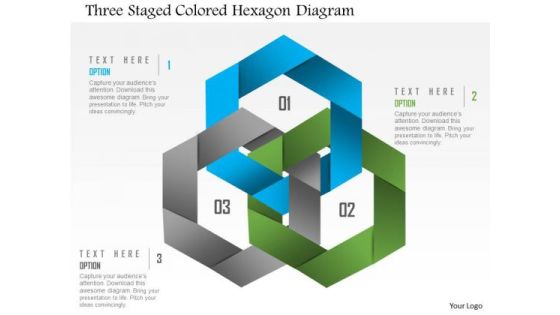
Business Diagram Three Staged Colored Hexagon Diagram PowerPoint Template
Three staged colored hexagon diagram has been used to design this power point template. This PPT contains the concept of study based data representation. This PPT is suitable for business and sales related presentations.

Business Diagram Circles With Pencils For Business Structures Presentation Template
This business diagram has been designed with graphic of pencils with text circles. This slide helps to depict business data and process. Use this slide to build quality presentations for your viewers.

Business Diagram Four Thermometer For Entrepreneurship Statistics Presentation Template
Graphic of thermometers have been used to design this business diagram. Thermometers can be used to display entrepreneurship statistics. Use this diagram your data and information related topics in any presentation.

Business Diagram Circles For Percentage Growth Presentation Template
This business slide has been designed with graphics of circles. You may download this diagram to display percentage growth data. This template is innovatively designed to highlight your worthy views
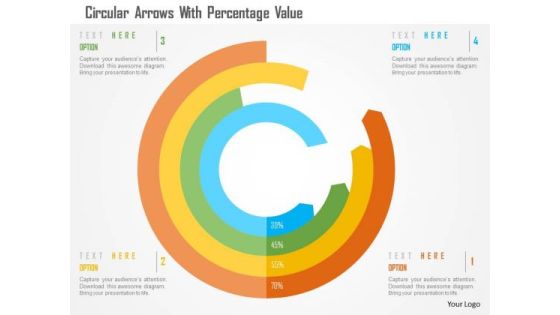
Business Diagram Circular Arrows With Percentage Value Presentation Template
This business slide has been designed with circular arrows. You may download this diagram to display percentage growth data. This template is innovatively designed to highlight your worthy views

Business Diagram Colorful Boxes For Business Options Presentation Template
Graphics of colorful text boxes have been used to design this power point template. This diagram contains the concept of data representation. Illustrate your ideas and imprint them in the minds of your team with this template.
Business Diagram Navigation Icon Around Circle Presentation Template
Five staged business info graphics been used to design this power point template. This diagram contains the concept of data representation. Use this diagram for business and finance related presentations
Business Diagram Icons To Outline Example Presentation Template
Our above slide contains graphics of tags and icons. It helps to display outline of business plan. Use this diagram to impart more clarity to data and to create more sound impact on viewers.
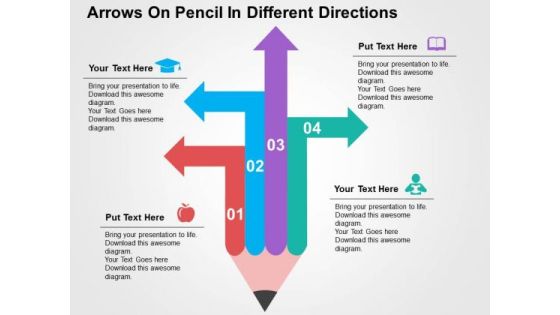
Arrows On Pencil In Different Directions PowerPoint Template
Create dynamic presentations with our professional template containing graphics of pencils with arrows and icons. This diagram is useful for data representation. Download this template to leave permanent impression on your audience.
Balloon Banners With Icons PowerPoint Template
Create dynamic presentations with our professional template containing graphics of balloon banner with icons. This diagram is useful for data representation. Download this template to leave permanent impression on your audience.
Cloud Icons With Paper Clips PowerPoint Template
Visually support your presentation with our above template showing cloud icons with paper clips. This slide has been professionally designed to portray concepts like cloud computing and data storage. This template offers an excellent background to build impressive presentation.

Bars Displaying Percentage Growth PowerPoint Templates
Our above PPT slide contains bar graph displaying percentage growth. This diagram of bar graph helps to depict statistical information. Use this diagram to impart more clarity to data and to create more sound impact on viewers.
Diagram Of Gears With Icons PowerPoint Templates
Our above PPT slide contains diagram of gears with icons. It helps to exhibit process planning and solutions. Use this diagram to impart more clarity to data and to create more sound impact on viewers.
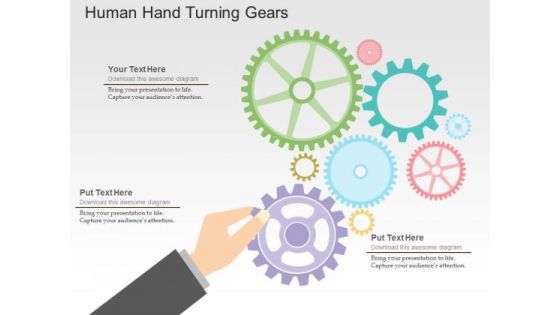
Human Hand Turning Gears PowerPoint Templates
Our above slide contains graphics of human hand turning gears. It helps to display concepts of process control and management. Use this diagram to impart more clarity to data and to create more sound impact on viewers.

Man Climbing On Books With Ladder PowerPoint Templates
Our above slide contains graphics of man climbing on books with help of ladder. It helps to display concept of education and success. Use this diagram to impart more clarity to data and to create more sound impact on viewers.
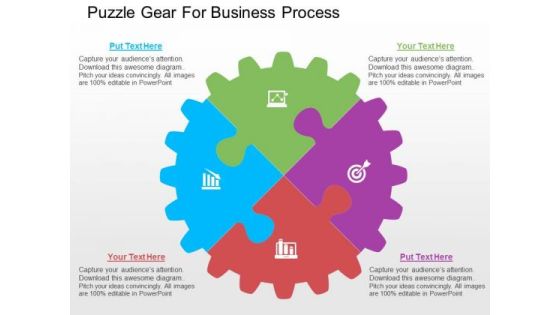
Puzzle Gear For Business Process PowerPoint Templates
Our above PPT slide contains circular gear puzzle diagram. This puzzle gear circular diagram helps to exhibit process planning and solutions. Use this diagram to impart more clarity to data and to create more sound impact on viewers.
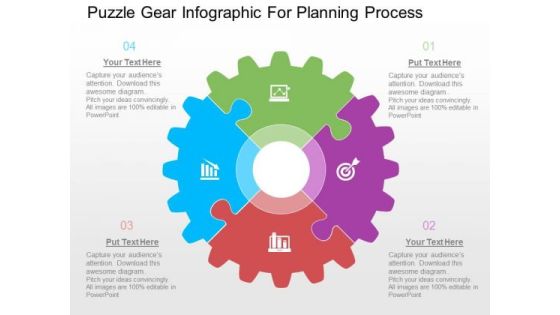
Puzzle Gear Infographic For Planning Process PowerPoint Templates
Our above PPT slide contains circular gear puzzle diagram. This puzzle gear circular diagram helps to exhibit process planning and solutions. Use this diagram to impart more clarity to data and to create more sound impact on viewers.

Diamond Design With Two Levels And Eight Stages Powerpoint Template
Our above slide contains graphics of diamond design with two levels and eight stages. It helps to display concepts in visual manner. Use this diagram to impart more clarity to data and to create more sound impact on viewers.

Diamond Process Flow Infographic Diagram Powerpoint Template
Our above slide contains diamond process flow infographic diagram. This PowerPoint template helps to display six steps in linear flow. Use this diagram to impart more clarity to data and to create more sound impact on viewers.

Infographic Diagram With Percentage Values Powerpoint Template
Visually support your presentation with our above template containing infographic diagram with percentage values. This diagram is excellent visual tools for explaining huge amounts of information where complex data needs to be explained immediately and clearly.

3D Arrows Step Process Diagram Powerpoint Template
Our above slide contains graphics of arrows step process diagram. It helps to display innovative ideas. Use this diagram to impart more clarity to data and to create more sound impact on viewers.

Colorful Circle Arrow Design Powerpoint Template
Our above PPT slide contains circular arrow design. This business diagram helps to exhibit process flow. Use this diagram to impart more clarity to data and to create more sound impact on viewers.

Colorful Circle Arrow Diagram Powerpoint Template
Our above PPT slide contains circular arrow design. This business diagram helps to exhibit process flow. Use this diagram to impart more clarity to data and to create more sound impact on viewers.

Colorful Circular Arrows Diagram Powerpoint Template
Our above PPT slide contains circular arrow design. This business diagram helps to exhibit process flow. Use this diagram to impart more clarity to data and to create more sound impact on viewers.
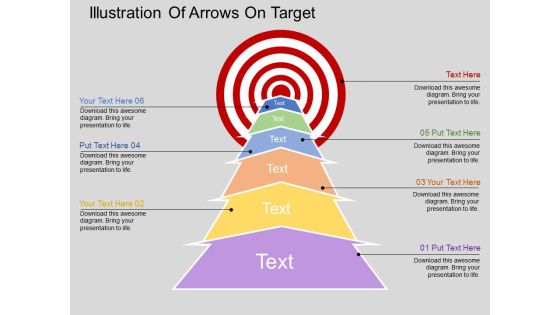
Illustration Of Arrows On Target Powerpoint Templates
Our above slide illustrates arrow steps towards target. This PowerPoint template may be used to exhibit target planning. Use this diagram to impart more clarity to data and to create more sound impact on viewers.
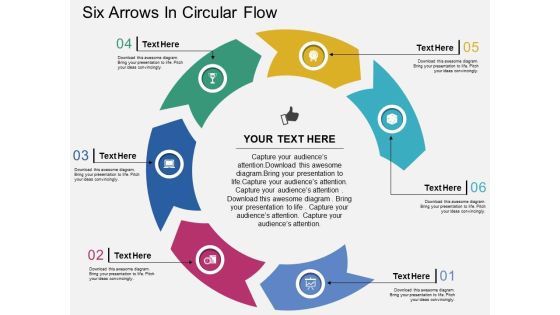
Six Arrows In Circular Flow Powerpoint Templates
Our above PPT slide contains graphics of circular diagram. This business diagram helps to display outline of business plan. Use this template to impart more clarity to data and to create more sound impact on viewers.
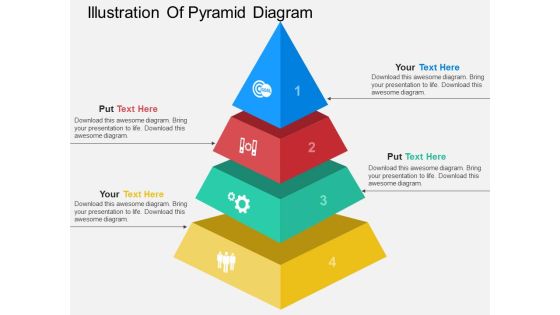
Illustration Of Pyramid Diagram Powerpoint Template
This PowerPoint slide contains illustration of pyramid diagram. This professional slide may be used for visual explanation of data. Adjust the above diagram in your business presentations to give professional impact.
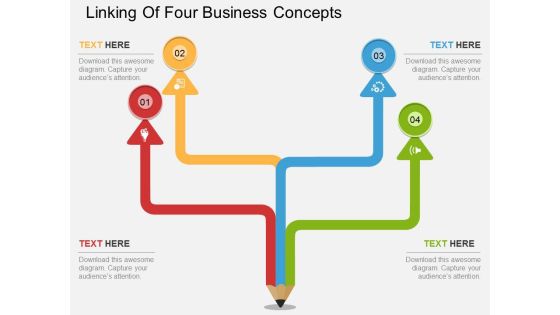
Linking Of Four Business Concepts Powerpoint Template
This PowerPoint template has been designed with four steps pencil diagram. This diagram is excellent visual tools to present link of steps. Download this PPT slide to explain complex data immediately and clearly.
Navigation Point Four Banners And Icons Powerpoint Template
This PowerPoint template has been designed with four banners icons. This diagram is excellent visual tools for business presentations. Download this PPT slide to explain complex data immediately and clearly.

Diagram Of Colorful Circular Arrows Powerpoint Template
Our above PPT slide contains circular arrow design. This business diagram helps to exhibit process flow. Use this diagram to impart more clarity to data and to create more sound impact on viewers.
Four Arrows Design With Icons Powerpoint Template
The above PowerPoint slide displays four arrows design with icons. This PowerPoint diagram helps to summarize complex business data. Adjust the above diagram in your business presentations to visually support your content.

Four Arrows Tags Infographics Powerpoint Template
The above PowerPoint slide displays four arrows design with icons. This PowerPoint diagram helps to summarize complex business data. Adjust the above diagram in your business presentations to visually support your content.
Four Banners With Business Icons Powerpoint Template
The above PowerPoint slide displays four banners with icons. This PowerPoint diagram helps to summarize complex business data. Adjust the above diagram in your business presentations to visually support your content.
Four Banners With Finance Growth Icons Powerpoint Template
The above PowerPoint slide displays four banners with finance growth icons. This PowerPoint diagram helps to summarize complex business data. Adjust the above diagram in your business presentations to visually support your content.
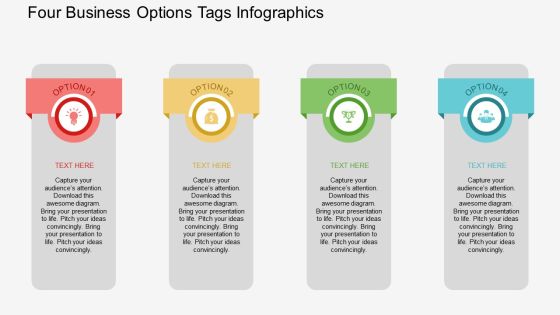
Four Business Options Tags Infographics Powerpoint Template
The above PowerPoint slide displays four options tags infographic. This PowerPoint diagram helps to summarize complex business data. Adjust the above diagram in your business presentations to visually support your content.
Four Circle Pencil Tags With Icons Diagram Powerpoint Template
The above PowerPoint slide displays four circle pencil tags with icons This PowerPoint diagram helps to summarize complex business data. Adjust the above diagram in your business presentations to visually support your content.
Four Colored Arrow Tags With Icons Powerpoint Template
The above PowerPoint slide displays four colored arrow tags with icons. This PowerPoint diagram helps to summarize complex business data. Adjust the above diagram in your business presentations to visually support your content.
Four Colorful Circle Tags With Icons Powerpoint Template
The above PowerPoint slide displays four colorful circle tags with icons. This PowerPoint diagram helps to summarize complex business data. Adjust the above diagram in your business presentations to visually support your content.

Circle Process Of Four Steps Powerpoint Templates
Our above slide contains graphics of bulb with success graph. It helps to exhibit planning for growth. Use this diagram to impart more clarity to data and to create more sound impact on viewers.

Money Exchange Electronic Transactions Powerpoint Templates
Our above slide contains illustration of money exchange. It helps to display electronic transactions. Use this diagram to impart more clarity to data and to create more sound impact on viewers.
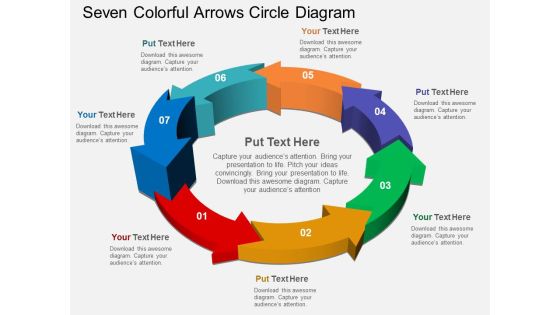
Seven Colorful Arrows Circle Diagram Powerpoint Templates
Our above PPT slide contains arrows infographic. It helps to display outline of business plan. Use this diagram to impart more clarity to data and to create more sound impact on viewers.

Arrows Infographic For Strategic Management Concept Powerpoint Template
Our above PPT slide contains four curved arrows infographic design. This business diagram helps to depict business information for strategic management. Use this diagram to impart more clarity to data and to create more sound impact on viewers.
Four Staged Pie Chart With Icons Powerpoint Templates
A good quality PowerPoint template is the foundation for every presentation. This PPT slide contains graphics of pie chart. Download this slide to outline business data. This slide is innovatively designed to highlight your worthy views.
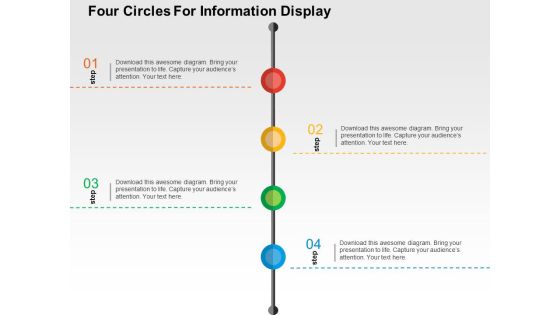
Four Circles For Information Display Powerpoint Templates
This PowerPoint slide contains graphics of four circles. This professional slide may be used for visual explanation of data. Adjust the above diagram in your business presentations to give professional impact.

Set Of Seven Vertical Steps Powerpoint Templates
This PowerPoint slide contains graphics of seven vertical steps. This professional slide may be used for visual explanation of data. Adjust the above diagram in your business presentations to give professional impact.

Set Of Six Vertical Steps Powerpoint Templates
This PowerPoint slide contains graphics of six vertical steps. This professional slide may be used for visual explanation of data. Adjust the above diagram in your business presentations to give professional impact.

Dashboard With Increasing Values Powerpoint Slides
This innovative, stunningly beautiful dashboard has been designed for data visualization. It contains pie charts with increasing percentage values. This PowerPoint template helps to display your information in a useful, simple and uncluttered way.

Dashboard With Low High Medium Indication Powerpoint Slides
This innovative, stunningly beautiful dashboard has been designed for data visualization. It contains dashboard with low, high and medium indication. This PowerPoint template helps to display your information in a useful, simple and orderly way.

Four Steps Circular Infographic Powerpoint Slides
This innovative, stunningly beautiful dashboard has been designed for data visualization. It contains circular infographic design. This PowerPoint template helps to display your information in a useful, simple and orderly way.

Illustration Of Save Money Concept Powerpoint Templates
This business slide has been designed with infographic square. These text boxes can be used for data representation. Use this diagram for your business presentations. Build a quality presentation for your viewers with this unique diagram.

Four Circular Steps Process Infographics Powerpoint Template
This PowerPoint slide contains circular steps process infographic. This professional slide may be used for visual explanation of data. Adjust the above diagram in your business presentations to give professional impact.

Four Horizontal Text Banners Powerpoint Template
This PowerPoint template has been designed with four horizontal text banners. This diagram is excellent visual tools for business presentations. Download this PPT slide to explain complex data immediately and clearly.
Four Sequential Boxes And Icons Diagram Powerpoint Template
This PowerPoint template has been designed with four sequential boxes and icons. This diagram is excellent visual tools for business presentations. Download this PPT slide to explain complex data immediately and clearly.
Four Sequential Text Banners With Icons Powerpoint Template
This PowerPoint template has been designed with four sequential text banners and icons. This diagram is excellent visual tools for business presentations. Download this PPT slide to explain complex data immediately and clearly.
Four Staged Numeric Banners With Icons Powerpoint Template
This PowerPoint template has been designed with four staged numeric banners icons. This diagram is excellent visual tools for business presentations. Download this PPT slide to explain complex data immediately and clearly.
Four Text Boxes With Icons Powerpoint Templates
This Business diagram can be used to display data, business information etc. You can easily customize this PowerPoint template as per your need. Capture the attention of your audience.
Linear Circles Of Timeline With Icons Powerpoint Template
Our above slide contains linear timeline diagram. This PowerPoint template helps to display circle steps in linear flow. Use this diagram to impart more clarity to data and to create more sound impact on viewers.
