Ai
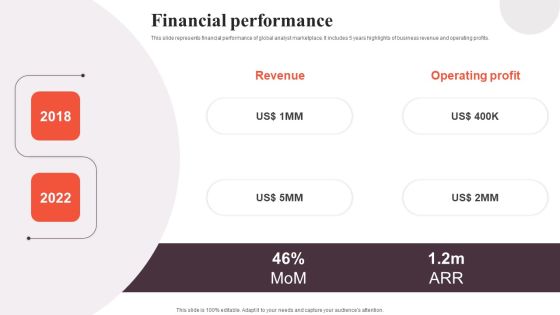
Financial Analytics Solution Investor Funding Elevator Pitch Deck Financial Performance Formats PDF
This slide represents financial performance of global analyst marketplace. It includes 5 years highlights of business revenue and operating profits. This Financial Analytics Solution Investor Funding Elevator Pitch Deck Financial Performance Formats PDF is perfect for any presentation, be it in front of clients or colleagues. It is a versatile and stylish solution for organizing your meetings. The Financial Analytics Solution Investor Funding Elevator Pitch Deck Financial Performance Formats PDF features a modern design for your presentation meetings. The adjustable and customizable slides provide unlimited possibilities for acing up your presentation. Slidegeeks has done all the homework before launching the product for you. So, do not wait, grab the presentation templates today

Servicenow Performance Analytics For Effective Human Resource Deliverables Prevent Future Calls Demonstration PDF
This slide depicts how we can prevent the future calls or repetitive calls by working on the areas of improvement based on the trends or analytics. The Servicenow Performance Analytics For Effective Human Resource Deliverables Prevent Future Calls Demonstration PDF is a compilation of the most recent design trends as a series of slides. It is suitable for any subject or industry presentation, containing attractive visuals and photo spots for businesses to clearly express their messages. This template contains a variety of slides for the user to input data, such as structures to contrast two elements, bullet points, and slides for written information. Slidegeeks is prepared to create an impression.

KPI Analytics Dashboard With Sourcing Raw Material Cycle Time Inspiration PDF
Following slide shows the key performance indicator KPI dashboard which will assist corporates to effectively monitor procurement process. The metrics are number of suppliers, contract compliance, average procurement cycle time, etc. Showcasing this set of slides titled KPI Analytics Dashboard With Sourcing Raw Material Cycle Time Inspiration PDF. The topics addressed in these templates are Kpi Analytics Dashboard, Sourcing Raw Material, Cycle Time. All the content presented in this PPT design is completely editable. Download it and make adjustments in color, background, font etc. as per your unique business setting.
Information Technology In A Supply Chain Analytical Applications Ppt PowerPoint Presentation Portfolio Icon
This is a information technology in a supply chain analytical applications ppt powerpoint presentation portfolio icon. This is a three stage process. The stages in this process are strategic, planning, operational, supplier apps, manufacturer.

Information Technology In A Supply Chain Analytical Applications Ppt PowerPoint Presentation Inspiration Background Image
This is a information technology in a supply chain analytical applications ppt powerpoint presentation inspiration background image. This is a three stage process. The stages in this process are strategic, planning, operational, supplier apps.

Information Technology In A Supply Chain Analytical Applications Ppt PowerPoint Presentation Show Maker
This is a information technology in a supply chain analytical applications ppt powerpoint presentation show maker. This is a three stage process. The stages in this process are strategic, planning, operational, supplier apps.

Analytics Team Employee Performance Assessment Survey With Interest And Proficiency Designs PDF
This slide showcases a matrix that visualizes the skills that are required, present in the team, and unavailable in the team. It includes certain skills such as data analysis, data visualization, and business acumen along with the proficiency level and interest of each employee. Showcasing this set of slides titled Analytics Team Employee Performance Assessment Survey With Interest And Proficiency Designs PDF. The topics addressed in these templates are Data Visualization, Proficiency Level, Interest. All the content presented in this PPT design is completely editable. Download it and make adjustments in color, background, font etc. as per your unique business setting.
Servicenow Performance Analytics For Effective Human Resource Deliverables Ppt PowerPoint Presentation Complete Deck With Slides
Build a robust business process flow in your organization using this predesigned template. This Servicenow Performance Analytics For Effective Human Resource Deliverables Ppt PowerPoint Presentation Complete Deck With Slides offers critical insights into structuring your business, and the then the presentation, for maximum impact at minimal effort. Why drain yourself when you can have this complete deck of fifty four slides do the hard work for you. This is needless pain that a download of our template avoids. The presentation template is also equipped to do this with its 100 percent editable and customizable capability.

Data Analytics IT Impacts Of Data Science Integration In The Organization Ppt Pictures Background Designs PDF
This slide describes the impacts of data science integration in the organization and how it will be helpful in decision-making to get new business opportunities to the target audience and decide future goals. This is a data analytics it impacts of data science integration in the organization ppt pictures background designs pdf template with various stages. Focus and dispense information on eight stages using this creative set, that comes with editable features. It contains large content boxes to add your information on topics like business, opportunities, goals, demographic, data insights. You can also showcase facts, figures, and other relevant content using this PPT layout. Grab it now.

Data Analytics IT Phases Of Data Science Discovery Ppt Portfolio Skills PDF
This slide represents the first phase of data science that is understanding business problems and the facts that come under this phase. Presenting data analytics it phases of data science discovery ppt portfolio skills pdf to provide visual cues and insights. Share and navigate important information on four stages that need your due attention. This template can be used to pitch topics like resources, technology, organization, goals, business. In addtion, this PPT design contains high resolution images, graphics, etc, that are easily editable and available for immediate download.
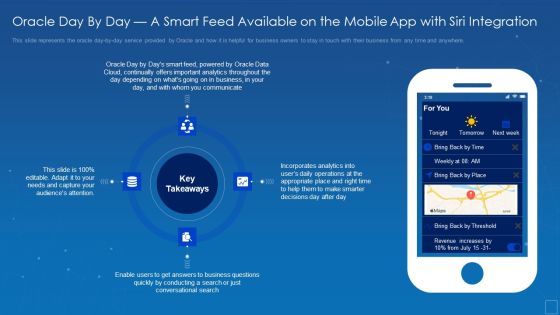
Oracle Cloud Data Analytics Administration IT Oracle Day By Day A Smart Feed Available Microsoft PDF
This slide represents the oracle day by day service provided by Oracle and how it is helpful for business owners to stay in touch with their business from any time and anywhere. This is a oracle cloud data analytics administration it oracle day by day a smart feed available microsoft pdf template with various stages. Focus and dispense information on four stages using this creative set, that comes with editable features. It contains large content boxes to add your information on topics like incorporates, decisions, appropriate, important, communicate. You can also showcase facts, figures, and other relevant content using this PPT layout. Grab it now.

Impacts Of Data Analytics On The Organization Ppt Styles Designs Download PDF
This slide describes the impacts of data science integration in the organization and how it will be helpful in decision-making to get new business opportunities to the target audience and decide future goals. This is a impacts of data analytics on the organization ppt styles designs download pdf template with various stages. Focus and dispense information on eight stages using this creative set, that comes with editable features. It contains large content boxes to add your information on topics like business opportunities, data, goals, demographic, management. You can also showcase facts, figures, and other relevant content using this PPT layout. Grab it now.
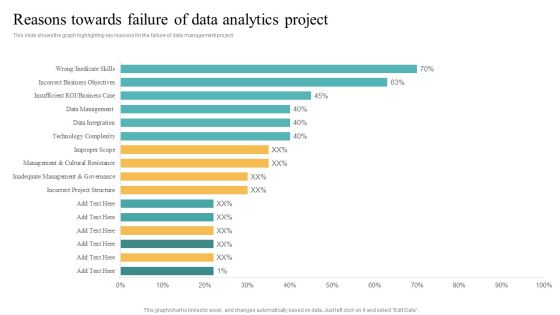
Transformation Toolkit Competitive Intelligence Information Analysis Reasons Towards Failure Of Data Analytics Project Introduction PDF
This slide shows the graph highlighting key reasons for the failure of data management project. Find highly impressive Transformation Toolkit Competitive Intelligence Information Analysis Reasons Towards Failure Of Data Analytics Project Introduction PDF on Slidegeeks to deliver a meaningful presentation. You can save an ample amount of time using these presentation templates. No need to worry to prepare everything from scratch because Slidegeeks experts have already done a huge research and work for you. You need to download Transformation Toolkit Competitive Intelligence Information Analysis Reasons Towards Failure Of Data Analytics Project Introduction PDF for your upcoming presentation. All the presentation templates are 100 percent editable and you can change the color and personalize the content accordingly. Download now.

Role Of Analytics In Transforming Healthcare Ppt PowerPoint Presentation Slides Download PDF
Pitch your topic with ease and precision using this role of analytics in transforming healthcare ppt powerpoint presentation slides download pdf. This layout presents information on disease surveillance and preventative management, effective diagnostic and therapeutic techniques, development of a faster, leaner. It is also available for immediate download and adjustment. So, changes can be made in the color, design, graphics or any other component to create a unique layout.

Customer Behavioral Data And Analytics Cart Abandonment Email Campaign And Recovery Sample PDF
Cart Abandonments can be targeted to increase revenue for the company. Measure which email campaign helped you recover the most revenue. Deliver an awe inspiring pitch with this creative customer behavioral data and analytics cart abandonment email campaign and recovery sample pdf bundle. Topics like cart abandonment email campaign and recovery can be discussed with this completely editable template. It is available for immediate download depending on the needs and requirements of the user.

Customer Behavioral Data And Analytics Personalize The Customer Experience Guidelines PDF
Customers are increasingly demanding personalization. Marketing team should personalize the experience at each stage of the journey to increase sales and retention. Deliver an awe inspiring pitch with this creative customer behavioral data and analytics personalize the customer experience guidelines pdf bundle. Topics like very satisfied, satisfied, neutral, dissatisfied, very dissatisfied can be discussed with this completely editable template. It is available for immediate download depending on the needs and requirements of the user.

Case Study Of Using Analytical Solution To Monitor Gas Data Brochure PDF
Deliver an awe inspiring pitch with this creative case study of using analytical solution to monitor gas data brochure pdf bundle. Topics like identifying productivity and quality of hydrocarbon, identifying top of reservoir and quality of hydrocarbon, recognizing productive and non productive intervals can be discussed with this completely editable template. It is available for immediate download depending on the needs and requirements of the user.

Data Analytics In Logistics And Transportation Department Ppt Show Slides PDF
This slide describes the data science in the logistic and transportation sector and how it will improve both sectors since both contain fragmented data. Deliver and pitch your topic in the best possible manner with this data analytics in logistics and transportation department ppt show slides pdf. Use them to share invaluable insights on performance, optimization, resource, productivity and impress your audience. This template can be altered and modified as per your expectations. So, grab it now.
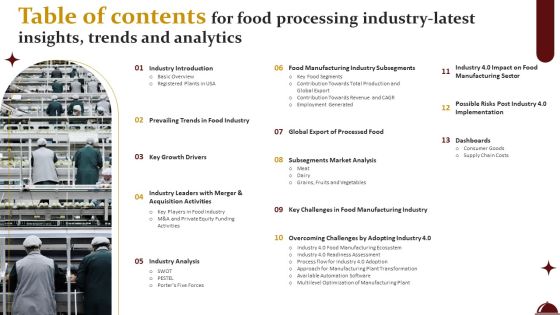
Table Of Contents For Food Processing Industry Latest Insights Trends And Analytics Graphics PDF
If your project calls for a presentation, then Slidegeeks is your go to partner because we have professionally designed, easy to edit templates that are perfect for any presentation. After downloading, you can easily edit Table Of Contents For Food Processing Industry Latest Insights Trends And Analytics Graphics PDF and make the changes accordingly. You can rearrange slides or fill them with different images. Check out all the handy templates.

Financial Analytics Solution Investor Funding Elevator Pitch Deck Ppt PowerPoint Presentation Complete Deck With Slides
Starting a presentation on business is a decision to make. As you think about it, you realize that everything is a decision. Our Financial Analytics Solution Investor Funding Elevator Pitch Deck Ppt PowerPoint Presentation Complete Deck With Slides will make all your business tasks and decisions a bit easier, with its emphasis on 0planning. The thirty eight slide complete deck allows you to present the daily challenges of business in your own way to your team, key stakeholders, and external vendors etc. With each slide being 100 percent editable and customizable, you may decide to fiddle around with the design or the content ready nature to arrive at your own, presentation on a topic of your choosing. Download now.
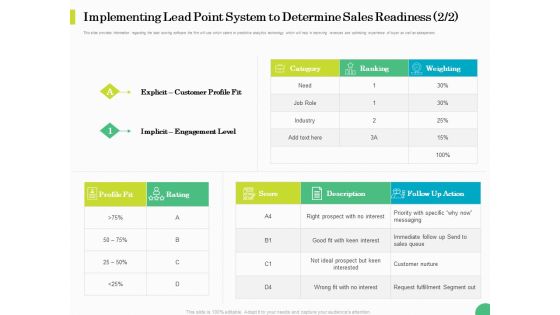
Evaluating Rank Prospects Implementing Lead Point System To Determine Sales Readiness Weighting Ppt Inspiration Portfolio PDF
This slide provides information regarding the lead scoring software the firm will use which caters to predictive analytics technology which will help in improving revenues and optimizing experience of buyer as well as salesperson. Deliver an awe-inspiring pitch with this creative evaluating rank prospects implementing lead point system to determine sales readiness weighting ppt model visuals pdf bundle. Topics like explicit customer profile fit, implicit engagement level, rating, profile fit, weighting can be discussed with this completely editable template. It is available for immediate download depending on the needs and requirements of the user.

How To Build A Revenue Funnel Implementing Lead Point System To Determine Sales Readiness Customer Background PDF
This slide provides information regarding the lead scoring software the firm will use which caters to predictive analytics technology which will help in improving revenues and optimizing experience of buyer as well as salesperson. Deliver and pitch your topic in the best possible manner with this how to build a revenue funnel implementing lead point system to determine sales readiness customer background pdf. Use them to share invaluable insights on interest, sales, customer, industry and impress your audience. This template can be altered and modified as per your expectations. So, grab it now.

Decision Trees Technique For Classification Model Forward Looking Analysis IT Summary PDF
This slide depicts the decision tree model of predictive analytics that are beneficial for quick decision-making and consists of decision node and leaf nodes. In this, leaves define a particular decision, and the branches describe the possible options.Want to ace your presentation in front of a live audience Our Decision Trees Technique For Classification Model Forward Looking Analysis IT Summary PDF can help you do that by engaging all the users towards you.. Slidegeeks experts have put their efforts and expertise into creating these impeccable powerpoint presentations so that you can communicate your ideas clearly. Moreover, all the templates are customizable, and easy-to-edit and downloadable. Use these for both personal and commercial use.

Precision Farming Market Dynamics And Trends Ppt File Example PDF
This slide covers the market dynamics and trends of precision farming market which includes key drivers, challenge, opportunity and key players. It also shows trends such as predictive analytics, operational communication, etc . Boost your pitch with our creative Precision Farming Market Dynamics And Trends Ppt File Example PDF. Deliver an awe-inspiring pitch that will mesmerize everyone. Using these presentation templates you will surely catch everyones attention. You can browse the ppts collection on our website. We have researchers who are experts at creating the right content for the templates. So you do not have to invest time in any additional work. Just grab the template now and use them.

BI Technique For Data Informed Decisions Mobile Devices Requirements For Sap Analytics Cloud Suite Clipart PDF
The following slide tabulates the mobile requirements for SAP Analytics Cloud suite in terms of mobile operating system, minimum RAM, devices supported etc. Do you have to make sure that everyone on your team knows about any specific topic I yes, then you should give BI Technique For Data Informed Decisions Mobile Devices Requirements For Sap Analytics Cloud Suite Clipart PDF a try. Our experts have put a lot of knowledge and effort into creating this impeccable BI Technique For Data Informed Decisions Mobile Devices Requirements For Sap Analytics Cloud Suite Clipart PDF. You can use this template for your upcoming presentations, as the slides are perfect to represent even the tiniest detail. You can download these templates from the Slidegeeks website and these are easy to edit. So grab these today.

BI Technique For Data Informed Decisions Pricing Plans For Sap Analytics Cloud Sample PDF
This slide represents the pricing plans for multiple licensing options of SAP Analytics Cloud. It also compares multiple suites of software on the bases of price, number of users, standard data connections, data modeling etc. Get a simple yet stunning designed BI Technique For Data Informed Decisions Pricing Plans For Sap Analytics Cloud Sample PDF. It is the best one to establish the tone in your meetings. It is an excellent way to make your presentations highly effective. So, download this PPT today from Slidegeeks and see the positive impacts. Our easy to edit BI Technique For Data Informed Decisions Pricing Plans For Sap Analytics Cloud Sample PDF can be your go to option for all upcoming conferences and meetings. So, what are you waiting for Grab this template today.

BI Technique For Data Informed Decisions Sap Analytics Cloud Comparison With Other BI Tools Structure PDF
The purpose of this slide is to showcase the comparison of SAP Analytics Cloud comparison with other available tools in the market. The comparison is done on multiple parameters such as pricing, core functionalities, and training available. Formulating a presentation can take up a lot of effort and time, so the content and message should always be the primary focus. The visuals of the PowerPoint can enhance the presenters message, so our BI Technique For Data Informed Decisions Sap Analytics Cloud Comparison With Other BI Tools Structure PDF was created to help save time. Instead of worrying about the design, the presenter can concentrate on the message while our designers work on creating the ideal templates for whatever situation is needed. Slidegeeks has experts for everything from amazing designs to valuable content, we have put everything into BI Technique For Data Informed Decisions Sap Analytics Cloud Comparison With Other BI Tools Structure PDF.

Workforce Analytics Tools For Employee Enhancement Employee Performance Management Tactics Graphics PDF
This slide represents workforce analytics tool. It includes data visualization, cloud support, real-time data analytics, actionable insights, employee experience, etc., for staff optimization.Slidegeeks is here to make your presentations a breeze with Workforce Analytics Tools For Employee Enhancement Employee Performance Management Tactics Graphics PDF With our easy-to-use and customizable templates, you can focus on delivering your ideas rather than worrying about formatting. With a variety of designs to choose from, you are sure to find one that suits your needs. And with animations and unique photos, illustrations, and fonts, you can make your presentation pop. So whether you are giving a sales pitch or presenting to the board, make sure to check out Slidegeeks first.

Data Evaluation And Processing Toolkit Change Management Data Analytics Process Themes PDF
In this slide, we are tabulating the key processes and activities involved for data management process. It contains information on implementing the change management in data analytic framework. Get a simple yet stunning designed Data Evaluation And Processing Toolkit Change Management Data Analytics Process Themes PDF. It is the best one to establish the tone in your meetings. It is an excellent way to make your presentations highly effective. So, download this PPT today from Slidegeeks and see the positive impacts. Our easy-to-edit Data Evaluation And Processing Toolkit Change Management Data Analytics Process Themes PDF can be your go-to option for all upcoming conferences and meetings. So, what are you waiting for Grab this template today.

Data Evaluation And Processing Toolkit Raci Matrix For Data Analytics Project Infographics PDF
The slide shows the RACI grid that maps out every task or steps in completing a data analytical project. Whether you have daily or monthly meetings, a brilliant presentation is necessary. Data Evaluation And Processing Toolkit Raci Matrix For Data Analytics Project Infographics PDF can be your best option for delivering a presentation. Represent everything in detail using Data Evaluation And Processing Toolkit Raci Matrix For Data Analytics Project Infographics PDF and make yourself stand out in meetings. The template is versatile and follows a structure that will cater to your requirements. All the templates prepared by Slidegeeks are easy to download and edit. Our research experts have taken care of the corporate themes as well. So, give it a try and see the results.

Data Evaluation And Processing Toolkit Training Skills Plan For Data Analytics Program Download PDF
This slide illustrates the training plan by analyzing the key skills required data analytics project. Formulating a presentation can take up a lot of effort and time, so the content and message should always be the primary focus. The visuals of the PowerPoint can enhance the presenters message, so our Data Evaluation And Processing Toolkit Training Skills Plan For Data Analytics Program Download PDF was created to help save time. Instead of worrying about the design, the presenter can concentrate on the message while our designers work on creating the ideal templates for whatever situation is needed. Slidegeeks has experts for everything from amazing designs to valuable content, we have put everything into Data Evaluation And Processing Toolkit Training Skills Plan For Data Analytics Program Download PDF.

Data Evaluation And Processing Toolkit Vendor Scan Analytics Table For Data Software Infographics PDF
In this slide, we are evaluating each vendor based on the mentioned criteria. These criteria are weighted to get a total score per vendor for checking the vvendors actual capability to deliver the analytical tool. Explore a selection of the finest Data Evaluation And Processing Toolkit Vendor Scan Analytics Table For Data Software Infographics PDF here. With a plethora of professionally designed and pre-made slide templates, you can quickly and easily find the right one for your upcoming presentation. You can use our Data Evaluation And Processing Toolkit Vendor Scan Analytics Table For Data Software Infographics PDF to effectively convey your message to a wider audience. Slidegeeks has done a lot of research before preparing these presentation templates. The content can be personalized and the slides are highly editable. Grab templates today from Slidegeeks.

Targeted Marketing Strategic Plan For Audience Engagement Website Analytics Dashboard For Consumer Data Insights Guidelines PDF
This slide showcases dashboard for website analytics that can help organization to gather data about visitors and formulate targeted marketing campaigns. It can also help to make individual and group buyer personas. This Targeted Marketing Strategic Plan For Audience Engagement Website Analytics Dashboard For Consumer Data Insights Guidelines PDF is perfect for any presentation, be it in front of clients or colleagues. It is a versatile and stylish solution for organizing your meetings. The Targeted Marketing Strategic Plan For Audience Engagement Website Analytics Dashboard For Consumer Data Insights Guidelines PDF features a modern design for your presentation meetings. The adjustable and customizable slides provide unlimited possibilities for acing up your presentation. Slidegeeks has done all the homework before launching the product for you. So, do not wait, grab the presentation templates today.
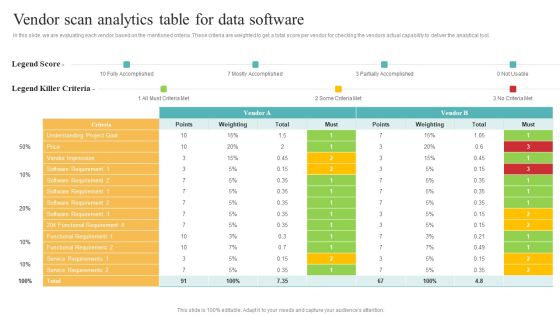
Transformation Toolkit Competitive Intelligence Information Analysis Vendor Scan Analytics Table For Data Software Template PDF
In this slide, we are evaluating each vendor based on the mentioned criteria. These criteria are weighted to get a total score per vendor for checking the vendors actual capability to deliver the analytical tool. Whether you have daily or monthly meetings, a brilliant presentation is necessary. Transformation Toolkit Competitive Intelligence Information Analysis Vendor Scan Analytics Table For Data Software Template PDF can be your best option for delivering a presentation. Represent everything in detail using Transformation Toolkit Competitive Intelligence Information Analysis Vendor Scan Analytics Table For Data Software Template PDF and make yourself stand out in meetings. The template is versatile and follows a structure that will cater to your requirements. All the templates prepared by Slidegeeks are easy to download and edit. Our research experts have taken care of the corporate themes as well. So, give it a try and see the results.
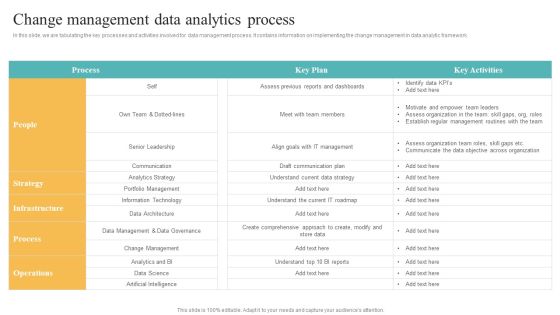
Transformation Toolkit Competitive Intelligence Information Analysis Change Management Data Analytics Process Template PDF
In this slide, we are tabulating the key processes and activities involved for data management process. It contains information on implementing the change management in data analytic framework. Formulating a presentation can take up a lot of effort and time, so the content and message should always be the primary focus. The visuals of the PowerPoint can enhance the presenters message, so our Transformation Toolkit Competitive Intelligence Information Analysis Change Management Data Analytics Process Template PDF was created to help save time. Instead of worrying about the design, the presenter can concentrate on the message while our designers work on creating the ideal templates for whatever situation is needed. Slidegeeks has experts for everything from amazing designs to valuable content, we have put everything into Transformation Toolkit Competitive Intelligence Information Analysis Change Management Data Analytics Process Template PDF

Analyzing And Deploying Human Resource Analytics Key Performance Metrics Dashboard Themes PDF
This slide shows dashboard of the human resource analytics software. It includes details related to open positions, conversion ratio, offer accepted, cost of hiring by grade etc. Do you have to make sure that everyone on your team knows about any specific topic I yes, then you should give Analyzing And Deploying Human Resource Analytics Key Performance Metrics Dashboard Themes PDF a try. Our experts have put a lot of knowledge and effort into creating this impeccable Analyzing And Deploying Human Resource Analytics Key Performance Metrics Dashboard Themes PDF. You can use this template for your upcoming presentations, as the slides are perfect to represent even the tiniest detail. You can download these templates from the Slidegeeks website and these are easy to edit. So grab these today.

Deploying Banking Transaction Using Behavioral Analytics For Multiple Transactions Structure PDF
The following slide illustrates usage of behavioral analytics for multiple transactions and profiles. It provides information about transaction, collaborative, behavior sorted, user defined, global intelligent, merchant, risk sensitivity, false positives, financial crimes, etc. Do you have an important presentation coming up Are you looking for something that will make your presentation stand out from the rest Look no further than Deploying Banking Transaction Using Behavioral Analytics For Multiple Transactions Structure PDF. With our professional designs, you can trust that your presentation will pop and make delivering it a smooth process. And with Slidegeeks, you can trust that your presentation will be unique and memorable. So why wait Grab Deploying Banking Transaction Using Behavioral Analytics For Multiple Transactions Structure PDF today and make your presentation stand out from the rest.

Toolkit For Data Science And Analytics Transition RACI Matrix For Analyzing Data In Project Diagrams PDF
The slide explains the RACI Matrix with the roles on vertical axis and tasks on horizontal axis for executing data analytics project. Explore a selection of the finest Toolkit For Data Science And Analytics Transition RACI Matrix For Analyzing Data In Project Diagrams PDF here. With a plethora of professionally designed and pre made slide templates, you can quickly and easily find the right one for your upcoming presentation. You can use our Toolkit For Data Science And Analytics Transition RACI Matrix For Analyzing Data In Project Diagrams PDF to effectively convey your message to a wider audience. Slidegeeks has done a lot of research before preparing these presentation templates. The content can be personalized and the slides are highly editable. Grab templates today from Slidegeeks.

Data Analytics Work Streams With Its Roles And Responsibilities Rules PDF
This slide highlights the key responsibilities, data work streams and. and data head roles for constructing data analytics project. Here you can discover an assortment of the finest PowerPoint and Google Slides templates. With these templates, you can create presentations for a variety of purposes while simultaneously providing your audience with an eye catching visual experience. Download Data Analytics Work Streams With Its Roles And Responsibilities Rules PDF to deliver an impeccable presentation. These templates will make your job of preparing presentations much quicker, yet still, maintain a high level of quality. Slidegeeks has experienced researchers who prepare these templates and write high quality content for you. Later on, you can personalize the content by editing the Data Analytics Work Streams With Its Roles And Responsibilities Rules PDF.

Charity Fundraising Marketing Plan Use Google Analytics To Determine Target Audience Template PDF
This slide provides an overview of the demographic derived from Google analytics to identify the target audience. Major target market includes corporate sponsors, direct beneficiaries, donors and volunteers. Do you have to make sure that everyone on your team knows about any specific topic I yes, then you should give Charity Fundraising Marketing Plan Use Google Analytics To Determine Target Audience Template PDF a try. Our experts have put a lot of knowledge and effort into creating this impeccable Charity Fundraising Marketing Plan Use Google Analytics To Determine Target Audience Template PDF. You can use this template for your upcoming presentations, as the slides are perfect to represent even the tiniest detail. You can download these templates from the Slidegeeks website and these are easy to edit. So grab these today.

Direct Response Marketing Guide Ultimate Success Analytics Dashboard To Track Mockup PDF
This slide provides an overview of the analytics dashboard that helps to measure the performance of the website. The dashboard includes visits, average session duration, bounce rate, page views and goal conversion. Find highly impressive Direct Response Marketing Guide Ultimate Success Analytics Dashboard To Track Mockup PDF on Slidegeeks to deliver a meaningful presentation. You can save an ample amount of time using these presentation templates. No need to worry to prepare everything from scratch because Slidegeeks experts have already done a huge research and work for you. You need to download Direct Response Marketing Guide Ultimate Success Analytics Dashboard To Track Mockup PDF for your upcoming presentation. All the presentation templates are 100 percent editable and you can change the color and personalize the content accordingly. Download now

Website Analytics Dashboard For Consumer Data Insights Ppt PowerPoint Presentation File Slides PDF
This slide showcases dashboard for website analytics that can help organization to gather data about visitors and formulate targeted marketing campaigns. It can also help to make individual and group buyer personas. If you are looking for a format to display your unique thoughts, then the professionally designed Website Analytics Dashboard For Consumer Data Insights Ppt PowerPoint Presentation File Slides PDF is the one for you. You can use it as a Google Slides template or a PowerPoint template. Incorporate impressive visuals, symbols, images, and other charts. Modify or reorganize the text boxes as you desire. Experiment with shade schemes and font pairings. Alter, share or cooperate with other people on your work. Download Website Analytics Dashboard For Consumer Data Insights Ppt PowerPoint Presentation File Slides PDF and find out how to give a successful presentation. Present a perfect display to your team and make your presentation unforgettable.

Guide For Marketing Analytics To Improve Decisions Social Media Marketing Channel Performance Analysis Dashboard Background PDF
The following slide showcases social media analytical dashboard to deliver best content and drive more website users. It includes elements such as post reach, sessions, organic traffic, cost per lead, page engagement, traffic through ads etc. Do you have an important presentation coming up Are you looking for something that will make your presentation stand out from the rest Look no further than Guide For Marketing Analytics To Improve Decisions Social Media Marketing Channel Performance Analysis Dashboard Background PDF. With our professional designs, you can trust that your presentation will pop and make delivering it a smooth process. And with Slidegeeks, you can trust that your presentation will be unique and memorable. So why wait Grab Guide For Marketing Analytics To Improve Decisions Social Media Marketing Channel Performance Analysis Dashboard Background PDF today and make your presentation stand out from the rest.
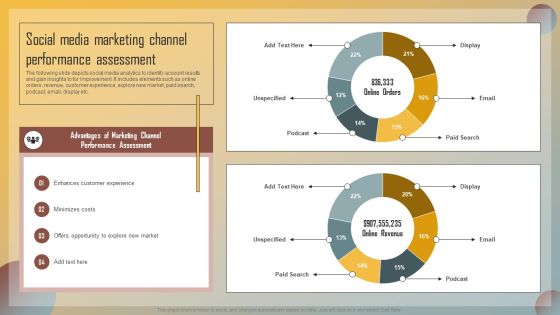
Guide For Marketing Analytics To Improve Decisions Social Media Marketing Channel Performance Assessment Pictures PDF
The following slide depicts social media analytics to identify account results and gain insights to for improvement. It includes elements such as online orders, revenue, customer experience, explore new market, paid search, podcast, email, display etc. Whether you have daily or monthly meetings, a brilliant presentation is necessary. Guide For Marketing Analytics To Improve Decisions Social Media Marketing Channel Performance Assessment Pictures PDF can be your best option for delivering a presentation. Represent everything in detail using Guide For Marketing Analytics To Improve Decisions Social Media Marketing Channel Performance Assessment Pictures PDF and make yourself stand out in meetings. The template is versatile and follows a structure that will cater to your requirements. All the templates prepared by Slidegeeks are easy to download and edit. Our research experts have taken care of the corporate themes as well. So, give it a try and see the results.

Guide For Marketing Analytics To Improve Decisions Adequate Resource Allocation For Maximum Utilization Download PDF
The following slide showcases resource allocation chart to clearly mention, track and distribute workload by leveraging analytics tools. It includes elements such as resource name, availability, allocation, completion, specified date etc. If you are looking for a format to display your unique thoughts, then the professionally designed Guide For Marketing Analytics To Improve Decisions Adequate Resource Allocation For Maximum Utilization Download PDF is the one for you. You can use it as a Google Slides template or a PowerPoint template. Incorporate impressive visuals, symbols, images, and other charts. Modify or reorganize the text boxes as you desire. Experiment with shade schemes and font pairings. Alter, share or cooperate with other people on your work. Download Guide For Marketing Analytics To Improve Decisions Adequate Resource Allocation For Maximum Utilization Download PDF and find out how to give a successful presentation. Present a perfect display to your team and make your presentation unforgettable.
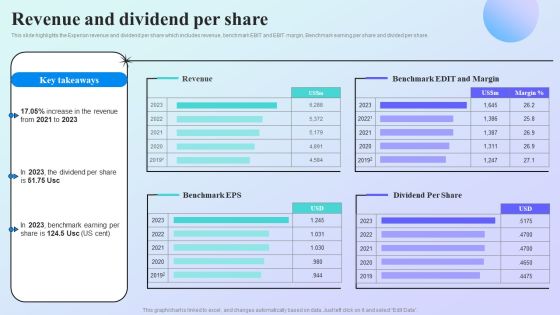
Information Analytics Company Outline Revenue And Dividend Per Share Guidelines PDF
This slide highlights the Experian revenue and dividend per share which includes revenue, benchmark EBIT and EBIT margin, Benchmark earning per share and divided per share. Presenting this PowerPoint presentation, titled Information Analytics Company Outline Revenue And Dividend Per Share Guidelines PDF, with topics curated by our researchers after extensive research. This editable presentation is available for immediate download and provides attractive features when used. Download now and captivate your audience. Presenting this Information Analytics Company Outline Revenue And Dividend Per Share Guidelines PDF. Our researchers have carefully researched and created these slides with all aspects taken into consideration. This is a completely customizable Information Analytics Company Outline Revenue And Dividend Per Share Guidelines PDF that is available for immediate downloading. Download now and make an impact on your audience. Highlight the attractive features available with our PPTs.

Website Analytics Dashboard For Consumer Data Insights Ppt Infographic Template Samples PDF
This slide showcases dashboard for website analytics that can help organization to gather data about visitors and formulate targeted marketing campaigns. It can also help to make individual and group buyer personas. Crafting an eye catching presentation has never been more straightforward. Let your presentation shine with this tasteful yet straightforward Website Analytics Dashboard For Consumer Data Insights Ppt Infographic Template Samples PDF template. It offers a minimalistic and classy look that is great for making a statement. The colors have been employed intelligently to add a bit of playfulness while still remaining professional. Construct the ideal Website Analytics Dashboard For Consumer Data Insights Ppt Infographic Template Samples PDF that effortlessly grabs the attention of your audience Begin now and be certain to wow your customers.
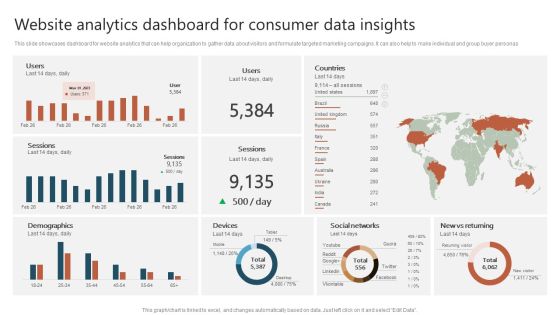
Website Analytics Dashboard For Consumer Data Insights Ppt Show Graphics Download PDF
This slide showcases dashboard for website analytics that can help organization to gather data about visitors and formulate targeted marketing campaigns. It can also help to make individual and group buyer personas. Crafting an eye catching presentation has never been more straightforward. Let your presentation shine with this tasteful yet straightforward Website Analytics Dashboard For Consumer Data Insights Ppt Show Graphics Download PDF template. It offers a minimalistic and classy look that is great for making a statement. The colors have been employed intelligently to add a bit of playfulness while still remaining professional. Construct the ideal Website Analytics Dashboard For Consumer Data Insights Ppt Show Graphics Download PDF that effortlessly grabs the attention of your audience Begin now and be certain to wow your customers.
Toolkit For Data Science And Analytics Transition Ppt PowerPoint Presentation Complete Deck With Slides
Starting a presentation on business is a decision to make. As you think about it, you realize that everything is a decision. Our Toolkit For Data Science And Analytics Transition Ppt PowerPoint Presentation Complete Deck With Slides will make all your business tasks and decisions a bit easier, with its emphasis on planning. The ninty one slide complete deck allows you to present the daily challenges of business in your own way to your team, key stakeholders, and external vendors etc. With each slide being 100 percent editable and customizable, you may decide to fiddle around with the design or the content ready nature to arrive at your own, presentation on a topic of your choosing. Download now.

Branches For Visual Analytics Branch Of Visualization Research And Development Slides PDF
This slide shows visual analytics, the last branch of visualization research, which emerged from the advancements in the other two branches and mainly focused on analytical reasoning. Want to ace your presentation in front of a live audience Our Branches For Visual Analytics Branch Of Visualization Research And Development Slides PDF can help you do that by engaging all the users towards you. Slidegeeks experts have put their efforts and expertise into creating these impeccable powerpoint presentations so that you can communicate your ideas clearly. Moreover, all the templates are customizable, and easy-to-edit and downloadable. Use these for both personal and commercial use.
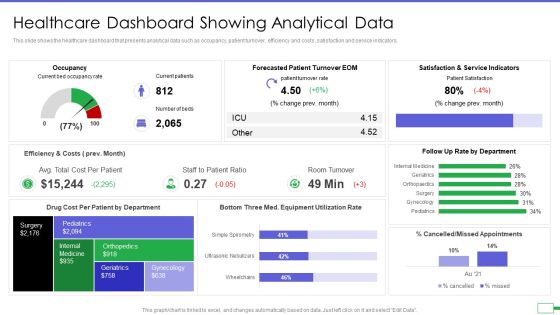
Iot And Digital Twin To Reduce Costs Post Covid Healthcare Dashboard Showing Analytical Data Elements PDF
This slide shows the healthcare dashboard that presents analytical data such as occupancy, patient turnover, efficiency and costs, satisfaction and service indicators. Deliver and pitch your topic in the best possible manner with this iot and digital twin to reduce costs post covid healthcare dashboard showing analytical data elements pdf. Use them to share invaluable insights on occupancy, patient turnover, efficiency and costs, satisfaction and service indicators and impress your audience. This template can be altered and modified as per your expectations. So, grab it now.

SAC Planning And Implementation Budget For SAP Analytics Cloud Training Clipart PDF
The slide indicates the budget plan for SAP Analytics Cloud training for the organization employees. It also contains information regarding quantity, unit cost and amount allocated for multiple training components that includes instructor fees, course acquisition and printing. Deliver an awe inspiring pitch with this creative SAC Planning And Implementation Budget For SAP Analytics Cloud Training Clipart PDF bundle. Topics like Training Components, Instructor Fee, Courseware Acquisition can be discussed with this completely editable template. It is available for immediate download depending on the needs and requirements of the user.

SAC Planning And Implementation Budget Plan For SAP Analytics Cloud Installation Diagrams PDF
The purpose of this slide to tabulates the budget plan for SAP Analytics installation. It provides details regarding multiple hardware software components, units required, unit and total prices. Deliver and pitch your topic in the best possible manner with this SAC Planning And Implementation Budget Plan For SAP Analytics Cloud Installation Diagrams PDF. Use them to share invaluable insights on Hardware Costs, Software Costs, Units Required and impress your audience. This template can be altered and modified as per your expectations. So, grab it now.

SAC Planning And Implementation Pricing Plans For SAP Analytics Cloud Information PDF
This slide represents the pricing plans for multiple licensing options of SAP Analytics Cloud. It also compares multiple suites of software on the bases of price, number of users, standard data connections, data modeling etc. Deliver an awe inspiring pitch with this creative SAC Planning And Implementation Pricing Plans For SAP Analytics Cloud Information PDF bundle. Topics like Comparison Parameters, 90 Day Trial, Price can be discussed with this completely editable template. It is available for immediate download depending on the needs and requirements of the user.

SAC Planning And Implementation Reporting Capabilities Of SAP Analytics Cloud Mockup PDF
The following slide illustrates the reporting capabilities of SAP Analytics Cloud such as storyboards, formatted reports, dashboards and applications. The comparison parameters for report are development time, level of detail, number of data sources and visualization used. Deliver an awe inspiring pitch with this creative SAC Planning And Implementation Reporting Capabilities Of SAP Analytics Cloud Mockup PDF bundle. Topics like Report Focus, Report Purpose, Development Time can be discussed with this completely editable template. It is available for immediate download depending on the needs and requirements of the user.
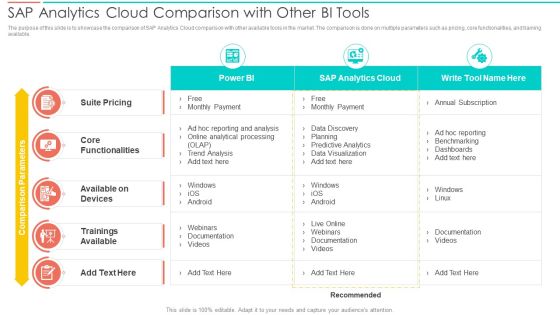
SAC Planning And Implementation SAP Analytics Cloud Comparison With Other Bi Tools Topics PDF
The purpose of this slide is to showcase the comparison of SAP Analytics Cloud comparison with other available tools in the market. The comparison is done on multiple parameters such as pricing, core functionalities, and training available. Deliver and pitch your topic in the best possible manner with this SAC Planning And Implementation SAP Analytics Cloud Comparison With Other Bi Tools Topics PDF. Use them to share invaluable insights on Suite Pricing, Core Functionalities, Trainings Available and impress your audience. This template can be altered and modified as per your expectations. So, grab it now.
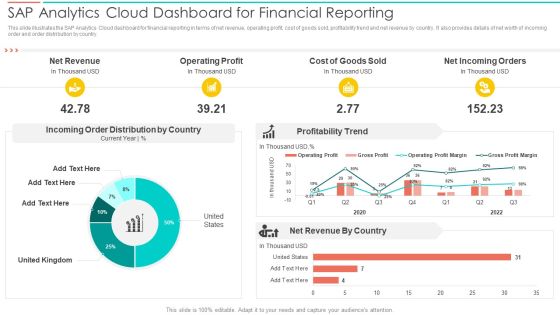
SAC Planning And Implementation SAP Analytics Cloud Dashboard For Financial Reporting Introduction PDF
This slide illustrates the SAP Analytics Cloud dashboard for financial reporting in terms of net revenue, operating profit, cost of goods sold, profitability trend and net revenue by country. It also provides details of net worth of incoming order and order distribution by country. Deliver an awe inspiring pitch with this creative SAC Planning And Implementation SAP Analytics Cloud Dashboard For Financial Reporting Introduction PDF bundle. Topics like Net Revenue, Operating Profit, Cost Goods Sold can be discussed with this completely editable template. It is available for immediate download depending on the needs and requirements of the user.
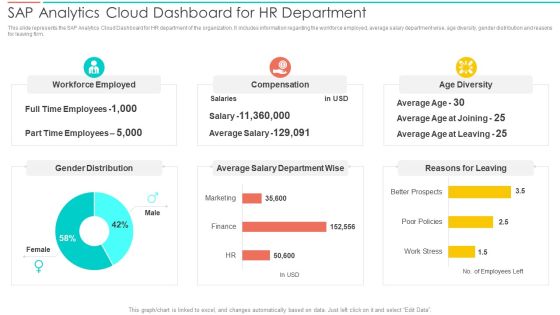
SAC Planning And Implementation SAP Analytics Cloud Dashboard For Hr Department Inspiration PDF
This slide represents the SAP Analytics Cloud Dashboard for HR department of the organization. It includes information regarding the workforce employed, average salary department wise, age diversity, gender distribution and reasons for leaving firm. Deliver and pitch your topic in the best possible manner with this SAC Planning And Implementation SAP Analytics Cloud Dashboard For Hr Department Inspiration PDF. Use them to share invaluable insights on Workforce Employed, Compensation, Age Diversity and impress your audience. This template can be altered and modified as per your expectations. So, grab it now.
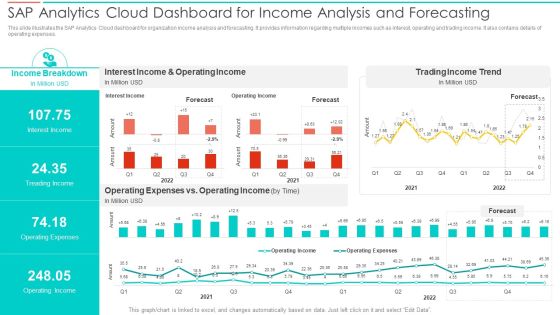
SAC Planning And Implementation SAP Analytics Cloud Dashboard For Income Analysis Summary PDF
This slide illustrates the SAP Analytics Cloud dashboard for organization income analysis and forecasting. It provides information regarding multiple incomes such as interest, operating and trading income. It also contains details of operating expenses. Deliver an awe inspiring pitch with this creative SAC Planning And Implementation SAP Analytics Cloud Dashboard For Income Analysis Summary PDF bundle. Topics like Income Breakdown, Interest Income, Operating Income, Trading Income Trend can be discussed with this completely editable template. It is available for immediate download depending on the needs and requirements of the user.
SAC Planning And Implementation SAP Analytics Cloud Dashboard For Product Sales Analysis Icons PDF
This slide illustrates the SAP Analytics Cloud dashboard to monitor product sales performance. It provides information regarding the gross margin and net revenue earned, product performance state wise and year wise. Deliver and pitch your topic in the best possible manner with this SAC Planning And Implementation SAP Analytics Cloud Dashboard For Product Sales Analysis Icons PDF. Use them to share invaluable insights on Gross Margin, Earned Quarter Wise, Gross Margin, Net Revenue and impress your audience. This template can be altered and modified as per your expectations. So, grab it now.
 Home
Home