AI PPT Maker
Templates
PPT Bundles
Design Services
Business PPTs
Business Plan
Management
Strategy
Introduction PPT
Roadmap
Self Introduction
Timelines
Process
Marketing
Agenda
Technology
Medical
Startup Business Plan
Cyber Security
Dashboards
SWOT
Proposals
Education
Pitch Deck
Digital Marketing
KPIs
Project Management
Product Management
Artificial Intelligence
Target Market
Communication
Supply Chain
Google Slides
Research Services
 One Pagers
All Categories
-
Home
- Customer Favorites
- Agile Dashboard
Agile Dashboard

Scrum For Marketing Agile Marketing Values Ppt PowerPoint Presentation Gallery Samples PDF
Presenting scrum for marketing agile marketing values ppt powerpoint presentation gallery samples pdf to provide visual cues and insights. Share and navigate important information on six stages that need your due attention. This template can be used to pitch topics like responding change plan, rapid iterations over big bang campaigns, testing and data over opinion and conventions, numerous small experiments over few big bets, individuals and interactions over large markets, collaboration over silos and hierarchy. In addtion, this PPT design contains high-resolution images, graphics, etc, that are easily editable and available for immediate download.
Scrum Practices For Marketing Teams Agile Marketing Values Ppt PowerPoint Presentation Ideas Gallery PDF
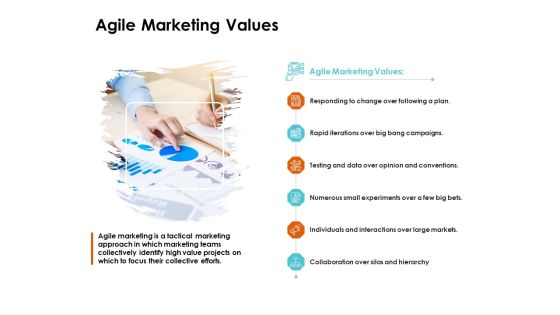
Presenting this set of slides with name scrum practices for marketing teams agile marketing values ppt powerpoint presentation ideas gallery pdf. This is a six stage process. The stages in this process are responding change over following a plan, rapid iterations over big bang campaigns, testing and data over opinion and conventions, numerous small experiments over a few big bets, individuals and interactions over large markets. This is a completely editable PowerPoint presentation and is available for immediate download. Download now and impress your audience.

Agile Process Implementation For Marketing Program Top Reasons Why The Problem Occurs Infographics PDF
Identify the major reasons for poor performance of the company to find the best solutions. Deliver and pitch your topic in the best possible manner with this agile process implementation for marketing program top reasons why the problem occurs infographics pdf. Use them to share invaluable insights on bad site navigation, long process, slow shipping, unaware shipping costs, no free shipping, only researching, only browsing, expensive shipping and impress your audience. This template can be altered and modified as per your expectations. So, grab it now.

Agile Playbook For Program Designers About This Playbook Ppt Infographics Themes PDF
This Agile Playbook For Program Designers About This Playbook Ppt Infographics Themes PDF from Slidegeeks makes it easy to present information on your topic with precision. It provides customization options, so you can make changes to the colors, design, graphics, or any other component to create a unique layout. It is also available for immediate download, so you can begin using it right away. Slidegeeks has done good research to ensure that you have everything you need to make your presentation stand out. Make a name out there for a brilliant performance.

Roadmap For Smooth Transition Of Agile Change Management Strategy Demonstration PDF
The following slide exhibits roadmap providing clear outline of goals, success metrics and plans owned by department leads. It presents information related to operations, technical excellence, etc. Pitch your topic with ease and precision using this Roadmap For Smooth Transition Of Agile Change Management Strategy Demonstration PDF. This layout presents information on Key Stages, Product, Develop. It is also available for immediate download and adjustment. So, changes can be made in the color, design, graphics or any other component to create a unique layout.

Agile Group For Product Development Essential Initiatives By Product Leader For Customer Prioritization Information PDF
This slide covers essential initiatives by product leader for customer prioritization that shows developing customer centric strategy, asking questions from customers, dig into data analytics, etc. Presenting agile group for product development essential initiatives by product leader for customer prioritization information pdf to provide visual cues and insights. Share and navigate important information on four stages that need your due attention. This template can be used to pitch topics like communicate with customers, develop customer centric strategy, asking appropriate questions about customers. In addtion, this PPT design contains high resolution images, graphics, etc, that are easily editable and available for immediate download.

Agile Group For Product Development Steps For Product Manager To Measure Business Performance Download PDF
This slide shows steps for product manager to measure business performance such as building OKR culture and invite experimentation, developing KPIs to complement OKRs and fostering continuous improvement. Presenting agile group for product development steps for product manager to measure business performance download pdf to provide visual cues and insights. Share and navigate important information on three stages that need your due attention. This template can be used to pitch topics like invite experimentation, developing kids to complement okrs, fostering continuous improvement. In addtion, this PPT design contains high resolution images, graphics, etc, that are easily editable and available for immediate download.

Agile Playbook For Program Designers User Journey Mapping For Software Development Ppt Pictures Styles PDF
This template covers customer journey flow to add new users to the portal. This customer journey flow enables the company to add and send invites to B2B companies and individual customers. The Agile Playbook For Program Designers User Journey Mapping For Software Development Ppt Pictures Styles PDF is a compilation of the most recent design trends as a series of slides. It is suitable for any subject or industry presentation, containing attractive visuals and photo spots for businesses to clearly express their messages. This template contains a variety of slides for the user to input data, such as structures to contrast two elements, bullet points, and slides for written information. Slidegeeks is prepared to create an impression.
Crystal Methods In Agile Framework Employee Training Budget For Crystal Methodology Infographics PDF
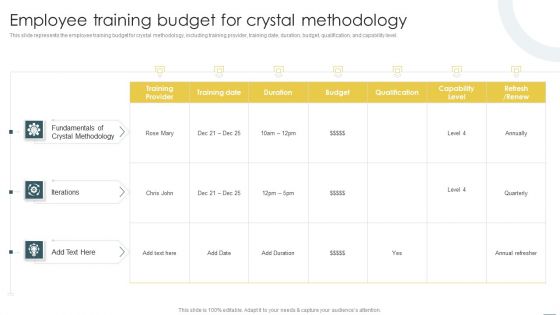
This slide represents the employee training budget for crystal methodology, including training provider, training date, duration, budget, qualification, and capability level. This Crystal Methods In Agile Framework Employee Training Budget For Crystal Methodology Infographics PDF from Slidegeeks makes it easy to present information on your topic with precision. It provides customization options, so you can make changes to the colors, design, graphics, or any other component to create a unique layout. It is also available for immediate download, so you can begin using it right away. Slidegeeks has done good research to ensure that you have everything you need to make your presentation stand out. Make a name out there for a brilliant performance.

Dashboard Ppt PowerPoint Presentation Microsoft
This is a dashboard ppt powerpoint presentation microsoft. This is a three stage process. The stages in this process are dashboard, business, marketing, speed, meter.

Dashboard Ppt PowerPoint Presentation Images
This is a dashboard ppt powerpoint presentation images. This is a one stage process. The stages in this process are dashboard, meter, speed, measure, business.

Dashboard Ppt PowerPoint Presentation Diagrams
This is a dashboard ppt powerpoint presentation diagrams. This is a four stage process. The stages in this process are performance, energy, speed.

Dashboard Ppt PowerPoint Presentation Styles
This is a dashboard ppt powerpoint presentation styles. This is a three stage process. The stages in this process are dashboard, business, marketing, meter, speed.

Dashboard Ppt PowerPoint Presentation Show
This is a dashboard ppt powerpoint presentation show. This is a three stage process. The stages in this process are speed, meter, measure, needle, calculate.

Employee Recruitment Analysis KPI Dashboard Slides PDF
The following slide presents a hiring assessment dashboard to manage HR metrics. It includes KPIs such as average time taken, cost required in hiring process along with the major sources of recruitment etc. Pitch your topic with ease and precision using this Employee Recruitment Analysis KPI Dashboard Slides PDF. This layout presents information on Agile Hiring, Non Agile Hiring, Hiring Cost Assessment. It is also available for immediate download and adjustment. So, changes can be made in the color, design, graphics or any other component to create a unique layout.

Dashboard For Tracking The AQAM Effectiveness Mockup PDF
This slide illustrates the KPI dashboard used for tracking the effectiveness of agile quality assurance model. KPIs covered in the dashboard are release and quality compliance, test functions and defects. Deliver and pitch your topic in the best possible manner with this dashboard for tracking the aqam effectiveness mockup pdf. Use them to share invaluable insights on quality, application, dashboard and impress your audience. This template can be altered and modified as per your expectations. So, grab it now.
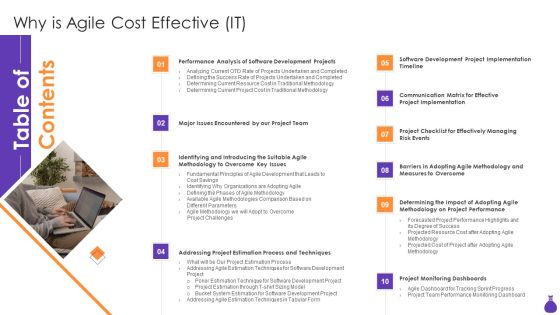
Table Of Contents Why Is Agile Cost Effective IT Wd Ppt PowerPoint Presentation File Visual Aids PDF
Presenting Table Of Contents Why Is Agile Cost Effective IT Wd Ppt PowerPoint Presentation File Visual Aids PDF to provide visual cues and insights. Share and navigate important information on ten stages that need your due attention. This template can be used to pitch topics like Addressing Project Estimation, Process And Techniques, Project Monitoring Dashboards, Major Issues Encountered By Our Project Team. In addtion, this PPT design contains high resolution images, graphics, etc, that are easily editable and available for immediate download.
Scrum Practices For Marketing Teams Agile Approach To Marketing Ppt PowerPoint Presentation Infographic Template Example Introduction PDF
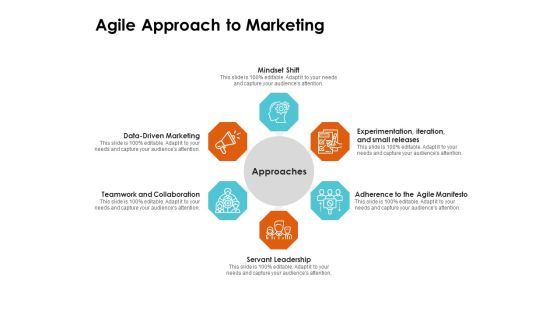
Presenting this set of slides with name scrum practices for marketing teams agile approach to marketing ppt powerpoint presentation infographic template example introduction pdf. This is a six stage process. The stages in this process are mindset shift, experimentation, iteration, and small releases, adherence agile manifesto, servant leadership, teamwork and collaboration, data driven marketing. This is a completely editable PowerPoint presentation and is available for immediate download. Download now and impress your audience.

Scrum Practices For Marketing Teams Role Of Agile Marketing Team Ppt PowerPoint Presentation Professional Background Images PDF
Presenting this set of slides with name scrum practices for marketing teams role of agile marketing team ppt powerpoint presentation professional background images pdf. This is a three stage process. The stages in this process are aligns leadership and sets team expectations, analyzes data identify opportunities, designs and prioritizes tests. This is a completely editable PowerPoint presentation and is available for immediate download. Download now and impress your audience.

Pmi Agile Scrum Master Certification It Statistics Highlighting Average Salary Of A Pmi Certificate Holder Formats PDF
Following slide provides informational stats on the average salary of a PMI certified professional. Here the slide indicates that about 2,994 product owner jobs were reported in the year 2020 with average salary of 107,855 per annum. Deliver an awe inspiring pitch with this creative pmi agile scrum master certification it statistics highlighting average salary of a pmi certificate holder formats pdf bundle. Topics like product owner, release engineer, delivery manager can be discussed with this completely editable template. It is available for immediate download depending on the needs and requirements of the user.

Three Dashboard For Financial Reporting Ppt Summary
This is a three dashboard for financial reporting ppt summary. This is a three stage process. The stages in this process are business, marketing, speed, dashboard, meter.

Dashboard Ppt PowerPoint Presentation Portfolio Demonstration
This is a dashboard ppt powerpoint presentation portfolio demonstration. This is a two stage process. The stages in this process are dashboard, finance, percentage, meter, speed.

Dashboard Ppt PowerPoint Presentation Summary Format
This is a dashboard ppt powerpoint presentation summary format. This is a one stage process. The stages in this process are speed, meter, dashboard, measure, planning.

Dashboard Ppt PowerPoint Presentation Pictures Icon
This is a dashboard ppt powerpoint presentation pictures icon. This is a six stage process. The stages in this process are dashboard, meter, measure, speed, marketing.

Dashboard Ppt PowerPoint Presentation Outline Example File
This is a dashboard ppt powerpoint presentation outline example file. This is a one stage process. The stages in this process are high speed, dashboard, business, marketing.

Dashboard Ppt PowerPoint Presentation Model Layout
This is a dashboard ppt powerpoint presentation model layout. This is a three stage process. The stages in this process are dashboard, meter, finance, speed, marketing.

Dashboard Ppt PowerPoint Presentation Model Slide Download
This is a dashboard ppt powerpoint presentation model slide download. This is a one stage process. The stages in this process are finance, planning, meter, speed, dashboard.

Dashboard Ppt PowerPoint Presentation Pictures Ideas
This is a dashboard ppt powerpoint presentation pictures ideas. This is a one stage process. The stages in this process are dashboard, high speed, medium, low.

Dashboard Ppt PowerPoint Presentation Infographics Inspiration
This is a dashboard ppt powerpoint presentation infographics inspiration. This is a one stage process. The stages in this process are dashboard, high, low, speed, medium, business.

Dashboard Ppt PowerPoint Presentation Styles Designs
This is a dashboard ppt powerpoint presentation styles designs. This is a three stage process. The stages in this process are dashboard, low, high, medium, speed.

Dashboard Ppt PowerPoint Presentation Styles Themes
This is a dashboard ppt powerpoint presentation styles themes. This is a three stage process. The stages in this process are dashboard, speed, meter, business, marketing.

Dashboard Ppt PowerPoint Presentation Pictures Show
This is a dashboard ppt powerpoint presentation pictures show. This is a three stage process. The stages in this process are high speed on, dashboard, measurement.

Dashboard Ppt PowerPoint Presentation Icon Sample
This is a dashboard ppt powerpoint presentation icon sample. This is a one stage process. The stages in this process are business, marketing, dashboard, high speed, percentage.

Dashboard Ppt PowerPoint Presentation Summary Maker
This is a dashboard ppt powerpoint presentation summary maker. This is a one stage process. The stages in this process are dashboard, marketing, speed, planning, meter.

Dashboard Ppt PowerPoint Presentation Model Portrait
This is a dashboard ppt powerpoint presentation model portrait. This is a one stage process. The stages in this process are business, marketing, high speed, dashboard, percentage.

Dashboard Ppt PowerPoint Presentation File Slide
This is a dashboard ppt powerpoint presentation file slide. This is a one stage process. The stages in this process are high speed performance on, business, marketing, meter, measure.

Dashboard Ppt PowerPoint Presentation Background Image
This is a dashboard ppt powerpoint presentation background image. This is a three stage process. The stages in this process are dashboard, measure, marketing, speed, business.

Dashboard Ppt PowerPoint Presentation Summary Aids
This is a dashboard ppt powerpoint presentation summary aids. This is a two stage process. The stages in this process are high speed, percentage, business, dashboard.

dashboard ppt powerpoint presentation model images
This is a dashboard ppt powerpoint presentation model images. This is a two stage process. The stages in this process are dashboard, low, high, speed, business.

Dashboard Ppt PowerPoint Presentation Model Graphics Template
This is a dashboard ppt powerpoint presentation model graphics template. This is a one stage process. The stages in this process are high speed dashboard, speed, technology, business, marketing.

Dashboard Ppt PowerPoint Presentation Outline Icon
This is a dashboard ppt powerpoint presentation outline icon. This is a three stage process. The stages in this process are speed, meter, business, marketing, equipment.

Dashboard Ppt PowerPoint Presentation Layouts Elements
This is a dashboard ppt powerpoint presentation layouts elements. This is a three stage process. The stages in this process are speed, meter, business, marketing, equipment.

Dashboard Ppt PowerPoint Presentation Pictures Portfolio
This is a dashboard ppt powerpoint presentation pictures portfolio. This is a three stage process. The stages in this process are speed, meter, business, marketing, equipment.

Dashboard Ppt PowerPoint Presentation Infographic Template Model
This is a dashboard ppt powerpoint presentation infographic template model. This is a four stage process. The stages in this process are business, marketing, meter, speed, measure.

Dashboard Ppt PowerPoint Presentation Visual Aids Professional
This is a dashboard ppt powerpoint presentation visual aids professional. This is a three stage process. The stages in this process are speed, meter, business, marketing, equipment.

Dashboard Ppt PowerPoint Presentation File Tips
This is a dashboard ppt powerpoint presentation file tips. This is a one stage process. The stages in this process are high speed on, process, success, business, marketing.

Dashboard Ppt PowerPoint Presentation Inspiration File Formats
This is a dashboard ppt powerpoint presentation inspiration file formats. This is a three stage process. The stages in this process are speed, meter, business, marketing, equipment.

Dashboard Ppt PowerPoint Presentation Infographics Format Ideas
This is a dashboard ppt powerpoint presentation infographics format ideas. This is a three stage process. The stages in this process are speed, meter, business, marketing, equipment.

Dashboard Ppt PowerPoint Presentation Infographics Sample
This is a dashboard ppt powerpoint presentation infographics sample. This is a one stage process. The stages in this process are speed, meter, business, marketing, equipment.

Dashboard Ppt PowerPoint Presentation Summary Example Topics
This is a dashboard ppt powerpoint presentation summary example topics. This is a one stage process. The stages in this process are speed, meter, business, marketing, equipment.

Dashboard Ppt PowerPoint Presentation Layouts Diagrams
This is a dashboard ppt powerpoint presentation layouts diagrams. This is a one stage process. The stages in this process are speed, meter, business, marketing, equipment.

Dashboard Ppt PowerPoint Presentation Pictures Outfit
This is a dashboard ppt powerpoint presentation pictures outfit. This is a two stage process. The stages in this process are speed, meter, business, marketing, equipment.

Dashboard Ppt PowerPoint Presentation Slides Styles
This is a dashboard ppt powerpoint presentation slides styles. This is a four stage process. The stages in this process are speed, meter, business, marketing, equipment.

Dashboard Ppt PowerPoint Presentation File Background
This is a dashboard ppt powerpoint presentation file background. This is a three stage process. The stages in this process are speed, meter, business, marketing, equipment.
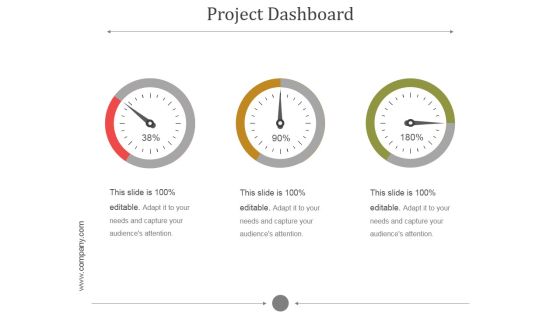
Project Dashboard Ppt PowerPoint Presentation Clipart
This is a project dashboard ppt powerpoint presentation clipart. This is a three stage process. The stages in this process are speed, meter, measure, needle, calculate.

Dashboard Ppt PowerPoint Presentation Gallery Layouts
This is a dashboard ppt powerpoint presentation gallery layouts. This is a two stage process. The stages in this process are speed, meter, business, marketing, equipment.

Dashboard Design Tools Ppt Presentation Slides
This is a dashboard design tools ppt presentation slides. This is a three stage process. The stages in this process are performance, speed, energy.

Scrum Task Project Management Dashboard Information PDF
The following slide demonstrates scrum project task management dashboard. It includes information about sprint velocity, scope changes, tasks category, tasks progress, planned, finished, added, removed, bug, story, etc. Pitch your topic with ease and precision using this Scrum Task Project Management Dashboard Information PDF. This layout presents information on Scrum Task Project, Management Dashboard. It is also available for immediate download and adjustment. So, changes can be made in the color, design, graphics or any other component to create a unique layout.

Call Center Performance KPI Dashboard Formats PDF
This slide covers contact center performance metrics KPI dashboard. It involves details such as number of total calls, average answer speed, abandon rate, data of agents performance and call abandon rate by departments. Showcasing this set of slides titled Call Center Performance KPI Dashboard Formats PDF. The topics addressed in these templates are Department, Dashboard, Agreement Limits. All the content presented in this PPT design is completely editable. Download it and make adjustments in color, background, font etc. as per your unique business setting.
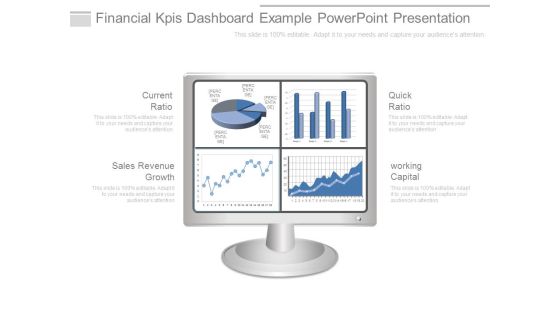
Financial Kpis Dashboard Example Powerpoint Presentation
This is a financial kpis dashboard example powerpoint presentation. This is a four stage process. The stages in this process are current ratio, sales revenue growth, quick ratio, working capital.

Organization Reinvention Digital Finance Dashboard Clipart PDF
This slide covers the advanced technologies entering the market from past few decades. The combinatorial effects of base technologies, such as mobile, cloud, sensors, analytics and the Internet of Things IoT, are accelerating progress exponentially. This slide covers transformation dashboard covering various stages of a business along with the budget and risks involved at every stage. Deliver and pitch your topic in the best possible manner with this Organization Reinvention Digital Finance Dashboard Clipart PDF. Use them to share invaluable insights on Revenue By Channels, Operating Cost, Digital Budget and impress your audience. This template can be altered and modified as per your expectations. So, grab it now.

Business Sales Procedures Improvement Dashboard Designs PDF
Following slide shows the dashboard for reengineering business sales processes which assist in accelerated processing times, lower costs, better customer service, and stronger employee retention. The KPI are proposals ,opportunities, etc. Pitch your topic with ease and precision using this Business Sales Procedures Improvement Dashboard Designs PDF. This layout presents information on Deals Opportunities Ratios, Opportunity, Deals Conversion Ratio. It is also available for immediate download and adjustment. So, changes can be made in the color, design, graphics or any other component to create a unique layout.

Marketing Campaign Performance Measurement Dashboard Download PDF
This slide represents the dashboard showing the performance of search engine marketing campaign run by an organization. It includes key performance indicators such as account activity, campaigns by targeting, landing page speed, keyword relevancy, budget spendings etc. Showcasing this set of slides titled Marketing Campaign Performance Measurement Dashboard Download PDF. The topics addressed in these templates are Keyword Relevancy, Campaigns By Targeting, Budget. All the content presented in this PPT design is completely editable. Download it and make adjustments in color, background, font etc. as per your unique business setting.
Project Tracking Issue Tracker Dashboard Rules PDF
The following slide highlights the project tracking issues in project management to determine and resolve them quickly. It includes metrics such as issue summary, priorities, responsible head, reporting and closing date etc. Showcasing this set of slides titled Project Tracking Issue Tracker Dashboard Rules PDF. The topics addressed in these templates are Inappropriate Supplies, Project, Tracker Dashboard. All the content presented in this PPT design is completely editable. Download it and make adjustments in color, background, font etc. as per your unique business setting.

Dashboard Design Sample Ppt Powerpoint Slide Ideas
This is a dashboard design sample ppt powerpoint slide ideas. This is a four stage process. The stages in this process are your current setup, message board, quick stats, progress towards goals, total posts, comments, social reactions, new users, hourly visits, bounce rate.
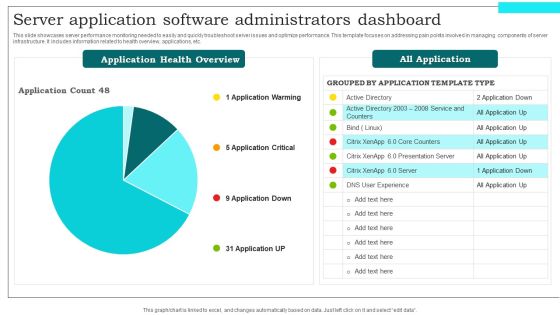
Server Application Software Administrators Dashboard Slides PDF
This slide showcases server performance monitoring needed to easily and quickly troubleshoot server issues and optimize performance. This template focuses on addressing pain points involved in managing components of server infrastructure. It includes information related to health overview, applications, etc. Showcasing this set of slides titled Server Application Software Administrators Dashboard Slides PDF. The topics addressed in these templates are Application Warming, Application Critical, Application Down. All the content presented in this PPT design is completely editable. Download it and make adjustments in color, background, font etc. as per your unique business setting.
Integrated Digital Marketing Strategy Dashboard For Lead Conversion Icons PDF
Following slide illustrates integrated marketing campaign dashboard utilized by organizations to improve business agility and increase operational efficiency. This slide provides data regarding lead conversion by campaign and channel, amount spent per campaign, monthly lead generations, etc. Showcasing this set of slides titled Integrated Digital Marketing Strategy Dashboard For Lead Conversion Icons PDF. The topics addressed in these templates are Total Page Views, Average Session Duration, Conversion. All the content presented in this PPT design is completely editable. Download it and make adjustments in color, background, font etc. as per your unique business setting.
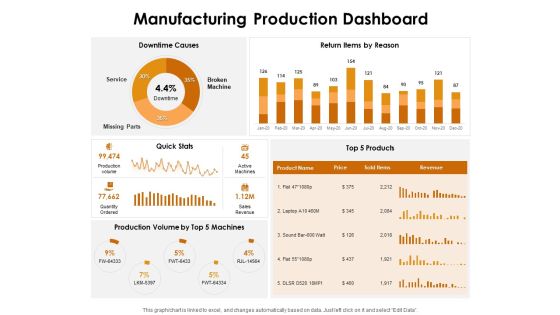
KPI Dashboards Per Industry Manufacturing Production Dashboard Ppt PowerPoint Presentation Portfolio Shapes PDF
Deliver an awe-inspiring pitch with this creative kpi dashboards per industry manufacturing production dashboard ppt powerpoint presentation portfolio shapes pdf bundle. Topics like downtime causes, return items reason, quick stats, top 5 products, production volume top 5 machines can be discussed with this completely editable template. It is available for immediate download depending on the needs and requirements of the user.

Managing Hybrid Waterfall Business Approach Project Dashboard Summary PDF
This slide illustrates agile key performance indicators for individual sprints. It includes tasks, story points, bugs, burndown charts, statistics etc. Showcasing this set of slides titled Managing Hybrid Waterfall Business Approach Project Dashboard Summary PDF. The topics addressed in these templates are Tasks, Story Points, Bugs. All the content presented in this PPT design is completely editable. Download it and make adjustments in color, background, font etc. as per your unique business setting.

Dashboard High Speed Ppt PowerPoint Presentation Icon Background Designs
This is a dashboard high speed ppt powerpoint presentation information. This is a one stage process. The stages in this process are dashboard, business, marketing, management, planning.
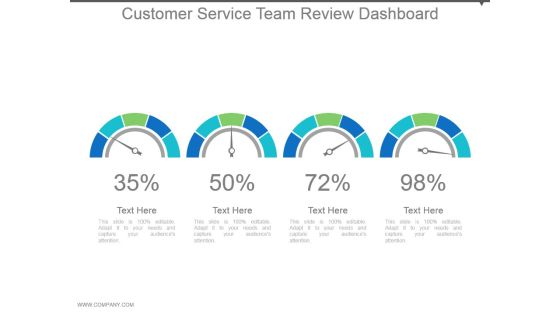
Customer Service Team Review Dashboard Powerpoint Slide Rules
This is a customer service team review dashboard powerpoint slide rules. This is a four stage process. The stages in this process are dashboard, meter, financials, speed, measure.

Enterprise Tasks Procedures And Abilities Quick Overview Dashboard Information PDF
Presenting enterprise tasks procedures and abilities quick overview dashboard information pdf to provide visual cues and insights. Share and navigate important information on three stages that need your due attention. This template can be used to pitch topics like dashboard. In addtion, this PPT design contains high resolution images, graphics, etc, that are easily editable and available for immediate download.
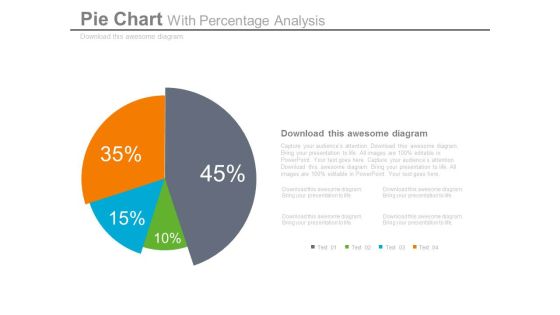
Pie Chart Dashboard Style For Percentage Analysis Powerpoint Slides
This dashboard PPT template contains graphics of pie chart. This dashboard PowerPoint template helps to display percentage analysis in a visual manner. Download this PPT slide for quick decision-making.

B2b Conversion Velocity Dashboard Ppt Gallery Guide PDF
This slide covers the conversion velocity dashboard wherein the lead count is calculated based on marketing qualified and sales qualified lead. Deliver an awe-inspiring pitch with this creative b2b conversion velocity dashboard ppt gallery guide pdf. bundle. Topics like b2b conversion velocity dashboard can be discussed with this completely editable template. It is available for immediate download depending on the needs and requirements of the user.

B2B Conversion Velocity Dashboard Ppt Outline Slide Portrait PDF
This slide covers the conversion velocity dashboard wherein the lead count is calculated based on marketing qualified and sales qualified lead.Deliver an awe-inspiring pitch with this creative B2B conversion velocity dashboard ppt outline slide portrait pdf. bundle. Topics like trending conversion rates, trending leads and cpl can be discussed with this completely editable template. It is available for immediate download depending on the needs and requirements of the user.
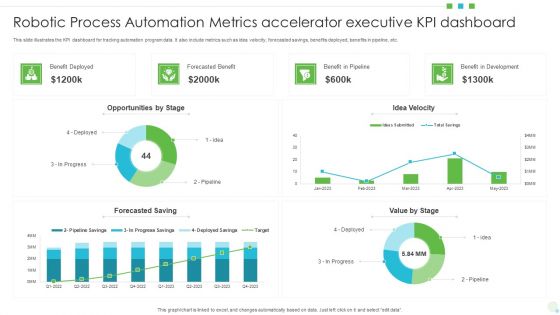
Robotic Process Automation Metrics Accelerator Executive KPI Dashboard Formats PDF
This slide illustrates the KPI dashboard for tracking automation program data. It also include metrics such as idea velocity, forecasted savings, benefits deployed, benefits in pipeline, etc. Showcasing this set of slides titled Robotic Process Automation Metrics Accelerator Executive KPI Dashboard Formats PDF. The topics addressed in these templates are Opportunities, Benefit In Development, Value. All the content presented in this PPT design is completely editable. Download it and make adjustments in color, background, font etc. as per your unique business setting.

Consumer Complaint Procedure Complaint Call Handling Dashboard Structure PDF
This slide covers the dashboard for call details including KPIs such as total calls, average answered speed, abandon rate, average calls per minute and call resolution. Deliver an awe-inspiring pitch with this creative consumer complaint procedure complaint call handling dashboard structure pdf bundle. Topics like complaint call handling dashboard, department can be discussed with this completely editable template. It is available for immediate download depending on the needs and requirements of the user.
Employee Grievance Handling Process Complaint Call Handling Dashboard Icons PDF
This slide covers the dashboard for call details including KPIs such as total calls, average answered speed, abandon rate, average calls per minute and call resolution. Deliver an awe-inspiring pitch with this creative employee grievance handling process complaint call handling dashboard icons pdf bundle. Topics like complaint call handling dashboard can be discussed with this completely editable template. It is available for immediate download depending on the needs and requirements of the user.

Customer Complaint Handling Process Complaint Call Handling Dashboard Icons PDF
This slide covers the dashboard for call details including KPIs such as total calls, average answered speed, abandon rate, average calls per minute and call resolution. Deliver an awe inspiring pitch with this creative customer complaint handling process complaint call handling dashboard icons pdf bundle. Topics like complaint call handling dashboard can be discussed with this completely editable template. It is available for immediate download depending on the needs and requirements of the user.

Quarterly Information Dashboard For Website Performance Portrait PDF
This slide displays KPI dashboard to analyze website performance and overall experience of online customers. It includes details about loading speed, internal links, views and average time. Pitch your topic with ease and precision using this Quarterly Information Dashboard For Website Performance Portrait PDF. This layout presents information on Quarterly Information, Dashboard For Website Performance. It is also available for immediate download and adjustment. So, changes can be made in the color, design, graphics or any other component to create a unique layout.

Accelerate Online Journey Now Inventory Management Dashboard Guidelines PDF
This slide covers transformation dashboard covering various stages of a business along with the budget and risks involved at every stage Deliver an awe inspiring pitch with this creative Accelerate Online Journey Now Inventory Management Dashboard Guidelines PDF bundle. Topics like Product Details, Inventory Summary, Purchase Order can be discussed with this completely editable template. It is available for immediate download depending on the needs and requirements of the user.

Accelerate Online Journey Now Business Transformation Dashboard Background PDF
This slide covers transformation dashboard covering various stages of a business along with the budget and risks involved at every stage.Deliver and pitch your topic in the best possible manner with this Accelerate Online Journey Now Business Transformation Dashboard Background PDF Use them to share invaluable insights on Mobilization Resources, Stakeholders Availability, Uncertain Timeline and impress your audience. This template can be altered and modified as per your expectations. So, grab it now.

Accelerate Online Journey Now Digital Finance Dashboard Graphics PDF
This slide covers transformation dashboard covering various stages of a business along with the budget and risks involved at every stage.Deliver and pitch your topic in the best possible manner with this Accelerate Online Journey Now Digital Finance Dashboard Graphics PDF Use them to share invaluable insights on Budget Utilization, Benefit Realization, Initiatives Benefits and impress your audience. This template can be altered and modified as per your expectations. So, grab it now.

Accelerate Online Journey Now Inventory Management Dashboard Introduction PDF
This slide covers transformation dashboard covering various stages of a business along with the budget and risks involved at every stage Deliver an awe inspiring pitch with this creative Accelerate Online Journey Now Inventory Management Dashboard Introduction PDF bundle. Topics like Sales Activity, Inventory Summary, Product can be discussed with this completely editable template. It is available for immediate download depending on the needs and requirements of the user.

Business Intelligence Dashboard To Track Call Center Kpis Download PDF
This slide showcases business intelligence dashboard to help organization track key performance metrics. It further includes details about top agents, close rate, calls handled, abandon rate, scheduled leads, average speed of answer, etc. Pitch your topic with ease and precision using this Business Intelligence Dashboard To Track Call Center Kpis Download PDF. This layout presents information on Business Intelligence Dashboard, Track Call Center Kpis. It is also available for immediate download and adjustment. So, changes can be made in the color, design, graphics or any other component to create a unique layout.

Call Centre Performance Dashboard With Customer Service Metrics Background PDF
This slide showcases dashboard for call centre performance that can help to evaluate the call abandon rate of customers and implement training of staff for improving customer satisfaction KPIs. Its key elements are total calls, avg answer speed and customer effort score. Showcasing this set of slides titled Call Centre Performance Dashboard With Customer Service Metrics Background PDF. The topics addressed in these templates are Call Centre Performance Dashboard, Customer Service Metrics. All the content presented in this PPT design is completely editable. Download it and make adjustments in color, background, font etc. as per your unique business setting.

Customer Grievance Call Handling Dashboard With Abandon Rate Introduction PDF
This slide showcases dashboard that can help organization to identify the resolution time and average abandon rate of customer grievance calls. Its key components are average answer speed, avg calls or minute and overall satisfaction score. Showcasing this set of slides titled Customer Grievance Call Handling Dashboard With Abandon Rate Introduction PDF. The topics addressed in these templates are Customer Grievance Call Handling, Dashboard With Abandon Rate. All the content presented in this PPT design is completely editable. Download it and make adjustments in color, background, font etc. as per your unique business setting.

Key Company Financials Business Intelligence Dashboard Graphics PDF
This slide showcases business intelligence dashboard to analyze key financial metrics for the organization. It includes information such as current working capital, vendor payment error rate, quick stats, budget variance, etc. Showcasing this set of slides titled Key Company Financials Business Intelligence Dashboard Graphics PDF. The topics addressed in these templates are Key Company Financials, Business Intelligence Dashboard. All the content presented in this PPT design is completely editable. Download it and make adjustments in color, background, font etc. as per your unique business setting.

Software Development Playbook Software Development Dashboard Information PDF
This slide covers software evaluation dashboard including spring details, team details to evaluate the project while proceeding to closure. Explore a selection of the finest Software Development Playbook Software Development Dashboard Information PDF here. With a plethora of professionally designed and pre made slide templates, you can quickly and easily find the right one for your upcoming presentation. You can use our Software Development Playbook Software Development Dashboard Information PDF to effectively convey your message to a wider audience. Slidegeeks has done a lot of research before preparing these presentation templates. The content can be personalized and the slides are highly editable. Grab templates today from Slidegeeks.
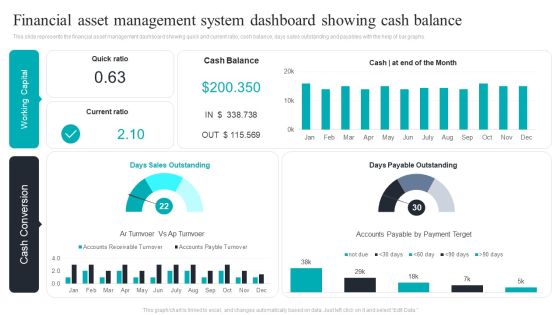
Financial Asset Management System Dashboard Showing Cash Balance Download PDF
This slide represents the financial asset management dashboard showing quick and current ratio, cash balance, days sales outstanding and payables with the help of bar graphs. Pitch your topic with ease and precision using this Financial Asset Management System Dashboard Showing Cash Balance Download PDF. This layout presents information on Financial Asset, Management System, Dashboard Showing, Cash Balance. It is also available for immediate download and adjustment. So, changes can be made in the color, design, graphics or any other component to create a unique layout.

Recurring Income Generation Model Recurring Revenue Dashboard Pictures PDF
The following slide display recurring revenue generated over the year, the following dashboard displays MRR, churn rate net recurring revenue and growth rate. Explore a selection of the finest Recurring Income Generation Model Recurring Revenue Dashboard Pictures PDF here. With a plethora of professionally designed and pre made slide templates, you can quickly and easily find the right one for your upcoming presentation. You can use our Recurring Income Generation Model Recurring Revenue Dashboard Pictures PDF to effectively convey your message to a wider audience. Slidegeeks has done a lot of research before preparing these presentation templates. The content can be personalized and the slides are highly editable. Grab templates today from Slidegeeks.

Consumer Complaint Handling Process Complaint Call Handling Dashboard Template PDF
This slide covers the dashboard for call details including KPIs such as total calls, average answered speed, abandon rate, average calls per minute and call resolution. Deliver an awe-inspiring pitch with this creative consumer complaint handling process complaint call handling dashboard template pdf bundle. Topics like abandon rate, call abandon rate department, satisfaction score, over satisfaction score can be discussed with this completely editable template. It is available for immediate download depending on the needs and requirements of the user.
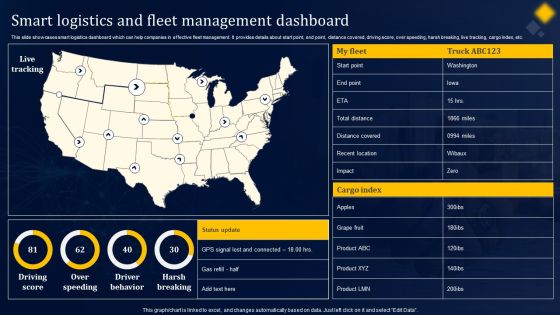
Smart Logistics And Fleet Management Dashboard Portrait PDF
This slide showcases smart logistics dashboard which can help companies in effective fleet management. It provides details about start point, end point, distance covered, driving score, over speeding, harsh breaking, live tracking, cargo index, etc. Presenting this PowerPoint presentation, titled Smart Logistics And Fleet Management Dashboard Portrait PDF, with topics curated by our researchers after extensive research. This editable presentation is available for immediate download and provides attractive features when used. Download now and captivate your audience. Presenting this Smart Logistics And Fleet Management Dashboard Portrait PDF. Our researchers have carefully researched and created these slides with all aspects taken into consideration. This is a completely customizable Smart Logistics And Fleet Management Dashboard Portrait PDF that is available for immediate downloading. Download now and make an impact on your audience. Highlight the attractive features available with our PPTs.
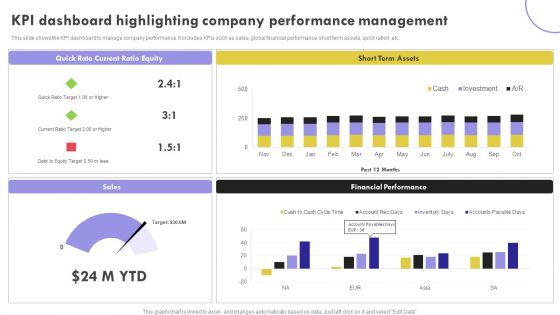
KPI Dashboard Highlighting Company Performance Management Inspiration PDF
This slide shows the KPI dashboard to manage company performance. It includes KPIs such as sales, global financial performance, short term assets, quick ration, etc.Showcasing this set of slides titled KPI Dashboard Highlighting Company Performance Management Inspiration PDF. The topics addressed in these templates are Current Ratio, Term Assets, Financial Performance. All the content presented in this PPT design is completely editable. Download it and make adjustments in color, background, font etc. as per your unique business setting.
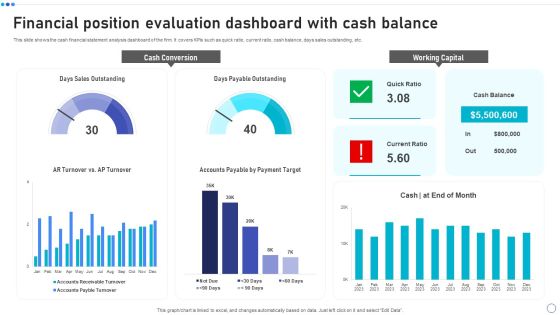
Financial Position Evaluation Dashboard With Cash Balance Rules PDF
This slide shows the cash financial statement analysis dashboard of the firm. It covers KPIs such as quick ratio, current ratio, cash balance, days sales outstanding, etc. Showcasing this set of slides titled Financial Position Evaluation Dashboard With Cash Balance Rules PDF. The topics addressed in these templates are Cash Conversion, Working Capital, Days Sales Outstanding. All the content presented in this PPT design is completely editable. Download it and make adjustments in color, background, font etc. as per your unique business setting.
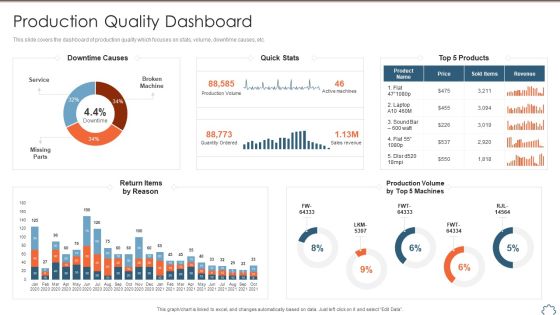
Total Productive Management At Workplace Production Quality Dashboard Background PDF
This slide covers the dashboard of production quality which focuses on stats, volume, downtime causes, etc. Deliver and pitch your topic in the best possible manner with this total productive management at workplace production quality dashboard background pdf. Use them to share invaluable insights on downtime causes, return items by reason, quick stats, production volume by top 5 machines and impress your audience. This template can be altered and modified as per your expectations. So, grab it now.

Enterprise Workforce Performance Dashboard With Sprint Review Themes PDF
This slide illustrates project extended team KPI dashboard with sprints evaluation. It provides information about average cycle time, velocity history, sprint variance, capacity variance, committed variance, etc. Showcasing this set of slides titled Enterprise Workforce Performance Dashboard With Sprint Review Themes PDF. The topics addressed in these templates are Velocity History, Sprint Variance, Average Cycle, Time Per State. All the content presented in this PPT design is completely editable. Download it and make adjustments in color, background, font etc. as per your unique business setting.
IT Project Management Progress Tracking KPI Dashboard Template PDF
This slide provides IT project development dashboard which helps managers performance status. It provides information regarding team velocity, work in story points, product estimation status, closed story point vs epic story point and pending story points. Showcasing this set of slides titled IT Project Management Progress Tracking KPI Dashboard Template PDF. The topics addressed in these templates are Team Velocity, Product Estimation Status, Pending Story Points. All the content presented in this PPT design is completely editable. Download it and make adjustments in color, background, font etc. as per your unique business setting.
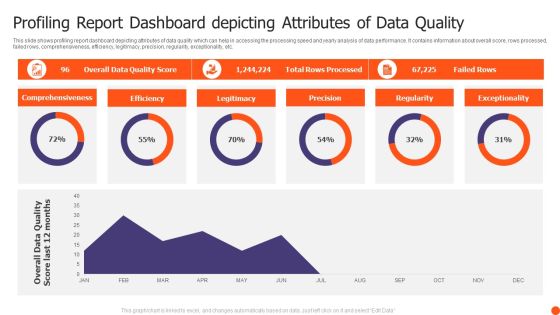
Profiling Report Dashboard Depicting Attributes Of Data Quality Themes PDF
This slide shows profiling report dashboard depicting attributes of data quality which can help in accessing the processing speed and yearly analysis of data performance. It contains information about overall score, rows processed, failed rows, comprehensiveness, efficiency, legitimacy, precision, regularity, exceptionality, etc. Pitch your topic with ease and precision using this Profiling Report Dashboard Depicting Attributes Of Data Quality Themes PDF. This layout presents information on Comprehensiveness, Efficiency, Legitimacy, Precision. It is also available for immediate download and adjustment. So, changes can be made in the color, design, graphics or any other component to create a unique layout.
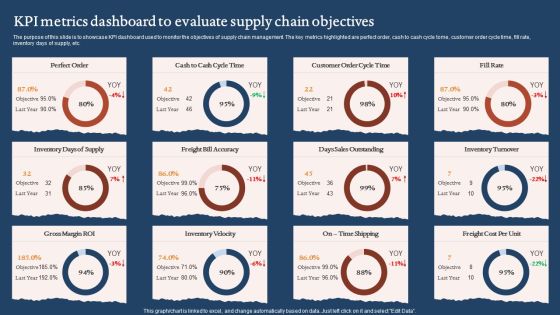
KPI Metrics Dashboard To Evaluate Supply Chain Objectives Graphics PDF
The purpose of this slide is to showcase KPI dashboard used to monitor the objectives of supply chain management. The key metrics highlighted are perfect order, cash to cash cycle tome, customer order cycle time, fill rate, inventory days of supply, etc. Pitch your topic with ease and precision using this KPI Metrics Dashboard To Evaluate Supply Chain Objectives Graphics PDF. This layout presents information on Days Sales Outstanding, Inventory Velocity, Gross Margin Roi. It is also available for immediate download and adjustment. So, changes can be made in the color, design, graphics or any other component to create a unique layout.
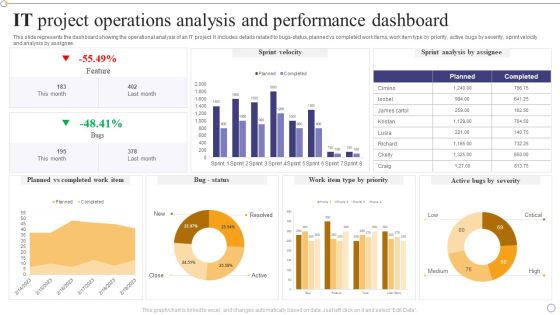
IT Project Operations Analysis And Performance Dashboard Themes PDF
This slide represents the dashboard showing the operational analysis of an IT project. It includes details related to bugs-status, planned vs completed work items, work item type by priority, active bugs by severity, sprint velocity and analysis by assignee.Showcasing this set of slides titled IT Project Operations Analysis And Performance Dashboard Themes PDF. The topics addressed in these templates are Planned Completed, Sprint Analysis, Feature. All the content presented in this PPT design is completely editable. Download it and make adjustments in color, background, font etc. as per your unique business setting.

Sales Monitoring Dashboard With Monthly Qualified Leads Guidelines PDF
This slide showcases dashboard that can help organization to monitor the sales pipeline velocity and predict future sales more accurately plus increase the leads converted. Its key components are monthly qualified leads, win rate based on deal size, monthly sales cycle and number of leads at each stage of pipeline. Pitch your topic with ease and precision using this Sales Monitoring Dashboard With Monthly Qualified Leads Guidelines PDF. This layout presents information on Monthly Qualified, Monthly Sales Cycle, Deal Size. It is also available for immediate download and adjustment. So, changes can be made in the color, design, graphics or any other component to create a unique layout.
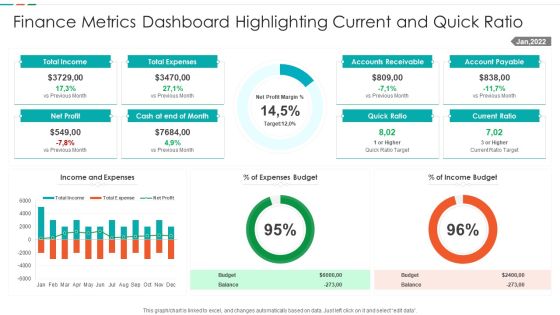
Finance Metrics Dashboard Highlighting Current And Quick Ratio Template PDF
This graph or chart is linked to excel, and changes automatically based on data. Just left click on it and select edit data. Showcasing this set of slides titled Finance Metrics Dashboard Highlighting Current And Quick Ratio Template PDF. The topics addressed in these templates are Total Income Budget, Total Expenses Balance, Net Profit Quick, Ratio Current Ratio. All the content presented in this PPT design is completely editable. Download it and make adjustments in color, background, font etc. as per your unique business setting.

Metrics Dashboard Depicting Call Center Performance Pictures PDF
Mentioned slide outlines key performance indicator KPI dashboard which can be used by call center to optimize the agents performance. The major metrics covered in the template are total calls, average speed of answer, abandon rate, service level agreement SLA limit etc. Pitch your topic with ease and precision using this Metrics Dashboard Depicting Call Center Performance Pictures PDF. This layout presents information on Overall Satisfaction Score, Satisfaction Score, Performance. It is also available for immediate download and adjustment. So, changes can be made in the color, design, graphics or any other component to create a unique layout.
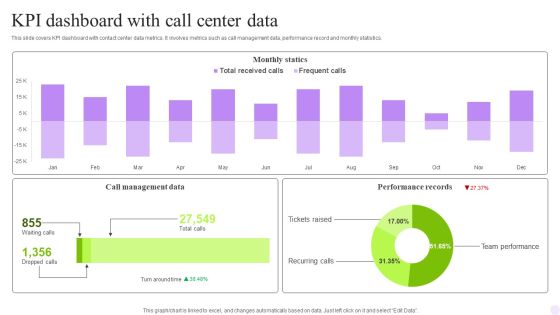
KPI Dashboard With Call Center Data Rules PDF
This slide covers contact center performance metrics KPI dashboard. It involves details such as number of total calls, average answer speed, abandon rate, data of agents performance and call abandon rate by departments. Pitch your topic with ease and precision using this KPI Dashboard With Call Center Data Rules PDF. This layout presents information on Monthly Statics, Management Data, Performance Records. It is also available for immediate download and adjustment. So, changes can be made in the color, design, graphics or any other component to create a unique layout.
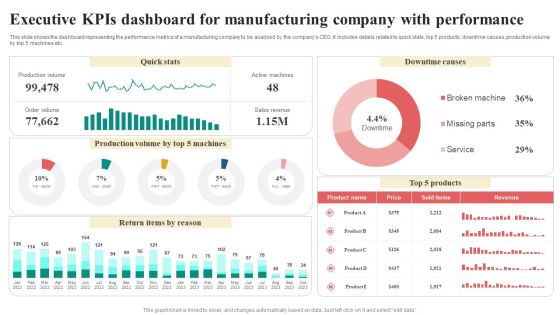
Executive Kpis Dashboard For Manufacturing Company With Performance Infographics PDF
This slide shows the dashboard representing the performance metrics of a manufacturing company to be analyzed by the companys CEO. It includes details related to quick stats, top 5 products, downtime causes, production volume by top 5 machines etc. Showcasing this set of slides titled Executive Kpis Dashboard For Manufacturing Company With Performance Infographics PDF. The topics addressed in these templates are Return Items By Reason, Quick Stats, Downtime Causes, Revenue. All the content presented in this PPT design is completely editable. Download it and make adjustments in color, background, font etc. as per your unique business setting.

Call Center Metrics Dashboard With Cost Per Contact Rules PDF
Mentioned slide outlines KPI dashboard which allows the business to monitor the efficiency of call center. The metrics covered in the slide are first call resolution, average speed of answer, customer satisfaction, cost per contact etc. Pitch your topic with ease and precision using this Call Center Metrics Dashboard With Cost Per Contact Rules PDF. This layout presents information on Cost Per Contract, Key Metrics, Customer Satisfaction. It is also available for immediate download and adjustment. So, changes can be made in the color, design, graphics or any other component to create a unique layout.

Scrum Kpis Sprint Performance Dashboard Ppt Portfolio Example Introduction PDF
This slide illustrates graphical representation of sprint performance in scrum framework. It includes KPIs like team velocity, past trends of velocity and variance in sprints etc. Showcasing this set of slides titled Scrum Kpis Sprint Performance Dashboard Ppt Portfolio Example Introduction PDF. The topics addressed in these templates are Team Velocity, Past Trends Velocity, Variance Sprint. All the content presented in this PPT design is completely editable. Download it and make adjustments in color, background, font etc. as per your unique business setting.
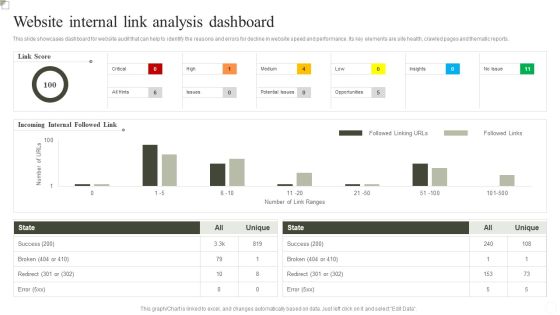
Website Internal Link Analysis Dashboard Ppt Inspiration Outline PDF
This slide showcases dashboard for website Analysis that can help to identify the reasons and errors for decline in website speed and performance. Its key elements are site health, crawled pages and thematic reports. Pitch your topic with ease and precision using this Website Internal Link Analysis Dashboard Ppt Inspiration Outline PDF. This layout presents information on Success, Incoming Internal Followed Link, Link Score. It is also available for immediate download and adjustment. So, changes can be made in the color, design, graphics or any other component to create a unique layout.
Instagram Influencer Marketing Campaign Dashboard Ppt Icon Slide PDF
This slide represents key metrics dashboard to track and measure progress of Instagram influencer marketing campaign. It includes details related to KPIs such as impressions, likes, engagement rates etc. Explore a selection of the finest Instagram Influencer Marketing Campaign Dashboard Ppt Icon Slide PDF here. With a plethora of professionally designed and pre made slide templates, you can quickly and easily find the right one for your upcoming presentation. You can use our Instagram Influencer Marketing Campaign Dashboard Ppt Icon Slide PDF to effectively convey your message to a wider audience. Slidegeeks has done a lot of research before preparing these presentation templates. The content can be personalized and the slides are highly editable. Grab templates today from Slidegeeks.

Instagram Influencer Marketing Campaign Dashboard Ppt Infographic Template Topics PDF
This slide represents key metrics dashboard to track and measure progress of Instagram influencer marketing campaign. It includes details related to KPIs such as impressions, likes, engagement rates etc. Explore a selection of the finest Instagram Influencer Marketing Campaign Dashboard Ppt Infographic Template Topics PDF here. With a plethora of professionally designed and pre made slide templates, you can quickly and easily find the right one for your upcoming presentation. You can use our Instagram Influencer Marketing Campaign Dashboard Ppt Infographic Template Topics PDF to effectively convey your message to a wider audience. Slidegeeks has done a lot of research before preparing these presentation templates. The content can be personalized and the slides are highly editable. Grab templates today from Slidegeeks.
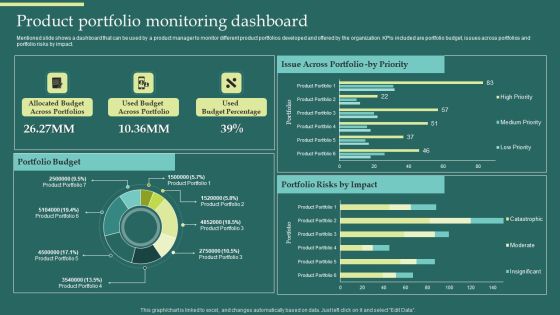
Product Portfolios And Strategic Product Portfolio Monitoring Dashboard Introduction PDF
Mentioned slide shows a dashboard that can be used by a product manager to monitor different product portfolios developed and offered by the organization. KPIs included are portfolio budget, issues across portfolios and portfolio risks by impact. Explore a selection of the finest Product Portfolios And Strategic Product Portfolio Monitoring Dashboard Introduction PDF here. With a plethora of professionally designed and pre-made slide templates, you can quickly and easily find the right one for your upcoming presentation. You can use our Product Portfolios And Strategic Product Portfolio Monitoring Dashboard Introduction PDF to effectively convey your message to a wider audience. Slidegeeks has done a lot of research before preparing these presentation templates. The content can be personalized and the slides are highly editable. Grab templates today from Slidegeeks.
Stock Inventory Acquisition Dashboard For Managing Warehouse Operations Icons PDF
This slide showcases dashboard that can help organization to manage and track the warehouse operations. Its key elements are order, volume, inventory, monthly KPIs and global financial performance. Explore a selection of the finest Stock Inventory Acquisition Dashboard For Managing Warehouse Operations Icons PDF here. With a plethora of professionally designed and pre-made slide templates, you can quickly and easily find the right one for your upcoming presentation. You can use our Stock Inventory Acquisition Dashboard For Managing Warehouse Operations Icons PDF to effectively convey your message to a wider audience. Slidegeeks has done a lot of research before preparing these presentation templates. The content can be personalized and the slides are highly editable. Grab templates today from Slidegeeks.
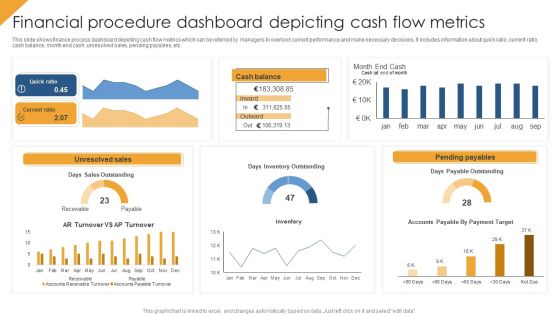
Financial Procedure Dashboard Depicting Cash Flow Metrics Structure PDF
This slide shows finance process dashboard depicting cash flow metrics which can be referred by managers to overlook current performance and make necessary decisions. It includes information about quick ratio, current ratio, cash balance, month end cash, unresolved sales, pending payables, etc. Pitch your topic with ease and precision using this Financial Procedure Dashboard Depicting Cash Flow Metrics Structure PDF. This layout presents information on Quick Ratio, Unresolved Sales, Pending Payables. It is also available for immediate download and adjustment. So, changes can be made in the color, design, graphics or any other component to create a unique layout.
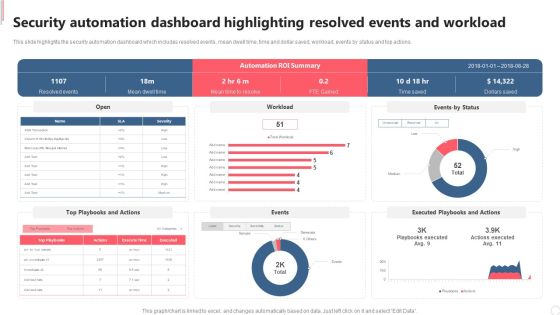
Security Automation Dashboard Highlighting Resolved Events And Workload Diagrams PDF
This slide highlights the security automation dashboard which includes resolved events, mean dwell time, time and dollar saved, workload, events by status and top actions. Explore a selection of the finest Security Automation Dashboard Highlighting Resolved Events And Workload Diagrams PDF here. With a plethora of professionally designed and pre made slide templates, you can quickly and easily find the right one for your upcoming presentation. You can use our Security Automation Dashboard Highlighting Resolved Events And Workload Diagrams PDF to effectively convey your message to a wider audience. Slidegeeks has done a lot of research before preparing these presentation templates. The content can be personalized and the slides are highly editable. Grab templates today from Slidegeeks.
Hyperautomation Performance Tracking Dashboard Hyperautomation Software Solutions IT Summary PDF
This slide depicts the performance tracking dashboard for hyper-automation, covering the number of rules triggered, automated emails, average originator, recipient, average click-through rate for automated emails, and quick links.Formulating a presentation can take up a lot of effort and time, so the content and message should always be the primary focus. The visuals of the PowerPoint can enhance the presenters message, so our Hyperautomation Performance Tracking Dashboard Hyperautomation Software Solutions IT Summary PDF was created to help save time. Instead of worrying about the design, the presenter can concentrate on the message while our designers work on creating the ideal templates for whatever situation is needed. Slidegeeks has experts for everything from amazing designs to valuable content, we have put everything into Hyperautomation Performance Tracking Dashboard Hyperautomation Software Solutions IT Summary PDF.
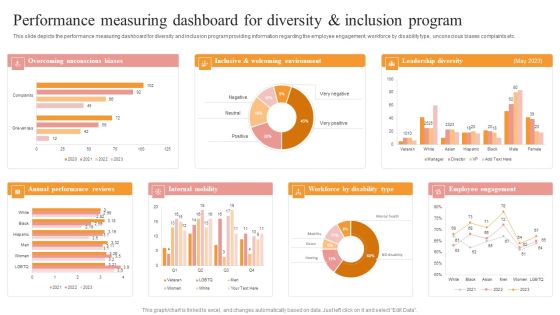
Performance Measuring Dashboard For Diversity And Inclusion Program Summary PDF
This slide depicts the performance measuring dashboard for diversity and inclusion program providing information regarding the employee engagement, workforce by disability type, unconscious biases complaints etc. Explore a selection of the finest Performance Measuring Dashboard For Diversity And Inclusion Program Summary PDF here. With a plethora of professionally designed and pre made slide templates, you can quickly and easily find the right one for your upcoming presentation. You can use our Performance Measuring Dashboard For Diversity And Inclusion Program Summary PDF to effectively convey your message to a wider audience. Slidegeeks has done a lot of research before preparing these presentation templates. The content can be personalized and the slides are highly editable. Grab templates today from Slidegeeks.
Website Performance Tracking And Monitoring Dashboard Designs PDF
The following slide showcases a dashboard to track and measure website performance. It includes key elements such as visits, average session duration, bounce rate, page views, goal conversion, visits by week, traffic sources, top channels by conversions, etc. Explore a selection of the finest Website Performance Tracking And Monitoring Dashboard Designs PDF here. With a plethora of professionally designed and pre made slide templates, you can quickly and easily find the right one for your upcoming presentation. You can use our Website Performance Tracking And Monitoring Dashboard Designs PDF to effectively convey your message to a wider audience. Slidegeeks has done a lot of research before preparing these presentation templates. The content can be personalized and the slides are highly editable. Grab templates today from Slidegeeks.
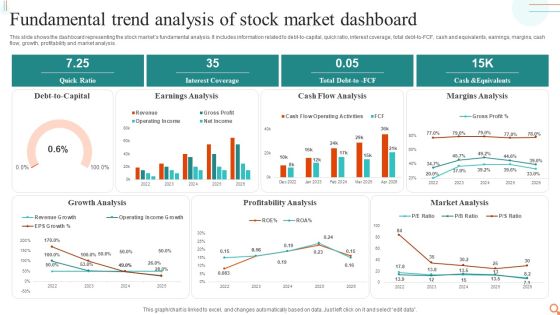
Fundamental Trend Analysis Of Stock Market Dashboard Professional PDF
This slide shows the dashboard representing the stock markets fundamental analysis. It includes information related to debt-to-capital, quick ratio, interest coverage, total debt-to-FCF, cash and equivalents, earnings, margins, cash flow, growth, profitability and market analysis.Showcasing this set of slides titled Fundamental Trend Analysis Of Stock Market Dashboard Professional PDF. The topics addressed in these templates are Earnings Analysis, Cash Flow Analysis, Margins Analysis. All the content presented in this PPT design is completely editable. Download it and make adjustments in color, background, font etc. as per your unique business setting.
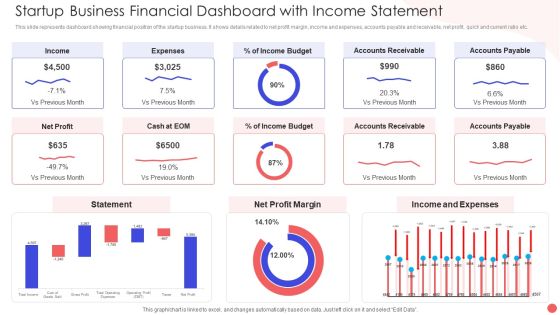
Startup Business Financial Dashboard With Income Statement Portrait PDF
This slide represents dashboard showing financial position of the startup business. It shows details related to net profit margin, income and expenses, accounts payable and receivable, net profit, quick and current ratio etc. Showcasing this set of slides titled Startup Business Financial Dashboard With Income Statement Portrait PDF. The topics addressed in these templates are Accounts Receivable Income, Income And Expenses, Net Profit Margin. All the content presented in this PPT design is completely editable. Download it and make adjustments in color, background, font etc. as per your unique business setting.
