AI PPT Maker
Templates
PPT Bundles
Design Services
Business PPTs
Business Plan
Management
Strategy
Introduction PPT
Roadmap
Self Introduction
Timelines
Process
Marketing
Agenda
Technology
Medical
Startup Business Plan
Cyber Security
Dashboards
SWOT
Proposals
Education
Pitch Deck
Digital Marketing
KPIs
Project Management
Product Management
Artificial Intelligence
Target Market
Communication
Supply Chain
Google Slides
Research Services
 One Pagers
All Categories
-
Home
- Customer Favorites
- Agenda Infographic
Agenda Infographic

Issues In Implementing Omnichannel Marketing Strategy Ppt Professional Infographics PDF
This slide shows some issues that the business faces in order to implement the Omnichannel Marketing Strategy. The issues are related to inventory management, lack of technical skills and resources, not enough warehouse locations etc. Presenting issues in implementing omnichannel marketing strategy ppt professional infographics pdf to provide visual cues and insights. Share and navigate important information on five stages that need your due attention. This template can be used to pitch topics like managing inventory, lack resources and technical skills, warehouse locations. In addtion, this PPT design contains high-resolution images, graphics, etc, that are easily editable and available for immediate download.
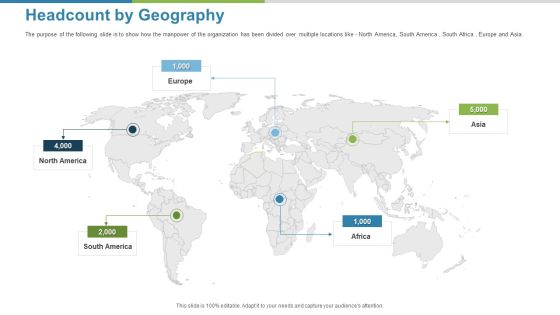
Work Execution Liability Headcount By Geography Ppt Ideas Infographics PDF
The purpose of the following slide is to show how the manpower of the organization has been divided over multiple locations like- North America, South America , South Africa , Europe and Asia. This is a work execution liability headcount by geography ppt ideas infographics pdf template with various stages. Focus and dispense information on five stages using this creative set, that comes with editable features. It contains large content boxes to add your information on topics like headcount by geography. You can also showcase facts, figures, and other relevant content using this PPT layout. Grab it now.

Organizational Culture Helping Community Ppt Infographics Objects PDF
This slide provides the ways how our company can help the community by demonstrating social values such as sponsoring charity events, donating knowledge, encourage employees to volunteer their time, etc. Presenting organizational culture helping community ppt infographics objects pdf to provide visual cues and insights. Share and navigate important information on five stages that need your due attention. This template can be used to pitch topics like sponsoring a charity event, donating knowledge, encourage employees to volunteer their time. In addtion, this PPT design contains high resolution images, graphics, etc, that are easily editable and available for immediate download.

Community Development CSR Initiatives Ppt Infographics Display PDF
This slide provide information regarding about the CSR initiatives taken by firm in context to community development in terms of procuring global human resources, hiring differently abled people and working women support. This is a community development csr initiatives ppt infographics display pdf template with various stages. Focus and dispense information on three stages using this creative set, that comes with editable features. It contains large content boxes to add your information on topics like making organizations, promoting employment, requirement, management, sales. You can also showcase facts, figures, and other relevant content using this PPT layout. Grab it now.
Key Solutions To Overcome The Challenges Ppt Icon Infographics PDF
The slide provides the key solutions which might help the company to overcome its challenges. Key solutions include track customer related metrics, focus more on promotion, personalize and quick services etc. Presenting key solutions to overcome the challenges ppt icon infographics pdf to provide visual cues and insights. Share and navigate important information on four stages that need your due attention. This template can be used to pitch topics like track customer related metrics, resolve service issues faster, personalize services. In addtion, this PPT design contains high resolution images, graphics, etc, that are easily editable and available for immediate download.
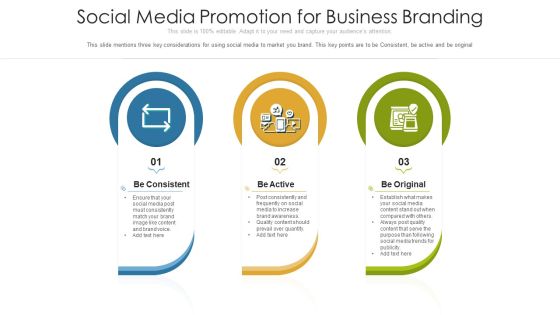
Social Media Promotion For Business Branding Ppt Infographics Rules PDF
This slide mentions three key considerations for using social media to market you brand. This key points are to be Consistent, be active and be original Persuade your audience using this social media promotion for business branding ppt infographics rules pdf. This PPT design covers three stages, thus making it a great tool to use. It also caters to a variety of topics including promotion, business, awareness. Download this PPT design now to present a convincing pitch that not only emphasizes the topic but also showcases your presentation skills.

Our Business Partnerships By Regions Ppt Infographics Elements PDF
This slide shows some of the companies with which our company has corporate tie ups and Partnerships like in US and Asia Regions. This is a our business partnerships by regions ppt infographics elements pdf template with various stages. Focus and dispense information on two stages using this creative set, that comes with editable features. It contains large content boxes to add your information on topics like partnerships in us region, partnerships in asia region. You can also showcase facts, figures, and other relevant content using this PPT layout. Grab it now.

Global Footprints Of The Company Ppt Infographics Graphic Tips PDF
This slide shows some details about the Global Footprints region wise that the company has made such as Organized a Brainstorming Event in UK, overseas investment in East Asia, new offices opened in Russia, increase in online sales in Europe etc. This is a global footprints of the company ppt infographics graphic tips pdf. template with various stages. Focus and dispense information on six stages using this creative set, that comes with editable features. It contains large content boxes to add your information on topics like united kingdom, united states, east asia, russia, europe. You can also showcase facts, figures, and other relevant content using this PPT layout. Grab it now.

Company Board Of Directors Professional Heads Ppt Infographics Show PDF
This slide shows the companys board of directors and senior executives such as chairman and chief executive officer, executive vice president, vice chairman, etc. Presenting company board of directors professional heads ppt infographics show pdf to provide visual cues and insights. Share and navigate important information on eight stages that need your due attention. This template can be used to pitch topics like company board of directors professional heads. In addtion, this PPT design contains high resolution images, graphics, etc, that are easily editable and available for immediate download.

Security Functioning Centre Facilities Offered By Successful Implementation Infographics PDF
This slide portrays information regarding the various facilities that are offered by successful implementation of SecOps in the organization in terms if malware detection, phishing detection, investigations by HR, risk mitigation, etc. Presenting security functioning centre facilities offered by successful implementation infographics pdf to provide visual cues and insights. Share and navigate important information on four stages that need your due attention. This template can be used to pitch topics like risk mitigation, investigations, employees. In addtion, this PPT design contains high resolution images, graphics, etc, that are easily editable and available for immediate download.

Customer Attrition Rate Dashboard For IBN Outsourcing Company Infographics PDF
This slide shows a Customer Attrition Rate Dashboard with KPIs such as Company Revenue , Customer Attrition Rate in 2021 , Annual Growth Rate , Average Customer Queue Time , Onboarding Process Effectiveness etc. This is a customer attrition rate dashboard for ibn outsourcing company infographics pdf template with various stages. Focus and dispense information on eight stages using this creative set, that comes with editable features. It contains large content boxes to add your information on topics like company revenue, annual growth, customer satisfaction, onboarding process, service adoption. You can also showcase facts, figures, and other relevant content using this PPT layout. Grab it now.
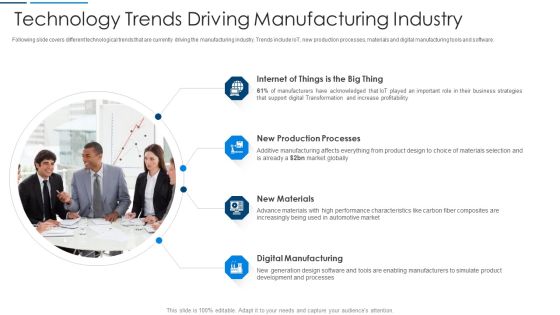
Information Transformation Organization Technology Trends Driving Manufacturing Industry Infographics PDF
Following slide covers different technological trends that are currently driving the manufacturing industry. Trends include IoT, new production processes, materials and digital manufacturing tools and software. This is a information transformation organization technology trends driving manufacturing industry infographics pdf template with various stages. Focus and dispense information on four stages using this creative set, that comes with editable features. It contains large content boxes to add your information on topics like production processes, digital manufacturing, internet of things. You can also showcase facts, figures, and other relevant content using this PPT layout. Grab it now.

Swot Analysis Threats Related To Construction Company Infographics PDF
This slide shows the various threats to the company which includes high competition, lawsuits, lack of skilled workers, currency fluctuations, etc. Presenting swot analysis threats related to construction company infographics pdf to provide visual cues and insights. Share and navigate important information on five stages that need your due attention. This template can be used to pitch topics like high competition, lawsuits, skilled workers, currency fluctuations, threat. In addtion, this PPT design contains high resolution images, graphics, etc, that are easily editable and available for immediate download.

Addressing Acquisition Channels Of Front Platform Infographics PDF
This slide caters details about different acquisition channels utilized by Front platform to enhance customer base in terms of organic growth, impressive sales and effective marketing initiatives. This is a addressing acquisition channels of front platform infographics pdf template with various stages. Focus and dispense information on three stages using this creative set, that comes with editable features. It contains large content boxes to add your information on topics like Organic growth, impressive sales, effective marketing initiatives . You can also showcase facts, figures, and other relevant content using this PPT layout. Grab it now.
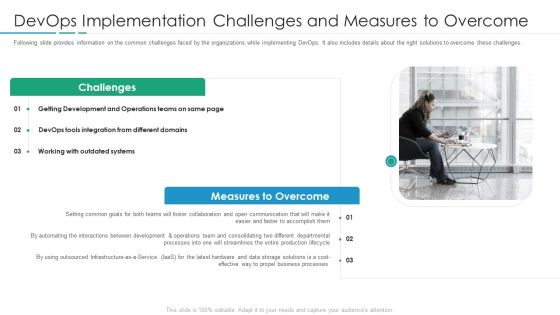
Devops Implementation Challenges And Measures To Overcome Infographics PDF
Following slide provides information on the common challenges faced by the organizations while implementing DevOps. It also includes details about the right solutions to overcome these challenges. Presenting devops implementation challenges and measures to overcome infographics pdf to provide visual cues and insights. Share and navigate important information on three stages that need your due attention. This template can be used to pitch topics like integration, development, operations. In addtion, this PPT design contains high resolution images, graphics, etc, that are easily editable and available for immediate download.
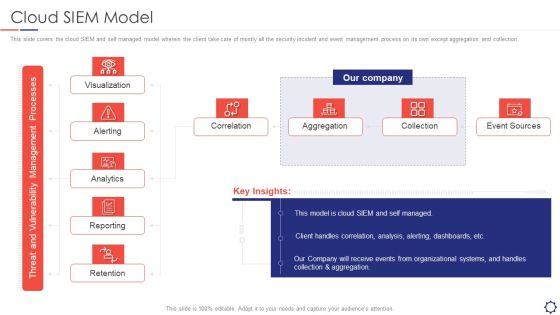
SIEM Cloud SIEM Model Ppt Infographics Picture PDF
This slide covers the cloud SIEM and self managed model wherein the client take care of mostly all the security incident and event management process on its own except aggregation and collection. This is a siem cloud siem model ppt infographics picture pdf template with various stages. Focus and dispense information on five stages using this creative set, that comes with editable features. It contains large content boxes to add your information on topics like visualization, alerting, analytics, reporting, retention. You can also showcase facts, figures, and other relevant content using this PPT layout. Grab it now.

Collection Of Information Technology Certifications Aws Certified Solutions Infographics PDF
This slide covers AWS Certified Solutions Architect certification details such as Career Path, demand, course, eligibility requirements etc. This slide covers AWS Certified Solutions Architect certification details such as Career Path, demand, course, eligibility requirements etc. Presenting collection of information technology certifications aws certified solutions infographics pdf to provide visual cues and insights. Share and navigate important information on four stages that need your due attention. This template can be used to pitch topics like growth, market, technology, developing, management systems. In addtion, this PPT design contains high resolution images, graphics, etc, that are easily editable and available for immediate download.

Techniques Used In Ethical Hacking Ppt Infographics Guide PDF
This slide represents the techniques of ethical hacking such as port scanning, analyzing and sniffing network traffic, detection of SQL injections, an inspection of patch installation. This is a techniques used in ethical hacking ppt infographics guide pdf template with various stages. Focus and dispense information on six stages using this creative set, that comes with editable features. It contains large content boxes to add your information on topics like systems, methods, analyzing, network, information. You can also showcase facts, figures, and other relevant content using this PPT layout. Grab it now.
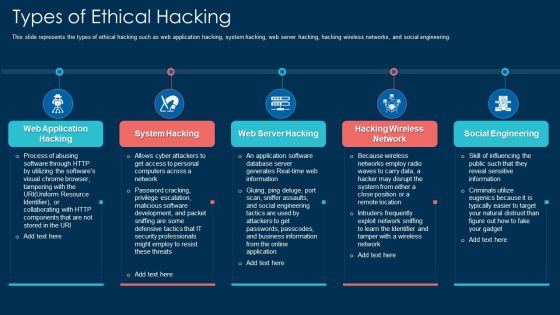
Types Of Ethical Hacking Ppt Infographics Clipart Images PDF
This slide represents the types of ethical hacking such as web application hacking, system hacking, web server hacking, hacking wireless networks, and social engineering. This is a types of ethical hacking ppt infographics clipart images pdf template with various stages. Focus and dispense information on five stages using this creative set, that comes with editable features. It contains large content boxes to add your information on topics like system hacking, hacking wireless network, social engineering, web application hacking. You can also showcase facts, figures, and other relevant content using this PPT layout. Grab it now.

Best Practices For Cyber Safety At Job Safety Infographics PDF
This slide covers the best practices for cyber safety at workplace which includes protecting the data, using strong password protection, connecting to the secure wi-fi, investing in security systems, etc. Presenting best practices for cyber safety at job safety infographics pdf to dispense important information. This template comprises four stages. It also presents valuable insights into the topics including protecting data, connect to secure wi fi, invest in security systems, strong password protection. This is a completely customizable PowerPoint theme that can be put to use immediately. So, download it and address the topic impactfully.

SIEM Services Log Management Services Ppt Infographics Visuals PDF
This slide covers the log management services offered by our company such as collection and normalization, search speed, real time analysis, decision making process etc. This is a siem services log management services ppt infographics visuals pdf template with various stages. Focus and dispense information on five stages using this creative set, that comes with editable features. It contains large content boxes to add your information on topics like collection and normalization, time analysis, making process, compliance. You can also showcase facts, figures, and other relevant content using this PPT layout. Grab it now.

levels of brand awareness impacting customer perception infographics pdf
This slide represents levels of brand awareness impacting customer perception such as brand recognition, brand recall, mind recall, brand supremacy and knowledge about the brand. Persuade your audience using this levels of brand awareness impacting customer perception infographics pdf. This PPT design covers six stages, thus making it a great tool to use. It also caters to a variety of topics including brand knowledge, brand recognition, brand supremacy. Download this PPT design now to present a convincing pitch that not only emphasizes the topic but also showcases your presentation skills.

Eight Step Process Of Kotter Change Model Infographics PDF
This slide shows eight step process of kotter change model beneficial for HR team to hire new employees with maximum efficiency. It also provides information about create, build, form, enlist, enable, generate, sustain and institute.Presenting eight step process of kotter change model infographics pdf to dispense important information. This template comprises eight stages. It also presents valuable insights into the topics including employees in recruitment, douglas costa will deliver, communication This is a completely customizable PowerPoint theme that can be put to use immediately. So, download it and address the topic impactfully.

Cryptocurrency Investment Playbook What Is Crypto Currency Infographics PDF
Purpose of the following slide is to provide an overview of cryptocurrency, it helps the organization to understand how crypto works and major types of cryptocurrency, these types can be Bitcoin, Bitcoin Cash, Cardoon, ethereum etc. Presenting cryptocurrency investment playbook what is crypto currency infographics pdf to provide visual cues and insights. Share and navigate important information on six stages that need your due attention. This template can be used to pitch topics like what is crypto currency In addtion, this PPT design contains high resolution images, graphics, etc, that are easily editable and available for immediate download.

Cost Reduction Strategies For Employee Healthcare Infographics PDF
This slide shows cost containment techniques for healthcare of workers. It provides information such as eliminate unnecessary spending, optimize funding arrangement and create better clinical outcomes. Persuade your audience using this Cost Reduction Strategies For Employee Healthcare Infographics PDF. This PPT design covers three stages, thus making it a great tool to use. It also caters to a variety of topics including Expenses, Management, Financial. Download this PPT design now to present a convincing pitch that not only emphasizes the topic but also showcases your presentation skills.
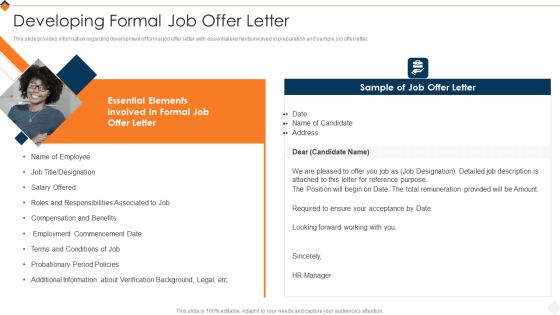
Optimizing Recruitment Process Developing Formal Job Offer Letter Infographics PDF
This slide provides information regarding development of formal job offer letter with essential elements involved in preparation and sample job offer letter. Presenting Optimizing Recruitment Process Developing Formal Job Offer Letter Infographics PDF to provide visual cues and insights. Share and navigate important information on one stage that need your due attention. This template can be used to pitch topics like Essential Elements, Responsibilities Associated, Employment Commencement In addtion, this PPT design contains high resolution images, graphics, etc, that are easily editable and available for immediate download.

Counselling Diversity Issues In Career Development Infographics PDF
This slide depicts counselling multicultural issues in career development which can be referred by counselors to manage complex and dynamic situations in their sessions. It includes information about personal factors, socioeconomic, educational and tangible obstacles. Presenting Counselling Diversity Issues In Career Development Infographics PDF to dispense important information. This template comprises four stages. It also presents valuable insights into the topics including Personal Factors, Socioeconomic, Educational. This is a completely customizable PowerPoint theme that can be put to use immediately. So, download it and address the topic impactfully.
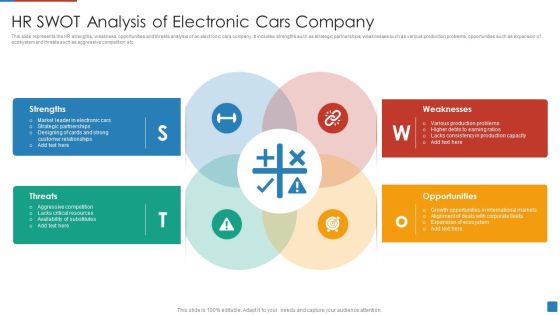
HR SWOT Analysis Of Electronic Cars Company Infographics PDF
This slide represents the HR strengths, weakness, opportunities and threats analysis of an electronic cars company. It includes strengths such as strategic partnerships, weaknesses such as various production problems, opportunities such as expansion of ecosystem and threats such as aggressive competition etc.Presenting HR SWOT Analysis Of Electronic Cars Company Infographics PDF to dispense important information. This template comprises four stages. It also presents valuable insights into the topics including Market Leader, Strategic Partnerships, Designing Strong This is a completely customizable PowerPoint theme that can be put to use immediately. So, download it and address the topic impactfully.

Developing Business Analytics Framework Different Categories Associated Infographics PDF
This slide covers information regarding the various categories associated to IT infrastructure management in terms of essential tasks associated with each segment such as system management, network management and storage management. Presenting Developing Business Analytics Framework Different Categories Associated Infographics PDF to provide visual cues and insights. Share and navigate important information on three stages that need your due attention. This template can be used to pitch topics like Systems Management, Network Management, Storage Management In addtion, this PPT design contains high resolution images, graphics, etc, that are easily editable and available for immediate download.
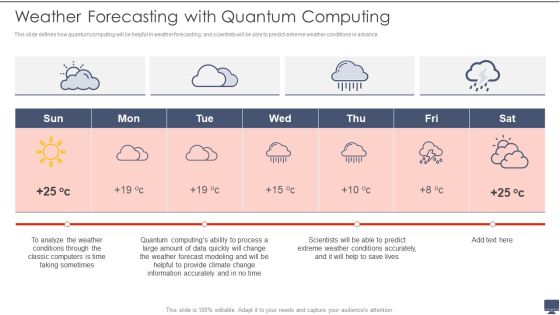
Weather Forecasting With Quantum Computing Ppt Infographics Influencers PDF
This slide defines how quantum computing will be helpful in weather forecasting, and scientists will be able to predict extreme weather conditions in advance. This is a Weather Forecasting With Quantum Computing Ppt Infographics Influencers PDF template with various stages. Focus and dispense information on four stages using this creative set, that comes with editable features. It contains large content boxes to add your information on topics like Analyze, Information Accurately, Quantum Computings. You can also showcase facts, figures, and other relevant content using this PPT layout. Grab it now.

Bank Branch Audit Financial Regulatory Compliance Checklist Infographics PDF
The following slide showcases checklist of bank branch audit and status. it includes verifying nostro reconciliation, analyzing outstanding entries, classification of revenue and expenditure, verification of locker rent and stationary.Presenting Bank Branch Audit Financial Regulatory Compliance Checklist Infographics PDF to dispense important information. This template comprises one stage. It also presents valuable insights into the topics including Responsible Person, Verification Reconciliation, Evaluating Proper This is a completely customizable PowerPoint theme that can be put to use immediately. So, download it and address the topic impactfully.
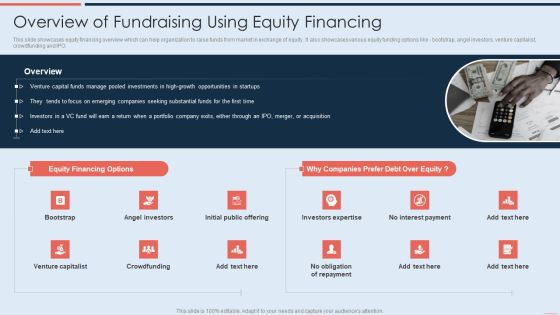
Overview Of Fundraising Using Equity Financing Infographics PDF
This slide showcases equity financing overview which can help organization to raise funds from market in exchange of equity. It also showcases various equity funding options like - bootstrap, angel investors, venture capitalist, crowdfunding and IPO. This is a Overview Of Fundraising Using Equity Financing Infographics PDF template with various stages. Focus and dispense information on one stages using this creative set, that comes with editable features. It contains large content boxes to add your information on topics like Angel Investors, Investors Expertise, Venture Capitalist. You can also showcase facts, figures, and other relevant content using this PPT layout. Grab it now.
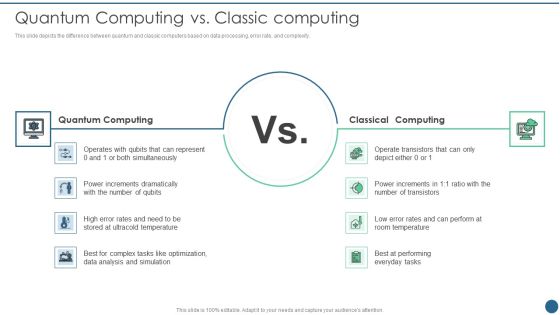
Quantum Key Distribution Quantum Computing Vs Classic Computing Infographics PDF
This slide depicts the difference between quantum and classic computers based on data processing, error rate, and complexity.This is a Quantum Key Distribution Quantum Computing Vs Classic Computing Infographics PDF template with various stages. Focus and dispense information on two stages using this creative set, that comes with editable features. It contains large content boxes to add your information on topics like Quantum Computing, Classical Computing, Increments Dramatically You can also showcase facts, figures, and other relevant content using this PPT layout. Grab it now.

Security And Surveillance Company Profile SWOT Analysis Infographics PDF
This slide highlights the security company SWOT analysis which includes one high quality products as strengths, 1 year subscription as weakness, high industry growth as opportunity and competitive market as threats. This is a Security And Surveillance Company Profile SWOT Analysis Infographics PDF template with various stages. Focus and dispense information on four stages using this creative set, that comes with editable features. It contains large content boxes to add your information on topics like Financials Position, Innovation Centers, Operations Services. You can also showcase facts, figures, and other relevant content using this PPT layout. Grab it now.

Security Camera System Company Profile SWOT Analysis Infographics PDF
This slide highlights the security company SWOT analysis which includes one high quality products as strengths, 1 year subscription as weakness, high industry growth as opportunity and competitive market as threats. This is a Security Camera System Company Profile SWOT Analysis Infographics PDF template with various stages. Focus and dispense information on four stages using this creative set, that comes with editable features. It contains large content boxes to add your information on topics like Strengths, Weaknesses, Opportunities. You can also showcase facts, figures, and other relevant content using this PPT layout. Grab it now.

Small Business Venture Company Profile Case Study Approach Infographics PDF
This slide shows the case study which includes challenge faced by client in establishing cloud platform to access applications on demand that our company considered and offered high tech service to reduce cost incurred by client.This is a Small Business Venture Company Profile Case Study Approach Infographics PDF template with various stages. Focus and dispense information on three stages using this creative set, that comes with editable features. It contains large content boxes to add your information on topics like Key Challenge, Solution, Outcome. You can also showcase facts, figures, and other relevant content using this PPT layout. Grab it now.

Four Stages Of Business Environment Evaluating Infographics PDF
This slide focuses on the four stages of business environment analysis which includes scanning, monitoring, forecasting and assessing that are helpful in identifying the environmental trends and patterns to determine the impact on organization. Persuade your audience using this Four Stages Of Business Environment Evaluating Infographics PDF. This PPT design covers four stages, thus making it a great tool to use. It also caters to a variety of topics including Monitoring, Scanning, Forecasting. Download this PPT design now to present a convincing pitch that not only emphasizes the topic but also showcases your presentation skills.

Security Agency Business Profile Swot Analysis Infographics PDF
This slide highlights the security company SWOT analysis which includes 30 years experience as strengths, attacks on security personnel as weakness, high industry growth as opportunity and high attrition rate as threats. This is a Security Agency Business Profile Swot Analysis Infographics PDF template with various stages. Focus and dispense information on four stages using this creative set, that comes with editable features. It contains large content boxes to add your information on topics like Strengths, Weaknesses, Opportunities, Threats. You can also showcase facts, figures, and other relevant content using this PPT layout. Grab it now.

Salesforce Business Profile Other Salesforce Solutions Infographics PDF
This slide highlights the top brands salesforce own which includes tableau data analytics software, slack develop applications, MuleSoft connect customers, and Heroku PaaS software. Presenting Salesforce Business Profile Other Salesforce Solutions Infographics PDF to provide visual cues and insights. Share and navigate important information on four stages that need your due attention. This template can be used to pitch topics like Tableau, Mulesoft, Heroku, Slack. In addtion, this PPT design contains high resolution images, graphics, etc, that are easily editable and available for immediate download.

Brand Loyalty Pyramid To Retain Consumer Infographics PDF
This slide covers the brand loyalty pyramid to retain customers which includes swithers, satisfied and habitual customers, satisfied customers with switching costs, brand likers customer and committed customers. Presenting Brand Loyalty Pyramid To Retain Consumer Infographics PDF to dispense important information. This template comprises five stages. It also presents valuable insights into the topics including Switching Costs, Satisfied Or Habitual Buyers, Brand Likers. This is a completely customizable PowerPoint theme that can be put to use immediately. So, download it and address the topic impactfully.

Commercial And Urban Architect Business Profile Swot Analysis Infographics PDF
This slide highlights the SWOT analysis of the architecture company which includes strengths as 30 years of practice experience, weakness as External financing required, threats as high competition. This is a Commercial And Urban Architect Business Profile Swot Analysis Infographics PDF template with various stages. Focus and dispense information on four stages using this creative set, that comes with editable features. It contains large content boxes to add your information on topics like Strengths, Weaknesses, Threats, Opportunities. You can also showcase facts, figures, and other relevant content using this PPT layout. Grab it now.

Strategies To Achieve Production Growth Targets Infographics PDF
This slide contains the strategies used by the organizations for increasing the manufacturing growth to growth the revenue and its business. It includes market penetration, diversification , acquisition, etc. Persuade your audience using this Strategies To Achieve Production Growth Targets Infographics PDF. This PPT design covers four stages, thus making it a great tool to use. It also caters to a variety of topics including Market Penetration, Market Development And Expansion, Diversification. Download this PPT design now to present a convincing pitch that not only emphasizes the topic but also showcases your presentation skills.

Banking Operations Management Online Bill Payment Services Infographics PDF
This slide highlights the online bill payment services which showcases pay bills form one stop mobile application it also depicts key features of application which covers registration, notified, auto pay and payment confirmation. Presenting Banking Operations Management Online Bill Payment Services Infographics PDF to provide visual cues and insights. Share and navigate important information on two stages that need your due attention. This template can be used to pitch topics like Payment Confirmation, Tax Payment, Insurance Premium. In addtion, this PPT design contains high resolution images, graphics, etc, that are easily editable and available for immediate download.

Optimizing Digital Content For Better Customer Reach Infographics PDF
This slide covers strategies for improving online content for increasing brand visibility. It includes strategic methods such as meta description, SEO writing, internal links, etc. It also includes best practices such as creating interactive content, repurposing and updating old content, etc. Presenting Optimizing Digital Content For Better Customer Reach Infographics PDF to provide visual cues and insights. Share and navigate important information on three stages that need your due attention. This template can be used to pitch topics like Meta Descriptions, SEO Writing, Internal Links. In addtion, this PPT design contains high resolution images, graphics, etc, that are easily editable and available for immediate download.

Brand Engagement Promotional Campaign Implementation Puzzle Infographics PDF
This modern and well-arranged Brand Engagement Promotional Campaign Implementation Puzzle Infographics PDF provides lots of creative possibilities. It is very simple to customize and edit with the Powerpoint Software. Just drag and drop your pictures into the shapes. All facets of this template can be edited with Powerpoint no extra software is necessary. Add your own material, put your images in the places assigned for them, adjust the colors, and then you can show your slides to the world, with an animated slide included.

Technologies To Enhance Communication Between HR And Employees Infographics PDF
This slide provides an overview of technologies used to improve communication. The technologies used are instant messaging platforms, video chat tools, team collaboration software and social media platforms. Slidegeeks has constructed Technologies To Enhance Communication Between HR And Employees Infographics PDF after conducting extensive research and examination. These presentation templates are constantly being generated and modified based on user preferences and critiques from editors. Here, you will find the most attractive templates for a range of purposes while taking into account ratings and remarks from users regarding the content. This is an excellent jumping off point to explore our content and will give new users an insight into our top notch PowerPoint Templates.
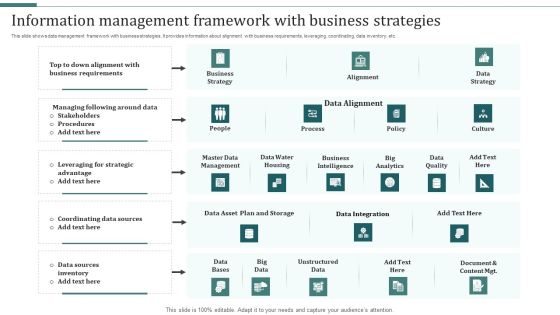
Information Management Framework With Business Strategies Infographics PDF
This slide shows data management framework with business strategies. It provides information about alignment with business requirements, leveraging, coordinating, data inventory, etc. Persuade your audience using this Information Management Framework With Business Strategies Infographics PDF. This PPT design covers five stages, thus making it a great tool to use. It also caters to a variety of topics including Master Data Management, Data Integration, Unstructured Data. Download this PPT design now to present a convincing pitch that not only emphasizes the topic but also showcases your presentation skills.

Interoperability Software Testing Semantic Interoperability Testing Type Infographics PDF
This slide represents the semantic type of interoperability testing that concentrates on the data transported algorithm and tests the semantics involved. Retrieve professionally designed Interoperability Software Testing Semantic Interoperability Testing Type Infographics PDF to effectively convey your message and captivate your listeners. Save time by selecting pre made slideshows that are appropriate for various topics, from business to educational purposes. These themes come in many different styles, from creative to corporate, and all of them are easily adjustable and can be edited quickly. Access them as PowerPoint templates or as Google Slides themes. You do not have to go on a hunt for the perfect presentation because Slidegeeks got you covered from everywhere.

Our Mission Sample Asset Valuation Summary Infographics PDF
Do you know about Slidesgeeks Our Mission Sample Asset Valuation Summary Infographics PDF These are perfect for delivering any kind od presentation. Using it, create PowerPoint presentations that communicate your ideas and engage audiences. Save time and effort by using our pre-designed presentation templates that are perfect for a wide range of topic. Our vast selection of designs covers a range of styles, from creative to business, and are all highly customizable and easy to edit. Download as a PowerPoint template or use them as Google Slides themes.

Digital Banking Approach For Customer Segments Infographics PDF
This slide mentions online banking approach implemented for various customer segments. The segments mentioned are Baby Boomers, Gen X, Millennials and Gen Z. Persuade your audience using this Digital Banking Approach For Customer Segments Infographics PDF. This PPT design covers Four stages, thus making it a great tool to use. It also caters to a variety of topics including Baby Boomers, Millennials, Customer Segments. Download this PPT design now to present a convincing pitch that not only emphasizes the topic but also showcases your presentation skills.

Terms And Conditions For Commercial Loan Financing Proposal Infographics PDF
This slide represents terms and conditions for private money lending proposal including collateral, default, severability, exclusive jurisdiction for suit in case of breach, borrower, lender, principal loan amount, etc. Unleash your creativity with our Terms And Conditions For Commercial Loan Financing Proposal Infographics PDF single-slide PPT template. Whether you are a seasoned presenter or a newbie, our editable and visually stunning template will make your presentations shine. This template is versatile and easy to use. Make your presentations unforgettable with our premium template and leave a lasting impression on your audience.
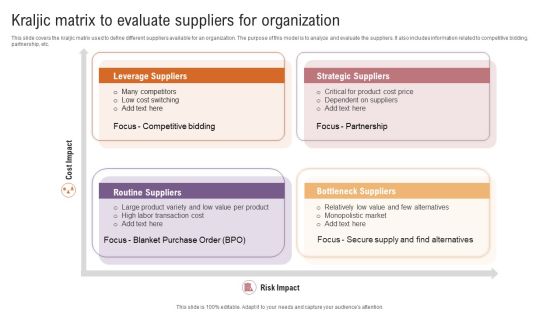
Kraljic Matrix To Evaluate Suppliers For Organization Infographics PDF
This slide covers the kraljic matrix used to define different suppliers available for an organization. The purpose of this model is to analyze and evaluate the suppliers. It also includes information related to competitive bidding, partnership, etc. Persuade your audience using this Kraljic Matrix To Evaluate Suppliers For Organization Infographics PDF. This PPT design covers Four stages, thus making it a great tool to use. It also caters to a variety of topics including Many Competitors, Dependent On Suppliers. Download this PPT design now to present a convincing pitch that not only emphasizes the topic but also showcases your presentation skills.
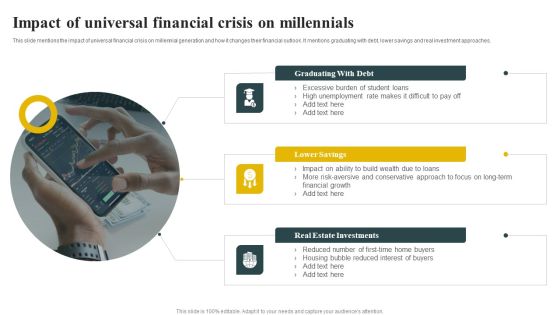
Impact Of Universal Financial Crisis On Millennials Infographics PDF
This slide mentions the impact of universal financial crisis on millennial generation and how it changes their financial outlook. It mentions graduating with debt, lower savings and real investment approaches. Presenting Impact Of Universal Financial Crisis On Millennials Infographics PDF to dispense important information. This template comprises three stages. It also presents valuable insights into the topics including Graduating With Debt, Lower Savings, Real Estate Investments. This is a completely customizable PowerPoint theme that can be put to use immediately. So, download it and address the topic impactfully.
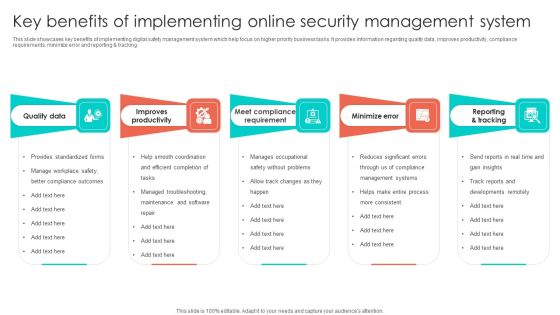
Key Benefits Of Implementing Online Security Management System Infographics PDF
This slide showcases key benefits of implementing digital safety management system which help focus on higher priority business tasks. It provides information regarding quality data, improves productivity, compliance requirements, minimize error and reporting and tracking. Presenting Key Benefits Of Implementing Online Security Management System Infographics PDF to dispense important information. This template comprises five stages. It also presents valuable insights into the topics including Improves Productivity, Quality Data, Minimize Error. This is a completely customizable PowerPoint theme that can be put to use immediately. So, download it and address the topic impactfully.

Business Case Of Robotic Desktop Automation In Banking Infographics PDF
This slide consists of strategic business case of incorporating attended automation in banking and financial sector. The business case relates to organizational challenge, attended automation solutions and impact. Presenting Business Case Of Robotic Desktop Automation In Banking Infographics PDF to dispense important information. This template comprises three stages. It also presents valuable insights into the topics including Organizational Challenge, Attended Automation Solutions, Impact. This is a completely customizable PowerPoint theme that can be put to use immediately. So, download it and address the topic impactfully.

Process For Undertaking Effective Car Mortgage Infographics PDF
This slide exhibits phases for initiating car loan. It aims on providing lenient eligibility criteria and minimal documentation operations. It provides information related to tenure selection, budget fixing, making down payments, etc. Presenting Process For Undertaking Effective Car Mortgage Infographics PDF to dispense important information. This template comprises five stages. It also presents valuable insights into the topics including Budget Fixing, Compare Loan Options, Tenure Selection. This is a completely customizable PowerPoint theme that can be put to use immediately. So, download it and address the topic impactfully.
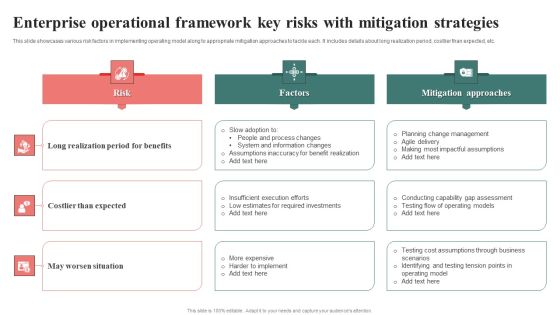
Enterprise Operational Framework Key Risks With Mitigation Strategies Infographics PDF
This slide showcases various risk factors in implementing operating model along to appropriate mitigation approaches to tackle each. It includes details about long realization period, costlier than expected, etc. Presenting Enterprise Operational Framework Key Risks With Mitigation Strategies Infographics PDF to dispense important information. This template comprises three stages. It also presents valuable insights into the topics including Risk, Factors, Mitigation Approaches. This is a completely customizable PowerPoint theme that can be put to use immediately. So, download it and address the topic impactfully.

Viral Marketing Crisis Causing Factors And Resolving Strategies Infographics PDF
The slide highlights several buzz marketing challenges and provide solutions to eliminate them and improve business productivity and profitability. Its key issues are sensitive subjects, controlling communication, evaluate effectiveness and other propagation factors. Persuade your audience using this Viral Marketing Crisis Causing Factors And Resolving Strategies Infographics PDF. This PPT design covers three stages, thus making it a great tool to use. It also caters to a variety of topics including Factors, Description, Solution. Download this PPT design now to present a convincing pitch that not only emphasizes the topic but also showcases your presentation skills.

5 Vs Of Big Data Analysis Infographics PDF
This slide showcases five Vs which are volume, veracity, variety, velocity and value. Each aspect is considered for the analytics purpose. Volume defines data in numbers, veracity explains whether the data is useful or not, variety tell whether the data is in the structured or unstructured form etc. Persuade your audience using this 5 Vs Of Big Data Analysis Infographics PDF. This PPT design covers five stages, thus making it a great tool to use. It also caters to a variety of topics including Velocity, Volume, Veracity. Download this PPT design now to present a convincing pitch that not only emphasizes the topic but also showcases your presentation skills.

Customised Advertising Strategies For Concentrated Businesses Infographics PDF
This slide contains strategies for niche market in order to promote products and services to small and well defined segment of audience. These strategies include consumer generated content, partnerships, offline marketing and leverage sustainable marketing. Persuade your audience using this Customised Advertising Strategies For Concentrated Businesses Infographics PDF. This PPT design covers four stages, thus making it a great tool to use. It also caters to a variety of topics including Partnerships, Offline Marketing, Leverage Sustainable Mediums. Download this PPT design now to present a convincing pitch that not only emphasizes the topic but also showcases your presentation skills.

Key Capabilities And Skills In Business Analysis Infographics PDF
This slide covers key competencies required for business analysis to assess candidates and efficiently structure resource pool for future tasks. This consists of analytical thinking, behavioural characteristics, business knowledge and interaction skills. Presenting Key Capabilities And Skills In Business Analysis Infographics PDF to dispense important information. This template comprises four stages. It also presents valuable insights into the topics including Analytical Thinking, Behavioural Characteristics, Business Knowledge. This is a completely customizable PowerPoint theme that can be put to use immediately. So, download it and address the topic impactfully.

Chief Information Officer Transition Challenges And Solutions Infographics PDF
This slide includes challenges faced by CIO during transition and solutions to help them create value as member of C-suite. It includes challenges such as retaining IT talent, supporting hybrid work, deploying automation and navigating inflation. Presenting Chief Information Officer Transition Challenges And Solutions Infographics PDF to dispense important information. This template comprises five stages. It also presents valuable insights into the topics including Retaining IT Talent, Supporting Hybrid Work, Deploying Automation. This is a completely customizable PowerPoint theme that can be put to use immediately. So, download it and address the topic impactfully.

Impact Of Artificial Intelligence In Insurance Claims Management Infographics PDF
This slide presents benefits of AI in insurance claims management, helpful in highlighting its importance in making each process smooth and easy. It includes impacts such as risk assessment, fraud detection, human error reduction and customer service management. Persuade your audience using this Impact Of Artificial Intelligence In Insurance Claims Management Infographics PDF. This PPT design covers four stages, thus making it a great tool to use. It also caters to a variety of topics including Risk Assessment, Human Error Reduction, Customer Service Management. Download this PPT design now to present a convincing pitch that not only emphasizes the topic but also showcases your presentation skills.

Timeframe Request For Branding Proposal Ppt Infographics Template PDF
This slide covers the timeline for providing branding services. It includes the major project phases such as discovery meetings, present strategy, initial design concepts, refined designs, and brand guidelines documents. Unleash your creativity with our Timeframe Request For Branding Proposal Ppt Infographics Template PDF single-slide PPT template. Whether you are a seasoned presenter or a newbie, our editable and visually-stunning template will make your presentations shine. This template is versatile and easy to use. Make your presentations unforgettable with our premium template and leave a lasting impression on your audience.

Working Of Software Development Life Cycle Infographics PDF
This slide describes the software development life cycle working that runs in a loop and starts from business needs, solution requirements, solutions features, software needs, analysis and design, code development, testing, and so on. If your project calls for a presentation, then Slidegeeks is your go to partner because we have professionally designed, easy to edit templates that are perfect for any presentation. After downloading, you can easily edit Working Of Software Development Life Cycle Infographics PDF and make the changes accordingly. You can rearrange slides or fill them with different images. Check out all the handy templates.
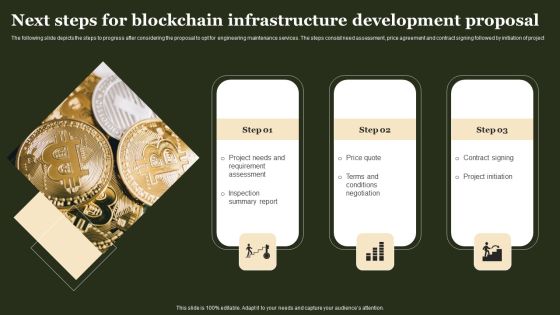
Next Steps For Blockchain Infrastructure Development Proposal Infographics PDF
The following slide depicts the steps to progress after considering the proposal to opt for engineering maintenance services. The steps consist need assessment, price agreement and contract signing followed by initiation of project Take your presentations to the next level with our Next Steps For Blockchain Infrastructure Development Proposal Infographics PDF template. With its sleek design and seamless editing features, this single-slide PPT template is a game-changer for professionals who want to make an impact. Impress your audience with stunning visuals and engaging content that will capture their attention from start to finish. Get your hands on our template and elevate your presentations to new heights.

Problems In The Business Value Chain Infographics PDF
The following template provides solutions to overcome pain points in business value chain to helps minimize delays, which is crucial for maintaining financial efficiency and efficacy. The various challenges are centralized inventory management system, material shortages etc. Presenting Problems In The Business Value Chain Infographics PDF to dispense important information. This template comprises four stages. It also presents valuable insights into the topics including Centralized Inventory Management, Material Shortages, Lack Supply Chain Visibility. This is a completely customizable PowerPoint theme that can be put to use immediately. So, download it and address the topic impactfully.
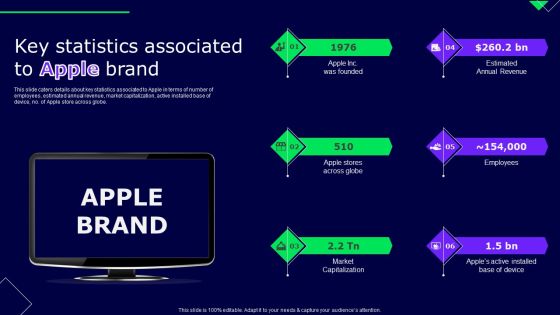
Key Statistics Associated To Apple Brand Ppt Infographics Aids PDF
This slide caters details about key statistics associated to Apple in terms of number of employees, estimated annual revenue, market capitalization, active installed base of device, no. of Apple store across globe. The best PPT templates are a great way to save time, energy, and resources. Slidegeeks have 100 percent editable powerpoint slides making them incredibly versatile. With these quality presentation templates, you can create a captivating and memorable presentation by combining visually appealing slides and effectively communicating your message. Download Key Statistics Associated To Apple Brand Ppt Infographics Aids PDF from Slidegeeks and deliver a wonderful presentation.
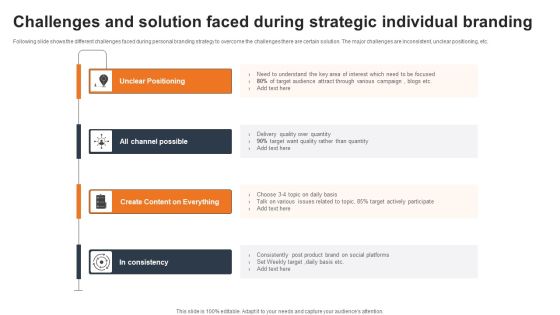
Challenges And Solution Faced During Strategic Individual Branding Infographics PDF
Following slide shows the different challenges faced during personal branding strategy to overcome the challenges there are certain solution. The major challenges are inconsistent, unclear positioning, etc. Persuade your audience using this Challenges And Solution Faced During Strategic Individual Branding Infographics PDF. This PPT design covers four stages, thus making it a great tool to use. It also caters to a variety of topics including Target, Social Platforms, Product Brand. Download this PPT design now to present a convincing pitch that not only emphasizes the topic but also showcases your presentation skills.
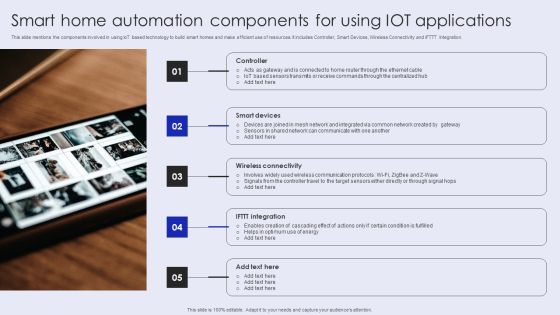
Smart Home Automation Components For Using Iot Applications Infographics PDF
This slide mentions the components involved in using IoT based technology to build smart homes and make efficient use of resources. It includes Controller, Smart Devices, Wireless Connectivity and IFTTT Integration. Persuade your audience using this Smart Home Automation Components For Using Iot Applications Infographics PDF. This PPT design covers five stages, thus making it a great tool to use. It also caters to a variety of topics including Smart Devices, Wireless Connectivity, Controller. Download this PPT design now to present a convincing pitch that not only emphasizes the topic but also showcases your presentation skills.
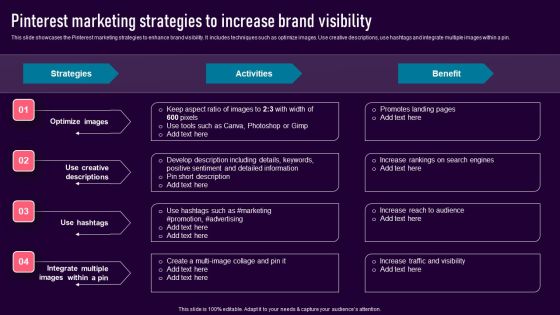
Pinterest Marketing Strategies To Increase Brand Visibility Infographics PDF
This slide showcases the Pinterest marketing strategies to enhance brand visibility. It includes techniques such as optimize images. Use creative descriptions, use hashtags and integrate multiple images within a pin. Slidegeeks is one of the best resources for PowerPoint templates. You can download easily and regulate Pinterest Marketing Strategies To Increase Brand Visibility Infographics PDF for your personal presentations from our wonderful collection. A few clicks is all it takes to discover and get the most relevant and appropriate templates. Use our Templates to add a unique zing and appeal to your presentation and meetings. All the slides are easy to edit and you can use them even for advertisement purposes.

Global Communication Strategies To Reach Transnational Customers Infographics PDF
Following slide describes global communication strategies used by businesses to increase customer base. It includes strategies such as global standardization strategy, transactional strategy, international strategy and localization strategy. Persuade your audience using this Global Communication Strategies To Reach Transnational Customers Infographics PDF. This PPT design covers four stages, thus making it a great tool to use. It also caters to a variety of topics including Global Standardization Strategy, Transnational Strategy, Localization Strategy. Download this PPT design now to present a convincing pitch that not only emphasizes the topic but also showcases your presentation skills.
Smart Strategies For Coordinate With Various Teams Infographics PDF
This slide presents smart strategies for collaborating with different teams helpful in building comprehensive approach for team alliance and making project successful. It includes involving research and go-to-market member, strong management oversight, design thinking approach and weekly blueprint sessions. Introducing Smart Strategies For Coordinate With Various Teams Infographics PDF. to increase your presentation threshold. Encompassed with four stages, this template is a great option to educate and entice your audience. Dispence information on Strong Management Oversight, Design Thinking Approach, Weekly Blueprint Sessions, using this template. Grab it now to reap its full benefits.
Use Cases Of Problem Analysis Procedure Infographics PDF
This slide highlights solutions to root cause analysis use cases aimed at understanding and overcome barriers using potential remedies. The basis of challenges are problem definition, systematic approach, investigations, decision making, detail use and skills. Showcasing this set of slides titled Use Cases Of Problem Analysis Procedure Infographics PDF. The topics addressed in these templates are Systematic Approach, Skill Availability, Unimportant Data. All the content presented in this PPT design is completely editable. Download it and make adjustments in color, background, font etc. as per your unique business setting.
SAP Intelligent Robotic Process Automation Framework Infographics PDF
This slide illustrates a high-level overview of smart CDS core data services view assistant to automate the complex process and reduce organizational time and cost. It includes elements such as SAP conversational artificial intelligence, S or 4HANA etc. Presenting SAP Intelligent Robotic Process Automation Framework Infographics PDF to dispense important information. This template comprises two stages. It also presents valuable insights into the topics including Data Sources, Locate Custom, Sap Conversational Artificial Intelligence. This is a completely customizable PowerPoint theme that can be put to use immediately. So, download it and address the topic impactfully.

Strategic Talent Procurement Analytics With Cognition Insights Infographics PDF
This slide exhibits various analytics solutions that exist in candidate sourcing and screening which can potentially increase new-hire quality and reduce the impact of selection biases. It includes cognitive insights, cognitive automation, and cognitive engagement. Presenting Strategic Talent Procurement Analytics With Cognition Insights Infographics PDF to dispense important information. This template comprises six stages. It also presents valuable insights into the topics including Data Mining, Artificial Intelligence, Pattern Recognition, Smart Chatbots. This is a completely customizable PowerPoint theme that can be put to use immediately. So, download it and address the topic impactfully.
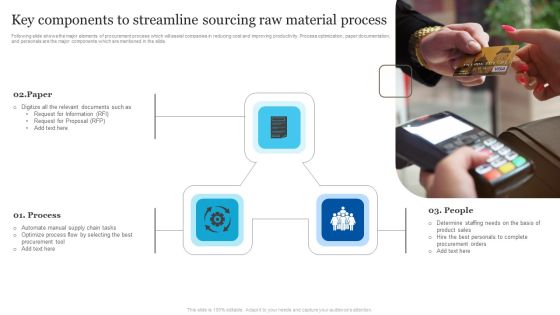
Key Components To Streamline Sourcing Raw Material Process Infographics PDF
Following slide shows the major elements of procurement process which will assist companies in reducing cost and improving productivity. Process optimization, paper documentation, and personals are the major components which are mentioned in the slide. Persuade your audience using this Key Components To Streamline Sourcing Raw Material Process Infographics PDF. This PPT design covers three stages, thus making it a great tool to use. It also caters to a variety of topics including Paper, Process, People. Download this PPT design now to present a convincing pitch that not only emphasizes the topic but also showcases your presentation skills.

Real Time Market Analytics Benefits And Impact Infographics PDF
The slide showcases marketing benefits and impacts of real-time data analytics. It covers improves website performance, removes underperforming elements, keeps track of current trends, optimizes conversions. Presenting Real Time Market Analytics Benefits And Impact Infographics PDF to dispense important information. This template comprises four stages. It also presents valuable insights into the topics including Improves Website Performance, Removes Underperforming Elements, Optimizes Conversions. This is a completely customizable PowerPoint theme that can be put to use immediately. So, download it and address the topic impactfully.
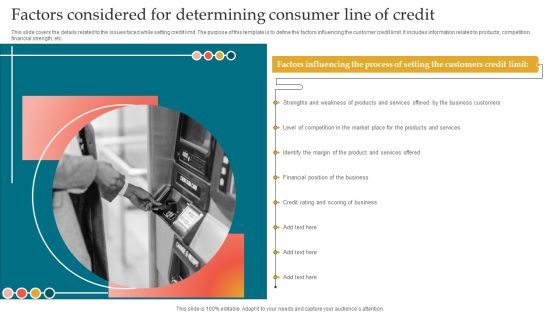
Factors Considered For Determining Consumer Line Of Credit Infographics PDF
This slide covers the details related to the issues faced while setting credit limit. The purpose of this template is to define the factors influencing the customer credit limit. It includes information related to products, competition, financial strength, etc. Presenting Factors Considered For Determining Consumer Line Of Credit Infographics PDF to dispense important information. This template comprises one stages. It also presents valuable insights into the topics including Business Customers, Products And Services, Financial Position. This is a completely customizable PowerPoint theme that can be put to use immediately. So, download it and address the topic impactfully.

Six Months High Level Project Design Concept Strategy Infographics PDF
The slide represents a biannual project roadmap with a design framework. It highlights all the phases beginning with the clients request to execute a project. It helps the firm track down project goals, timelines, and outcomes for the specific project. It includes critical phases, activities, and time in which the task has to be completed. Persuade your audience using this Six Months High Level Project Design Concept Strategy Infographics PDF. This PPT design covers Six stages, thus making it a great tool to use. It also caters to a variety of topics including Concept Strategy, Sales Presentation, Review Proposals. Download this PPT design now to present a convincing pitch that not only emphasizes the topic but also showcases your presentation skills.
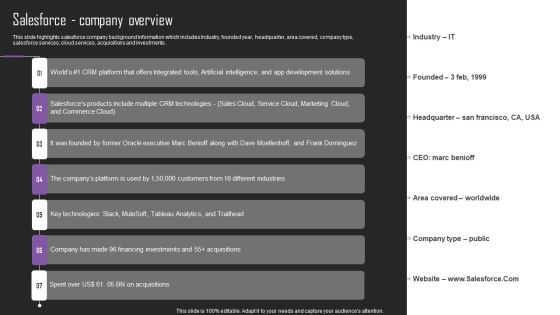
Web Hosting Software Company Outline Salesforce Company Overview Infographics PDF
This slide highlights salesforce company background information which includes Industry, founded year, headquarter, area covered, company type, salesforce services, cloud services, acquisitions and investments. Coming up with a presentation necessitates that the majority of the effort goes into the content and the message you intend to convey. The visuals of a PowerPoint presentation can only be effective if it supplements and supports the story that is being told. Keeping this in mind our experts created Web Hosting Software Company Outline Salesforce Company Overview Infographics PDF to reduce the time that goes into designing the presentation. This way, you can concentrate on the message while our designers take care of providing you with the right template for the situation.

Marketing Success Metrics Implementing Marketing Analytics On Various Infographics PDF
This slide covers various types of marketing channel analytics, such as landing page or website, SEO, email, paid search, social media, and blog analytics. Slidegeeks has constructed Marketing Success Metrics Implementing Marketing Analytics On Various Infographics PDF after conducting extensive research and examination. These presentation templates are constantly being generated and modified based on user preferences and critiques from editors. Here, you will find the most attractive templates for a range of purposes while taking into account ratings and remarks from users regarding the content. This is an excellent jumping-off point to explore our content and will give new users an insight into our top-notch PowerPoint Templates.

About Us For Infrastructure Maintenance And Service Proposal Infographics PDF
The following slide highlights the brief details of company work, objectives, and previous service records. It further shows expert services which include electrical system and equipment, HVAC maintenance, and safety audit. Elevate your presentations with our intuitive About Us For Infrastructure Maintenance And Service Proposal Infographics PDF template. Whether youre delivering a pitch, sharing data, or presenting ideas, our visually-stunning single-slide PPT template is the perfect tool to captivate your audience. With 100 percent editable features and a user-friendly interface, creating professional presentations has never been easier. Download now and leave a lasting impression.
Employee Training Status Report With Activities Infographics PDF
This slide presents the training progress report that records the time involved in completing specific training activities that enables the manager to analyze reasons for the delay. It includes elements such as training activities, employee name, responsible, status, etc. Pitch your topic with ease and precision using this Employee Training Status Report With Activities Infographics PDF. This layout presents information on Team Building Exercise, Customer Experience Optimization, Product Management. It is also available for immediate download and adjustment. So, changes can be made in the color, design, graphics or any other component to create a unique layout.
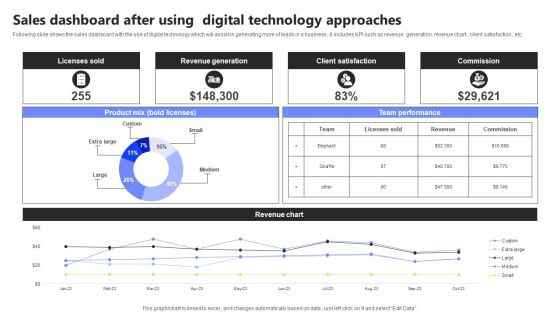
Sales Dashboard After Using Digital Technology Approaches Infographics PDF
Following slide shows the sales dashboard with the use of digital technology which will assist in generating more of leads in a business . It includes KPI such as revenue generation, revenue chart , client satisfaction , etc. Showcasing this set of slides titled Sales Dashboard After Using Digital Technology Approaches Infographics PDF. The topics addressed in these templates are Licenses Sold, Revenue Generation, Client Satisfaction. All the content presented in this PPT design is completely editable. Download it and make adjustments in color, background, font etc. as per your unique business setting.
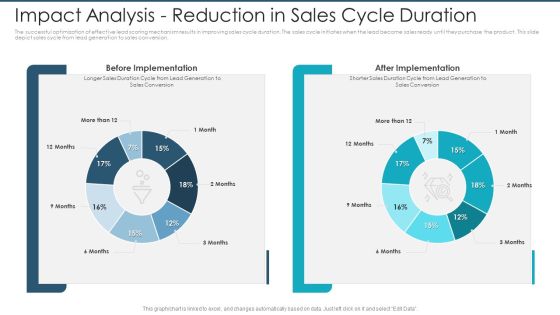
Impact Analysis Reduction In Sales Cycle Duration Infographics PDF
The successful optimization of effective lead scoring mechanism results in improving sales cycle duration. The sales cycle initiates when the lead become sales ready until they purchase the product. This slide depict sales cycle from lead generation to sales conversion.Deliver an awe-inspiring pitch with this creative impact analysis reduction in sales cycle duration infographics pdf. bundle. Topics like before implementation, after implementation can be discussed with this completely editable template. It is available for immediate download depending on the needs and requirements of the user.

Growing Risk Of Unemployment And Job Loss Infographics PDF
This slide provides risk of unemployment and job loss during coronavirus. Under this, it covers the unemployment rate from Jan 2019 to May 2020 in China, Australia, Germany, USA, South Korea along with the key facts related to job cut in fitness sector.Deliver and pitch your topic in the best possible manner with this growing risk of unemployment and job loss infographics pdf. Use them to share invaluable insights on employees, key facts related to job cut in fitness and other related sectors and impress your audience. This template can be altered and modified as per your expectations. So, grab it now.

Other Kpis Key Performance Indicators After Strategy Implementation Infographics PDF
The slide shows the forecast of the companys key KPIs key performance indicators from 2020 to 2024. Major KPIS include RPAS Revenue per available seat, total passengers, number of flights, number of fatality etc. Deliver and pitch your topic in the best possible manner with this other kpis key performance indicators after strategy implementation infographics pdf. Use them to share invaluable insights on other kpis key performance indicators after strategy implementation and impress your audience. This template can be altered and modified as per your expectations. So, grab it now.
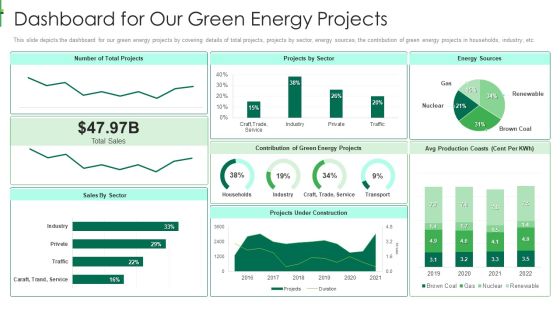
Sustainable Energy Dashboard For Our Green Energy Projects Infographics PDF
This slide depicts the dashboard for our green energy projects by covering details of total projects, projects by sector, energy sources, the contribution of green energy projects in households, industry, etc.Deliver and pitch your topic in the best possible manner with this sustainable energy dashboard for our green energy projects infographics pdf Use them to share invaluable insights on dashboard for our green energy projects and impress your audience. This template can be altered and modified as per your expectations. So, grab it now.

Graph Indicating Clinical Trial Phases Probability Of Success Infographics PDF
This slide compares and visually presents the success rate of each stage with preceding one of the clinical research procedures to represent the achievement of the drug efficacy objective of the firm.Deliver and pitch your topic in the best possible manner with this Graph Indicating Clinical Trial Phases Probability Of Success Infographics PDF Use them to share invaluable insights on Graph Indicating Clinical Trial Phases Probability Of Success and impress your audience. This template can be altered and modified as per your expectations. So, grab it now.

Organization IT Service Desk Administration Performance Dashboard Infographics PDF
This slide represents the dashboard showing the performance of the service desk management team of the organization. It shows details related to benchmark achieved, customer satisfaction, contracts by type and manufacturer, incidents by category, computer by status, service level management etc. Showcasing this set of slides titled Organization IT Service Desk Administration Performance Dashboard Infographics PDF. The topics addressed in these templates are Service, Management, Manufacturer. All the content presented in this PPT design is completely editable. Download it and make adjustments in color, background, font etc. as per your unique business setting.
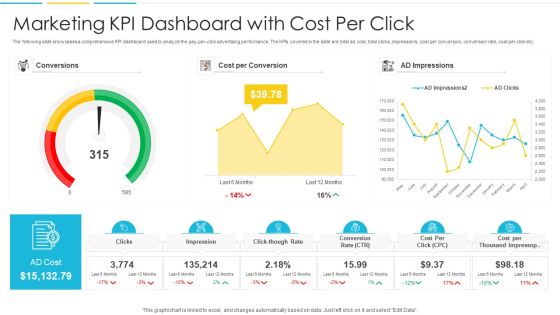
Marketing KPI Dashboard With Cost Per Click Infographics PDF
The following slide showcases a comprehensive KPI dashboard used to analyze the pay-per-click advertising performance. The KPIs covered in the slide are total ad cost, total clicks, impressions, cost per conversion, conversion rate, cost per click etc. Pitch your topic with ease and precision using this Marketing KPI Dashboard With Cost Per Click Infographics PDF. This layout presents information on Conversions, Cost, Impressions. It is also available for immediate download and adjustment. So, changes can be made in the color, design, graphics or any other component to create a unique layout.
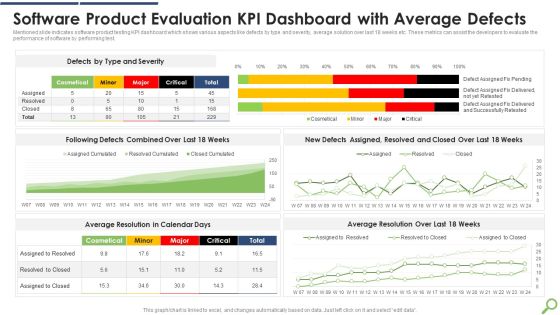
Software Product Evaluation KPI Dashboard With Average Defects Infographics PDF
Mentioned slide indicates software product testing KPI dashboard which shows various aspects like defects by type and severity, average solution over last 18 weeks etc. These metrics can assist the developers to evaluate the performance of software by performing test.Showcasing this set of slides titled Software Product Evaluation KPI Dashboard With Average Defects Infographics PDF The topics addressed in these templates are Software Product, Evaluation Dashboard, Average Defects All the content presented in this PPT design is completely editable. Download it and make adjustments in color, background, font etc. as per your unique business setting.

Client Portfolio Analysis At Different Bank Branches Infographics PDF
This slide shows the customer portfolio analysis at different branch offices of bank which covers gender, age, liquid assets, country of origin and occupation such as business, retired or not working, etc. that helps in preparing customer portfolio on demographic basis.Showcasing this set of slides titled Client Portfolio Analysis At Different Bank Branches Infographics PDF The topics addressed in these templates are Client Portfolio, Analysis Different, Bank Branches All the content presented in this PPT design is completely editable. Download it and make adjustments in color, background, font etc. as per your unique business setting.
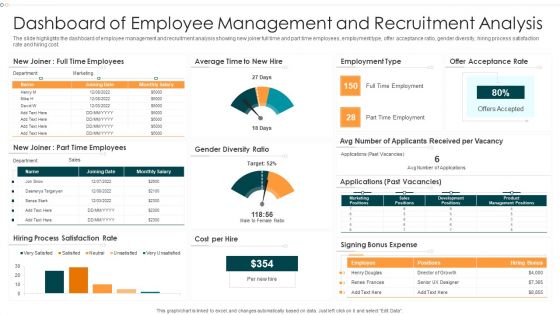
Dashboard Of Employee Management And Recruitment Analysis Infographics PDF
The slide highlights the dashboard of employee management and recruitment analysis showing new joiner full time and part time employees, employment type, offer acceptance ratio, gender diversity, hiring process satisfaction rate and hiring cost.Pitch your topic with ease and precision using this Dashboard Of Employee Management And Recruitment Analysis Infographics PDF This layout presents information on Dashboard Employee, Management, Recruitment Analysis It is also available for immediate download and adjustment. So, changes can be made in the color, design, graphics or any other component to create a unique layout.

Financial Performance Introduction Of Supply Chain Management Organization Infographics PDF
This slide showcases introduction to statistics that can help supply chain management organization to evaluate the financial performance. Its key components are revenue, net income and revenue sources.Pitch your topic with ease and precision using this Financial Performance Introduction Of Supply Chain Management Organization Infographics PDF This layout presents information on Revenue Sources, Revenue Increased, Income Increased It is also available for immediate download and adjustment. So, changes can be made in the color, design, graphics or any other component to create a unique layout.
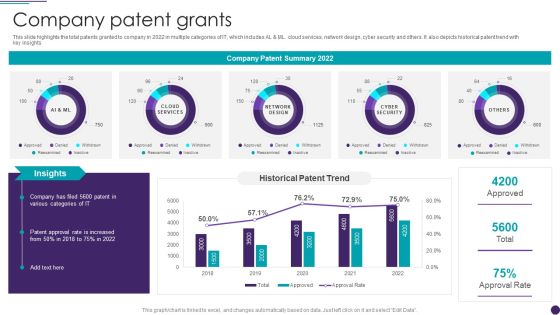
IT Services Business Profile Company Patent Grants Infographics PDF
This slide highlights the total patents granted to company in 2022 in multiple categories of IT, which includes AL and ML. cloud services, network design, cyber security and others. It also depicts historical patent trend with key insights. Deliver an awe inspiring pitch with this creative IT Services Business Profile Company Patent Grants Infographics PDF bundle. Topics like Network Design, Cyber Security, Cloud Services can be discussed with this completely editable template. It is available for immediate download depending on the needs and requirements of the user.
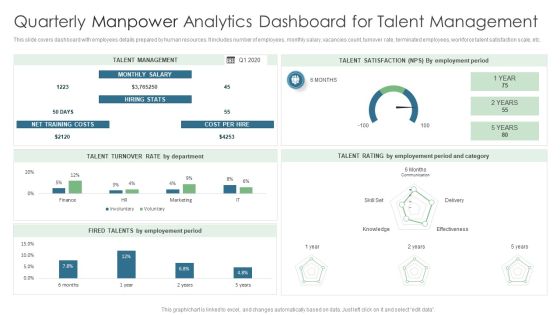
Quarterly Manpower Analytics Dashboard For Talent Management Infographics PDF
This slide covers dashboard with employees details prepared by human resources. It includes number of employees, monthly salary, vacancies count, turnover rate, terminated employees, workforce talent satisfaction scale, etc. Showcasing this set of slides titled Quarterly Manpower Analytics Dashboard For Talent Management Infographics PDF. The topics addressed in these templates are Talent Management, Cost Per Hire, Net Training Costs. All the content presented in this PPT design is completely editable. Download it and make adjustments in color, background, font etc. as per your unique business setting.
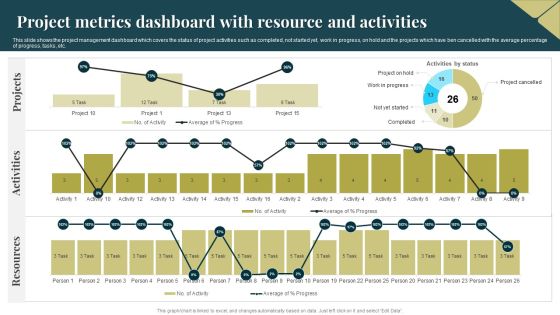
Project Metrics Dashboard With Resource And Activities Infographics PDF
This slide shows the project management dashboard which covers the status of project activities such as completed, not started yet, work in progress, on hold and the projects which have ben cancelled with the average percentage of progress, tasks, etc. Showcasing this set of slides titled Project Metrics Dashboard With Resource And Activities Infographics PDF. The topics addressed in these templates are Activities, Projects, Resources. All the content presented in this PPT design is completely editable. Download it and make adjustments in color, background, font etc. as per your unique business setting.

Customer Service Metrics Dashboard For Email And Chat Infographics PDF
This slide showcases dashboard for customer service metrics that can help to identify the customer satisfaction score plus implement strategies in case of decline. Its key KPIs are first response time, requester wait time, first response time and time to close. Pitch your topic with ease and precision using this Customer Service Metrics Dashboard For Email And Chat Infographics PDF. This layout presents information on Customer Service, Metrics Dashboard, Email And Chat. It is also available for immediate download and adjustment. So, changes can be made in the color, design, graphics or any other component to create a unique layout.

Internal Organizational Communication Kpis And Dashboard With Channels Infographics PDF
This slide showcases dashboard that can help organization to assess the performance of internal communication and analyzing the user participation. Its key components are message success, channels and user engagement. Pitch your topic with ease and precision using this Internal Organizational Communication Kpis And Dashboard With Channels Infographics PDF. This layout presents information on User Participation, User Engagement, Message Success. It is also available for immediate download and adjustment. So, changes can be made in the color, design, graphics or any other component to create a unique layout.

Account Based Marketing Customer Engagement Dashboard Infographics PDF
Purpose of the following slide is to show key metrics that can help the organization to track their account based marketing efforts, it highlights essential KPIs such as CTR, session by account. Boost your pitch with our creative Account Based Marketing Customer Engagement Dashboard Infographics PDF. Deliver an awe inspiring pitch that will mesmerize everyone. Using these presentation templates you will surely catch everyones attention. You can browse the ppts collection on our website. We have researchers who are experts at creating the right content for the templates. So you do not have to invest time in any additional work. Just grab the template now and use them.
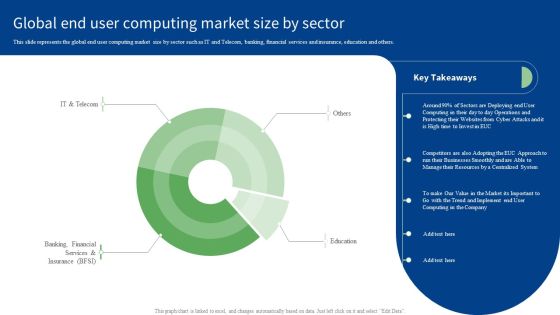
Global End User Computing Market Size By Sector Infographics PDF
This slide represents the global end user computing market size by sector such as IT and Telecom, banking, financial services and insurance, education and others. Boost your pitch with our creative Global End User Computing Market Size By Sector Infographics PDF. Deliver an awe-inspiring pitch that will mesmerize everyone. Using these presentation templates you will surely catch everyones attention. You can browse the ppts collection on our website. We have researchers who are experts at creating the right content for the templates. So you do not have to invest time in any additional work. Just grab the template now and use them.

Marketing Channels Return On Investment ROI Comparison Infographics PDF
This slide covers the return of investment from various promotional channels such as social media, banner ads, SEO, paid marketing, affiliate marketing, and email marketing. The best PPT templates are a great way to save time, energy, and resources. Slidegeeks have 100 percent editable powerpoint slides making them incredibly versatile. With these quality presentation templates, you can create a captivating and memorable presentation by combining visually appealing slides and effectively communicating your message. Download Marketing Channels Return On Investment ROI Comparison Infographics PDF from Slidegeeks and deliver a wonderful presentation.

Segmentation Of Target Audience Retail Merchandising Techniques Infographics PDF
Are you in need of a template that can accommodate all of your creative concepts This one is crafted professionally and can be altered to fit any style. Use it with Google Slides or PowerPoint. Include striking photographs, symbols, depictions, and other visuals. Fill, move around, or remove text boxes as desired. Test out color palettes and font mixtures. Edit and save your work, or work with colleagues. Download Segmentation Of Target Audience Retail Merchandising Techniques Infographics PDF and observe how to make your presentation outstanding. Give an impeccable presentation to your group and make your presentation unforgettable.

Information Technology Operations Operations Dashboard For Issues Management Infographics PDF
The slide illustrates various KPIs to manage and track IT operations in business. Various elements included in the dashboard are month-wise issue status, types of issues, average resolution time, overall status and resolved issues. Showcasing this set of slides titled Information Technology Operations Operations Dashboard For Issues Management Infographics PDF. The topics addressed in these templates are Information Technology Operations, Operations Dashboard, Issues Management. All the content presented in this PPT design is completely editable. Download it and make adjustments in color, background, font etc. as per your unique business setting.

Dashboard Showing Monitoring Campaign Of Marketing Ppt Infographics PDF
This slide represents dashboard showcasing campaign report. It includes recipients, email clients, open rate, spam complaints etc that enable organization in analyzing progress of marketing campaign to develop more effective strategies. Showcasing this set of slides titled Dashboard Showing Monitoring Campaign Of Marketing Ppt Infographics PDF. The topics addressed in these templates are Recipients, Open Rate, Spam Complaints, Shares. All the content presented in this PPT design is completely editable. Download it and make adjustments in color, background, font etc. as per your unique business setting.
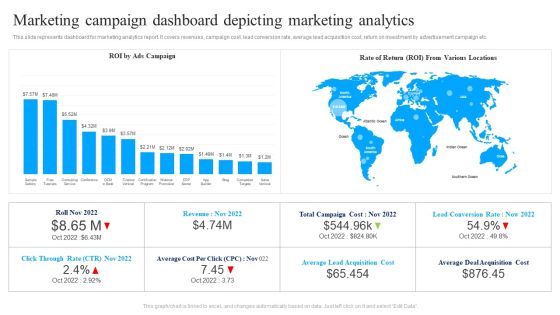
Marketing Campaign Dashboard Depicting Marketing Analytics Ppt Summary Infographics PDF
This slide represents dashboard for marketing analytics report. It covers revenues, campaign cost, lead conversion rate, average lead acquisition cost, return on investment by advertisement campaign etc. Pitch your topic with ease and precision using this Marketing Campaign Dashboard Depicting Marketing Analytics Ppt Summary Infographics PDF. This layout presents information on ROI Ads Campaign, Rate Of Return, Various Locations. It is also available for immediate download and adjustment. So, changes can be made in the color, design, graphics or any other component to create a unique layout.

Dashboard For Skill Assessment During Leadership Recruitment Infographics PDF
The slide shows industry wise top skills that are assessed during leadership hiring. It includes skill assessment in hiring by different industries, average time taken in hiring, skill assessment tools in leadership hiring. Showcasing this set of slides titled Dashboard For Skill Assessment During Leadership Recruitment Infographics PDF. The topics addressed in these templates are Skill Assessment Tools, Skill Analysis. All the content presented in this PPT design is completely editable. Download it and make adjustments in color, background, font etc. as per your unique business setting.

Top Skills Assessed During Leadership Recruitment Infographics PDF
The slide showcases various skill that organizations assess during leadership recruiting. It includes cognitive skills, personality skills, domain skills, key insights, applications received, applications accepted , total hired leaders and cost of hiring. Showcasing this set of slides titled Top Skills Assessed During Leadership Recruitment Infographics PDF. The topics addressed in these templates are Cognitive Skills, Personality Skills, Domain Skills. All the content presented in this PPT design is completely editable. Download it and make adjustments in color, background, font etc. as per your unique business setting.
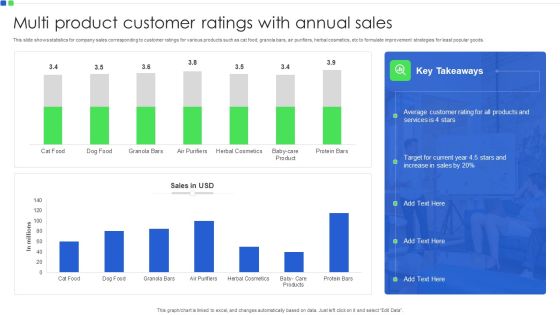
Multi Product Customer Ratings With Annual Sales Infographics PDF
This slide shows statistics for company sales corresponding to customer ratings for various products such as cat food, granola bars, air purifiers, herbal cosmetics, etc to formulate improvement strategies for least popular goods. Showcasing this set of slides titled Multi Product Customer Ratings With Annual Sales Infographics PDF. The topics addressed in these templates are Target For Current Year, Average Customer Rating. All the content presented in this PPT design is completely editable. Download it and make adjustments in color, background, font etc. as per your unique business setting.

IT Project Change Management Operations Analysis Dashboard Infographics PDF
This slide shows the dashboard representing the operational analysis related to change management of an IT project. It shows details related to top requesting groups, outstanding change requests, outstanding age breakdown etc.Pitch your topic with ease and precision using this IT Project Change Management Operations Analysis Dashboard Infographics PDF. This layout presents information on Outstanding Requests, Outstanding Breakdown, Outstanding Changes. It is also available for immediate download and adjustment. So, changes can be made in the color, design, graphics or any other component to create a unique layout.

Virtual Assistant Global Market Share By Applications Infographics PDF
This slide depicts share of virtual assistants in global market based on usage in several industries. It includes industries such as BFSI, consumer electronics, automative, healthcare, education, retail, IT, travel and hospitality. Showcasing this set of slides titled Virtual Assistant Global Market Share By Applications Infographics PDF. The topics addressed in these templates are Consumer Electronics, Automotive, Demand Advanced. All the content presented in this PPT design is completely editable. Download it and make adjustments in color, background, font etc. as per your unique business setting.
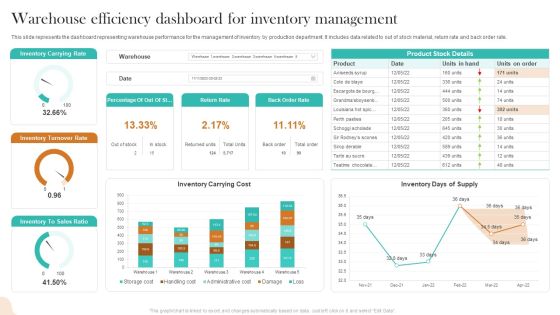
Warehouse Efficiency Dashboard For Inventory Management Infographics PDF
This slide represents the dashboard representing warehouse performance for the management of inventory by production department. It includes data related to out of stock material, return rate and back order rate. Showcasing this set of slides titled Warehouse Efficiency Dashboard For Inventory Management Infographics PDF. The topics addressed in these templates are Inventory Carrying Rate, Inventory Turnover Rate, Inventory Carrying Cost. All the content presented in this PPT design is completely editable. Download it and make adjustments in color, background, font etc. as per your unique business setting.

Stakeholders Management Strategy With Engagement Dashboard Infographics PDF
The following slide displays key parameters to map involvement of stakeholders in the business by analyzing them on the basis of influence, interest and impact to monitor and improve overall communication strategies of organization. Pitch your topic with ease and precision using this Stakeholders Management Strategy With Engagement Dashboard Infographics PDF. This layout presents information on Influence, Interest, Impact. It is also available for immediate download and adjustment. So, changes can be made in the color, design, graphics or any other component to create a unique layout.

Revenue Generated From Operations Administration In It Services Infographics PDF
This slide illustrates the graphical representation of revenue generated from operation management in IT services in the recent years. It shows the revenue in millions of US dollars from 2015 to 2022 and expected revenue generation in upcoming years. Pitch your topic with ease and precision using this Revenue Generated From Operations Administration In It Services Infographics PDF. This layout presents information on Revenue, Management, Cloud Computing. It is also available for immediate download and adjustment. So, changes can be made in the color, design, graphics or any other component to create a unique layout.
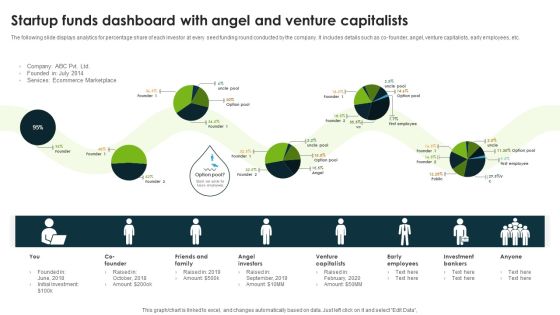
Startup Funds Dashboard With Angel And Venture Capitalists Infographics PDF
The following slide displays analytics for percentage share of each investor at every seed funding round conducted by the company. It includes details such as co founder, angel, venture capitalists, early employees, etc. Showcasing this set of slides titled Startup Funds Dashboard With Angel And Venture Capitalists Infographics PDF. The topics addressed in these templates are Angel Investors, Venture Capitalists, Early Employees. All the content presented in this PPT design is completely editable. Download it and make adjustments in color, background, font etc. as per your unique business setting.
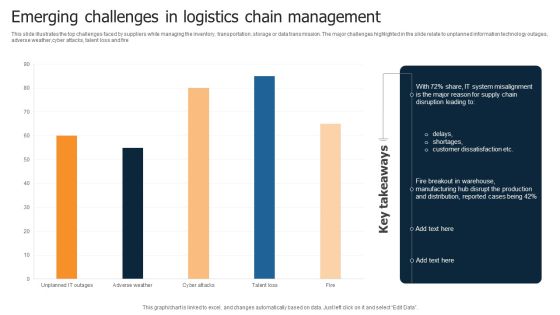
Emerging Challenges In Logistics Chain Management Infographics PDF
This slide illustrates the top challenges faced by suppliers while managing the inventory, transportation, storage or data transmission. The major challenges highlighted in the slide relate to unplanned information technology outages, adverse weather,cyber attacks, talent loss and fire Showcasing this set of slides titled Emerging Challenges In Logistics Chain Management Infographics PDF. The topics addressed in these templates are System Misalignment, Disruption Leading, Customer Dissatisfaction. All the content presented in this PPT design is completely editable. Download it and make adjustments in color, background, font etc. as per your unique business setting.
Website Leads Tracking Dashboard With Traffic Sources Infographics PDF
This slide showcases dashboard for lead generation that can help organziation to identify the traffic sources plus visitors and make changes in SEO of website. It also showcases key metrics that are bounce rate by week, visitors by user type, top channels by conversion, top campaign by conversion and top pages by conversion. Pitch your topic with ease and precision using this Website Leads Tracking Dashboard With Traffic Sources Infographics PDF. This layout presents information on Visitors User Type, Traffic Sources, Bounce Rate Week. It is also available for immediate download and adjustment. So, changes can be made in the color, design, graphics or any other component to create a unique layout.

International Fintech Industry With Market Size Infographics PDF
This slide showcases global report that can help organizations to estimate future growth and identify the market share of different fintech segments. It also showcases fintech startups by region, market and investment in different countries. Showcasing this set of slides titled International Fintech Industry With Market Size Infographics PDF. The topics addressed in these templates are Fintech Segments, Region, Fintech Investment. All the content presented in this PPT design is completely editable. Download it and make adjustments in color, background, font etc. as per your unique business setting.

Dashboard To Track Autonomous Mobile Robot Performance Infographics PDF
This slide represents the dashboard to track the AMRs performance in the warehouse. It covers various AMRs status reports, energy consumption, battery level, total working hours, and time to return. Take your projects to the next level with our ultimate collection of Dashboard To Track Autonomous Mobile Robot Performance Infographics PDF. Slidegeeks has designed a range of layouts that are perfect for representing task or activity duration, keeping track of all your deadlines at a glance. Tailor these designs to your exact needs and give them a truly corporate look with your own brand colors they will make your projects stand out from the rest.

Current Challenges Faced By Retail Stores Infographics PDF
This slide represents major challenges faced by retail store. It highlights decline in conversion for shoppers into buyers and decrease in customer visits. Boost your pitch with our creative Current Challenges Faced By Retail Stores Infographics PDF. Deliver an awe inspiring pitch that will mesmerize everyone. Using these presentation templates you will surely catch everyones attention. You can browse the ppts collection on our website. We have researchers who are experts at creating the right content for the templates. So you do not have to invest time in any additional work. Just grab the template now and use them.

Budget Breakdown And Cost Incurred In Procurement Strategy Infographics PDF
This slide provides an overview of the budget created by managers for procurement strategies and the actual cost spent. The maximum cost was spent on corporate social responsibility activities to improve brand value and customer loyalty. From laying roadmaps to briefing everything in detail, our templates are perfect for you. You can set the stage with your presentation slides. All you have to do is download these easy to edit and customizable templates. Budget Breakdown And Cost Incurred In Procurement Strategy Infographics PDF will help you deliver an outstanding performance that everyone would remember and praise you for. Do download this presentation today.

Customer Service Measurement KPI Dashboard Ppt Infographics Themes PDF
Mentioned slide portrays customer service measurement KPI dashboard that includes metrics namely request volume vs. service level, customer satisfaction, customer retention, costs per support and average time to solve issue. If your project calls for a presentation, then Slidegeeks is your go-to partner because we have professionally designed, easy-to-edit templates that are perfect for any presentation. After downloading, you can easily edit Customer Service Measurement KPI Dashboard Ppt Infographics Themes PDF and make the changes accordingly. You can rearrange slides or fill them with different images. Check out all the handy templates

Consumer Partition Dashboard For Email Campaigns Infographics PDF
The following slide depicts a dashboard which can be used by marketers for sending targeted mails to customers and enhance customer retention. The key performing indicators are number of customers, average value or orders, number of orders, top ten percent customers etc. Showcasing this set of slides titled Consumer Partition Dashboard For Email Campaigns Infographics PDF. The topics addressed in these templates are Average Life Time Value, Average Value Of Orders, Returns, Average Number Of Orders. All the content presented in this PPT design is completely editable. Download it and make adjustments in color, background, font etc. as per your unique business setting.
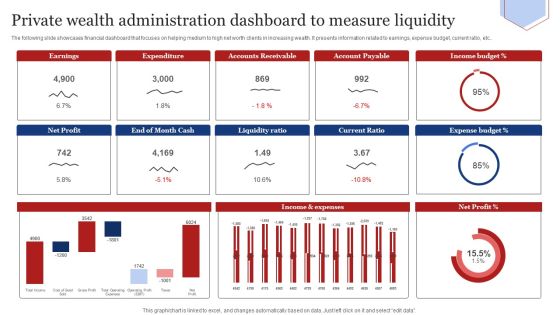
Private Wealth Administration Dashboard To Measure Liquidity Infographics PDF
The following slide showcases financial dashboard that focuses on helping medium to high net worth clients in increasing wealth. It presents information related to earnings, expense budget, current ratio, etc. Showcasing this set of slides titled Private Wealth Administration Dashboard To Measure Liquidity Infographics PDF. The topics addressed in these templates are Liquidity Ratio, Current Ratio, Expense Budget. All the content presented in this PPT design is completely editable. Download it and make adjustments in color, background, font etc. as per your unique business setting.

Global Iot Agriculture Market By Component Ppt Infographics Slides PDF
This slide focuses on global internet of things in agriculture market by component which includes hardware, software and connectivity and services. If your project calls for a presentation, then Slidegeeks is your go-to partner because we have professionally designed, easy-to-edit templates that are perfect for any presentation. After downloading, you can easily edit Global Iot Agriculture Market By Component Ppt Infographics Slides PDF and make the changes accordingly. You can rearrange slides or fill them with different images. Check out all the handy templates

Periodic Revenue Model Recurring Revenue Dashboard Infographics PDF
The following slide display recurring revenue generated over the year, the following dashboard displays MRR, churn rate net recurring revenue and growth rate. Slidegeeks is one of the best resources for PowerPoint templates. You can download easily and regulate Periodic Revenue Model Recurring Revenue Dashboard Infographics PDF for your personal presentations from our wonderful collection. A few clicks is all it takes to discover and get the most relevant and appropriate templates. Use our Templates to add a unique zing and appeal to your presentation and meetings. All the slides are easy to edit and you can use them even for advertisement purposes.

Factors Encouraging E Commerce Transactions By Customers Infographics PDF
This slide analysis major factors that influence online purchase decision of customer foe ecommerce company. It includes details such as ability to compare prices, time savings, free shipping offers, etc. Showcasing this set of slides titled Factors Encouraging E Commerce Transactions By Customers Infographics PDF. The topics addressed in these templates are Key Insights, Convenience, Push Form Offline. All the content presented in this PPT design is completely editable. Download it and make adjustments in color, background, font etc. as per your unique business setting.

Monthly Financial Metrics Dashboard With Income Statement Infographics PDF
This following slide displays kpis to communicate key financial information to both internal and external stakeholders. It further includes details such as OPEX ratio, revenue and COGS, income, expenses, etc. Showcasing this set of slides titled Monthly Financial Metrics Dashboard With Income Statement Infographics PDF. The topics addressed in these templates are Gross Profit Margin, Taxes, Revenue. All the content presented in this PPT design is completely editable. Download it and make adjustments in color, background, font etc. as per your unique business setting.
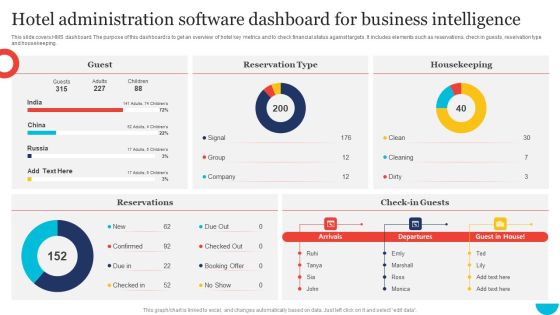
Hotel Administration Software Dashboard For Business Intelligence Infographics PDF
This slide covers HMS dashboard. The purpose of this dashboard is to get an overview of hotel key metrics and to check financial status against targets. It includes elements such as reservations, check in guests, reservation type and housekeeping. Pitch your topic with ease and precision using this Hotel Administration Software Dashboard For Business Intelligence Infographics PDF. This layout presents information on Guest, Housekeeping, Reservation Type. It is also available for immediate download and adjustment. So, changes can be made in the color, design, graphics or any other component to create a unique layout.

Consumer Packed Good Companies Investment In Buyer Marketing Infographics PDF
Following slide brings forth the investment criteria adopted by consumer packed goods and their trends for two years. Key investment areas include retailer specific discounts, sampling, instore advertising, merchandizing, in store events and others Showcasing this set of slides titled Consumer Packed Good Companies Investment In Buyer Marketing Infographics PDF. The topics addressed in these templates are Key Takeaways, Buyer Marketing, Purchase Rate. All the content presented in this PPT design is completely editable. Download it and make adjustments in color, background, font etc. as per your unique business setting.

Dashboard To Track Performance Of Buyer Marketing Campaign Infographics PDF
This slide depicts a Dashboard which can be used to track performance of shopper marketing campaign on digital platforms. The key performance indicators include Website leads, Current service users, Lead conversion rate, Lead satisfaction rate etc. Pitch your topic with ease and precision using this Dashboard To Track Performance Of Buyer Marketing Campaign Infographics PDF. This layout presents information on Social Media Campaign, Social Media Engagement, Current Service Users. It is also available for immediate download and adjustment. So, changes can be made in the color, design, graphics or any other component to create a unique layout.

Data Automation Solution Investor Funding Presentation Shareholding Pattern Infographics PDF
Mentioned slide provides insights into company shareholding distribution by number of shareholders and percentage of holding by each member. Coming up with a presentation necessitates that the majority of the effort goes into the content and the message you intend to convey. The visuals of a PowerPoint presentation can only be effective if it supplements and supports the story that is being told. Keeping this in mind our experts created Data Automation Solution Investor Funding Presentation Shareholding Pattern Infographics PDF to reduce the time that goes into designing the presentation. This way, you can concentrate on the message while our designers take care of providing you with the right template for the situation.
Different Brands Performance Tracking Dashboard Ppt Gallery Infographics PDF
This slide provides information regarding different brands performance tracking dashboard in terms of brand metric, brand commitment, advertising metrics, and purchase metrics. Take your projects to the next level with our ultimate collection of Different Brands Performance Tracking Dashboard Ppt Gallery Infographics PDF. Slidegeeks has designed a range of layouts that are perfect for representing task or activity duration, keeping track of all your deadlines at a glance. Tailor these designs to your exact needs and give them a truly corporate look with your own brand colors they will make your projects stand out from the rest.
KPI Dashboard For Tracking Customer Retention Infographics PDF
This slide covers the dashboard for analyzing customer loyalty with metrics such as NPS, loyal customer rate, premium users, CLV, customer churn, revenue churn, net retention, MRR growth, etc. Slidegeeks is one of the best resources for PowerPoint templates. You can download easily and regulate KPI Dashboard For Tracking Customer Retention Infographics PDF for your personal presentations from our wonderful collection. A few clicks is all it takes to discover and get the most relevant and appropriate templates. Use our Templates to add a unique zing and appeal to your presentation and meetings. All the slides are easy to edit and you can use them even for advertisement purposes.

Budget For Running Personalized Marketing Campaign Ppt Infographics Images PDF
This showcases budget that can be allocated by organization before running personalized marketing campaigns. Key elements of budget are email marketing, data analysis, social media marketing, mobile application personalization and website optimization. This Budget For Running Personalized Marketing Campaign Ppt Infographics Images PDF is perfect for any presentation, be it in front of clients or colleagues. It is a versatile and stylish solution for organizing your meetings. The product features a modern design for your presentation meetings. The adjustable and customizable slides provide unlimited possibilities for acing up your presentation. Slidegeeks has done all the homework before launching the product for you. So, do not wait, grab the presentation templates today

HDI Comparison On Basis Of Inequality Infographics PDF
Following slides shows comparison of the human development index based on national disparities which will assist in measuring well being through economic data It major countries are Pakistan, India, Nepal, Bangladesh , etc. Showcasing this set of slides titled HDI Comparison On Basis Of Inequality Infographics PDF. The topics addressed in these templates are Country Effect, Most Effected Country, Human Development. All the content presented in this PPT design is completely editable. Download it and make adjustments in color, background, font etc. as per your unique business setting.
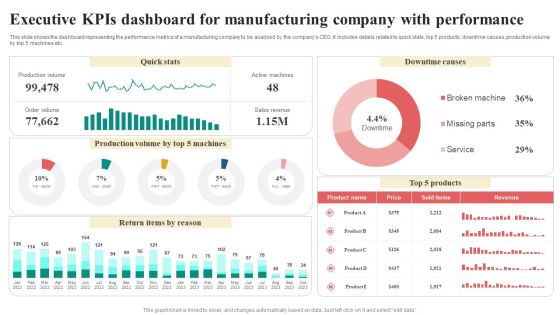
Executive Kpis Dashboard For Manufacturing Company With Performance Infographics PDF
This slide shows the dashboard representing the performance metrics of a manufacturing company to be analyzed by the companys CEO. It includes details related to quick stats, top 5 products, downtime causes, production volume by top 5 machines etc. Showcasing this set of slides titled Executive Kpis Dashboard For Manufacturing Company With Performance Infographics PDF. The topics addressed in these templates are Return Items By Reason, Quick Stats, Downtime Causes, Revenue. All the content presented in this PPT design is completely editable. Download it and make adjustments in color, background, font etc. as per your unique business setting.

Call Center Kpis Dashboard With Data Management Infographics PDF
This slide covers contact center metrics KPI dashboard with call data details. It involves details such as total number of contacts handled, product sales, repeated calls and contact handles per day. Pitch your topic with ease and precision using this Call Center Kpis Dashboard With Data Management Infographics PDF. This layout presents information on Achieved, Contacts Handled, Repeated Calls. It is also available for immediate download and adjustment. So, changes can be made in the color, design, graphics or any other component to create a unique layout.

Retail Business Gross Comparison Analysis Of Profit Infographics PDF
This slide presents retail business comparison based on their respective gross profit margins, helpful in identifying most successful retailers and overall standing in market. It includes beverages, jewellery, cosmetics, fashion and shoes industries. Showcasing this set of slides titled Retail Business Gross Comparison Analysis Of Profit Infographics PDF. The topics addressed in these templates are Beverages Retail, Gross Profit Margin, Retail Segment. All the content presented in this PPT design is completely editable. Download it and make adjustments in color, background, font etc. as per your unique business setting.

Annually E Mail Performance Campaign Statistics Analysis Infographics PDF
This slide showcases the yearly figures for the number of emails sent and received globally. It consists the number of mail sent and received from the past five years and forecasted emails to be sent or received in upcoming years. Showcasing this set of slides titled Annually E Mail Performance Campaign Statistics Analysis Infographics PDF. The topics addressed in these templates are Annually E Mail Performance, Campaign Statistics Analysis. All the content presented in this PPT design is completely editable. Download it and make adjustments in color, background, font etc. as per your unique business setting.
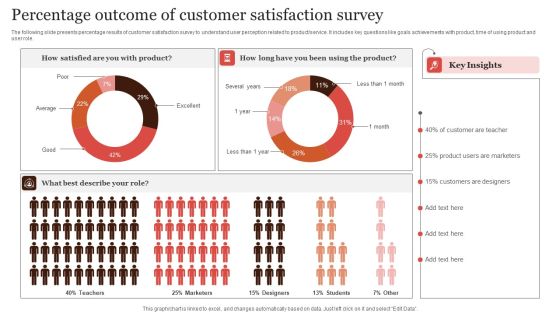
Percentage Outcome Of Customer Satisfaction Survey Infographics PDF
The following slide presents percentage results of customer satisfaction survey to understand user perception related to product or service. It includes key questions like goals achievements with product, time of using product and user role. Pitch your topic with ease and precision using this Percentage Outcome Of Customer Satisfaction Survey Infographics PDF. This layout presents information on Percentage Outcome, Customer Satisfaction Survey. It is also available for immediate download and adjustment. So, changes can be made in the color, design, graphics or any other component to create a unique layout.
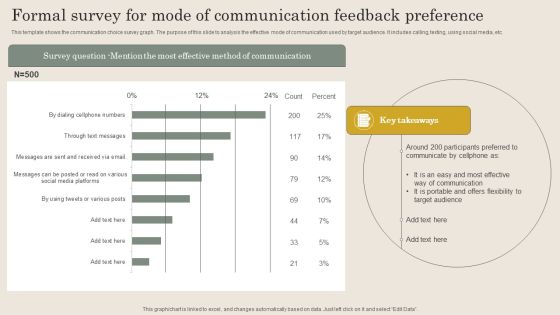
Formal Survey For Mode Of Communication Feedback Preference Infographics PDF
This template shows the communication choice survey graph. The purpose of this slide to analysis the effective mode of communication used by target audience. It includes calling, texting, using social media, etc. Showcasing this set of slides titled Formal Survey For Mode Of Communication Feedback Preference Infographics PDF. The topics addressed in these templates are Effective Way Communication, Offers Flexibility, Target Audience. All the content presented in this PPT design is completely editable. Download it and make adjustments in color, background, font etc. as per your unique business setting.

Intelligent Process Automation Market Share By Different Countries Infographics PDF
This slide showcases cognitive automation market share by different regions to identify future business opportunities. It includes regions such as North America, Europe, Asia Pacific, Middle East and Africa, and South America. Showcasing this set of slides titled Intelligent Process Automation Market Share By Different Countries Infographics PDF. The topics addressed in these templates are Cognitive Automation, Automation Business Processes, Manufacturing Industry Growth. All the content presented in this PPT design is completely editable. Download it and make adjustments in color, background, font etc. as per your unique business setting.

Display Ad Campaigning Dashboard To Monitor Productivity Infographics PDF
This slide showcases KPI dashboard for display advertising for real- time tracking of key marketing metrices, It includes elements such as cost, clicks, impressions, CTR, conversion rate, CPC, etc. Showcasing this set of slides titled Display Ad Campaigning Dashboard To Monitor Productivity Infographics PDF. The topics addressed in these templates are Cost Per Conversion, Conversions, Ad Impressions. All the content presented in this PPT design is completely editable. Download it and make adjustments in color, background, font etc. as per your unique business setting.
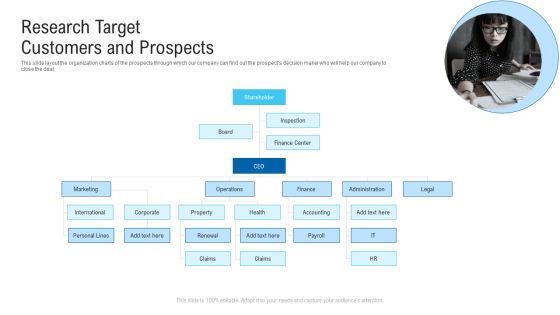
Research Target Customers And Prospects Ppt Infographics Show PDF
This slide layout the organization charts of the prospects through which our company can find out the prospects decision maker who will help our company to close the deal.Presenting research target customers and prospects ppt infographics show pdf. to provide visual cues and insights. Share and navigate important information on seven stages that need your due attention. This template can be used to pitch topics like shareholder, marketing, international, operations. In addtion, this PPT design contains high resolution images, graphics, etc, that are easily editable and available for immediate download.

Healthcare Services Company Profile Organization Structure Infographics PDF
The slide depicts the company hierarchical chart to define the various management positions in organization. It depicts managing director, founder, chief financial officer, chief executive officer, director of operations, director of surgeries, IPR head, R and D head and manufacturing head.This is a Healthcare Services Company Profile Organization Structure Infographics PDF template with various stages. Focus and dispense information on five stages using this creative set, that comes with editable features. It contains large content boxes to add your information on topics like Hospital Business, Research Business, Pharmacy Business You can also showcase facts, figures, and other relevant content using this PPT layout. Grab it now.

Pharmaceutical And Clinical Research Summary Organisation Structure Infographics PDF
The slide depicts the company hierarchical chart to define the various management positions in organization. It depicts managing director, founder, chief financial officer, chief executive officer, director of operations, director of surgeries, IPR head, R and D head and manufacturing head. This is a Pharmaceutical And Clinical Research Summary Organisation Structure Infographics PDF template with various stages. Focus and dispense information on four stages using this creative set, that comes with editable features. It contains large content boxes to add your information on topics like Sales And Marketing Manager, Manufacturing Head Chief, Financial Officer. You can also showcase facts, figures, and other relevant content using this PPT layout. Grab it now.

Facility Asset Hierarchy Structure Ppt PowerPoint Presentation Icon Infographics PDF
This slide covers asset hierarchy chart of a facility management. It includes division of facility 1 under asset A and B along with subdivisions such as subassembly 1, 2,3 with further divisions into several parts. Persuade your audience using this Facility Asset Hierarchy Structure Ppt PowerPoint Presentation Icon Infographics PDF. This PPT design covers three stages, thus making it a great tool to use. It also caters to a variety of topics including Asset, Facility, Subassembly. Download this PPT design now to present a convincing pitch that not only emphasizes the topic but also showcases your presentation skills.

Customer Support Process Flow Diagram For Online Stores Infographics PDF
This slide includes customer support flow chart which can be used by service department to increase customer satisfaction rate. It includes elements such as development department, tester, technical support team, sales team and customers.Presenting Customer Support Process Flow Diagram For Online Stores Infographics PDF to dispense important information. This template comprises one stage. It also presents valuable insights into the topics including Implement Solution, Determine Solution, Formulate Error Report . This is a completely customizable PowerPoint theme that can be put to use immediately. So, download it and address the topic impactfully.
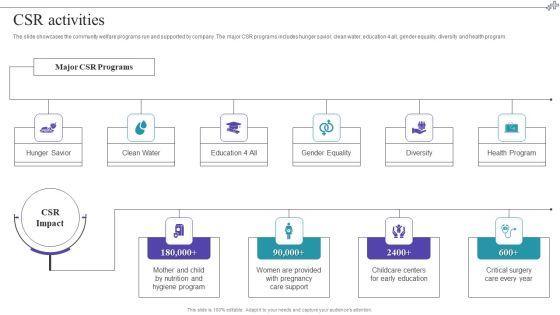
Medical Care Company Overview CSR Activities Infographics PDF
The slide showcases the community welfare programs run and supported by company. The major CSR programs includes hunger savior, clean water, education 4 all, gender equality, diversity and health program. Presenting Medical Care Company Overview CSR Activities Infographics PDF to provide visual cues and insights. Share and navigate important information on four stages that need your due attention. This template can be used to pitch topics like Gender Equality, Csr Activities. In addtion, this PPT design contains high resolution images, graphics, etc, that are easily editable and available for immediate download.
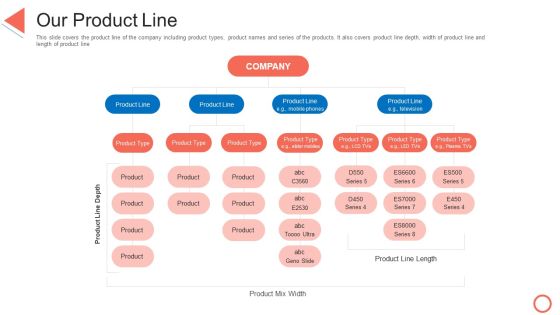
Our Product Line STP Approaches In Retail Marketing Infographics PDF
This slide covers the product line of the company including product types, product names and series of the products. It also covers product line depth, width of product line and length of product line. This is a our product line stp approaches in retail marketing infographics pdf template with various stages. Focus and dispense information on six stages using this creative set, that comes with editable features. It contains large content boxes to add your information on topics like our product line. You can also showcase facts, figures, and other relevant content using this PPT layout. Grab it now.
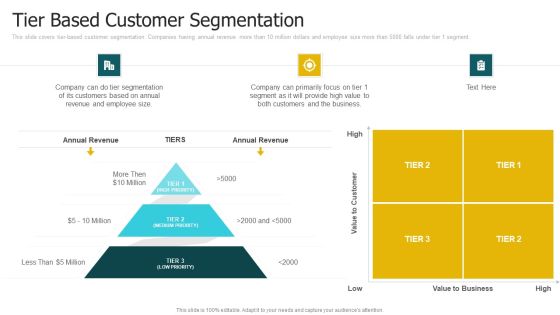
Tier Based Customer Segmentation Ppt Infographics Influencers PDF
This slide covers tier based customer segmentation. Companies having annual revenue more than 10 million dollars and employee size more than 5000 falls under tier 1 segment. This is a tier based customer segmentation ppt infographics influencers pdf template with various stages. Focus and dispense information on four stages using this creative set, that comes with editable features. It contains large content boxes to add your information on topics like value, customers, business, revenue. You can also showcase facts, figures, and other relevant content using this PPT layout. Grab it now.
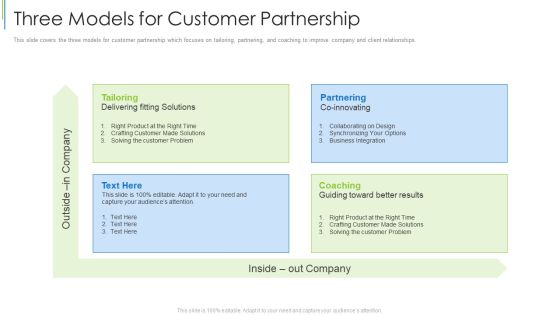
Three Models For Customer Partnership Ppt Professional Infographics PDF
This slide covers the three models for customer partnership which focuses on tailoring, partnering, and coaching to improve company and client relationships. This is a three models for customer partnership ppt professional infographics pdf template with various stages. Focus and dispense information on four stages using this creative set, that comes with editable features. It contains large content boxes to add your information on topics like three models for customer partnership. You can also showcase facts, figures, and other relevant content using this PPT layout. Grab it now.

Diversity Initiatives And Practices At Organizational Environment Infographics PDF
This slide exhibits diversity initiatives and practices at workplace environment. It includes major element such as improving and making use of diversity, formulating HR practices, training and staffing and so on. Presenting diversity initiatives and practices at organizational environment infographics pdf to dispense important information. This template comprises three stages. It also presents valuable insights into the topics including strategic, management, innovation. This is a completely customizable PowerPoint theme that can be put to use immediately. So, download it and address the topic impactfully.
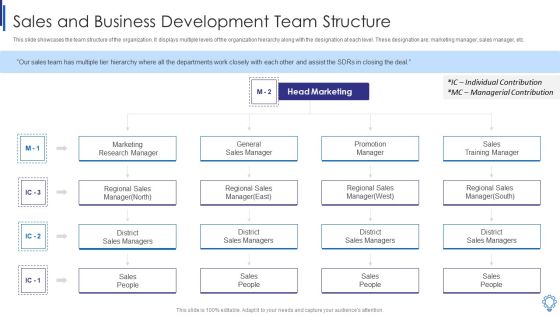
Sales And Business Development Team Structure Infographics PDF
This slide showcases the team structure of the organization. It displays multiple levels of the organization hierarchy along with the designation at each level. These designation are marketing manager, sales manager, etc. Presenting sales and business development team structure infographics pdf to provide visual cues and insights. Share and navigate important information on four stages that need your due attention. This template can be used to pitch topics like marketing research manager, general sales manager, sales training manager, individual contribution, managerial contribution. In addtion, this PPT design contains high resolution images, graphics, etc, that are easily editable and available for immediate download.

New Project Management Organizational Structure Of A PMO Infographics PDF
This slide shows the hierarchy structure of PMO, that includes PMO head, departments under the PMO, and various projects under each department. This is a New Project Management Organizational Structure Of A PMO Infographics PDF template with various stages. Focus and dispense information on five stages using this creative set, that comes with editable features. It contains large content boxes to add your information on topics like Research And Development Department, Sales, Marketing, HR Department, IT Department, PMO Head. You can also showcase facts, figures, and other relevant content using this PPT layout. Grab it now.

PMP Tools Cost Of Quality Data Analysis Tool Infographics PDF
This slide provides the glimpse about the cost of quality technique which focuses on cost of conformance such as prevention and appraisal cost and non conformance such as internal and external failure costs.Presenting PMP Tools Cost Of Quality Data Analysis Tool Infographics PDF to provide visual cues and insights. Share and navigate important information on six stages that need your due attention. This template can be used to pitch topics like Cost Of Conformance, Appraisal Cost, Prevention Cost In addtion, this PPT design contains high resolution images, graphics, etc, that are easily editable and available for immediate download.

Construction Services Company Profile Construction Group Organizational Structure Infographics PDF
This slide shows the organizational structure of our construction group which covers board, executive, director, manager and support level director, manager and specialist.Presenting Construction Services Company Profile Construction Group Organizational Structure Infographics PDF to provide visual cues and insights. Share and navigate important information on five stages that need your due attention. This template can be used to pitch topics like Financial Manager, Finance Director, Executive Level In addtion, this PPT design contains high resolution images, graphics, etc, that are easily editable and available for immediate download.

Project Management Governance Framework With Team Member Details Infographics PDF
This slide visually represents project governance framework with team member details which can be beneficial for organizations to create a formal structure of a project team. It contains information about executive members of board, support, leader, declaration, director, analysis, risk mitigation and stakeholders Persuade your audience using this Project Management Governance Framework With Team Member Details Infographics PDF. This PPT design covers three stages, thus making it a great tool to use. It also caters to a variety of topics including Supporting Management, Project Management, Organizational Analysis Manager. Download this PPT design now to present a convincing pitch that not only emphasizes the topic but also showcases your presentation skills.

Key Members Of Logistics Information Technology Department Infographics PDF
This slide illustrates key members of logistics information technology department. It provides information about chief technical officer, process engineering, supply chain analyst, operator, logistics manager, operations manager, etc. This is a Key Members Of Logistics Information Technology Department Infographics PDF template with various stages. Focus and dispense information on three stages using this creative set, that comes with editable features. It contains large content boxes to add your information on topics like Supply Chain Analyst, Operations Manager, Chief Technical Officer. You can also showcase facts, figures, and other relevant content using this PPT layout. Grab it now.
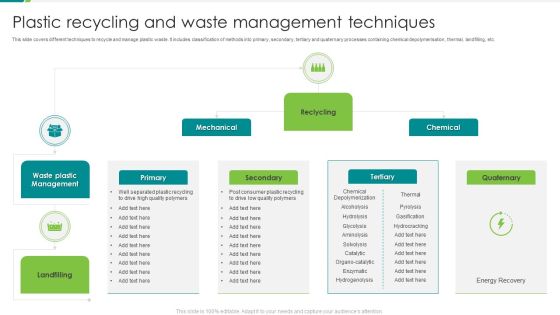
Plastic Recycling And Waste Management Techniques Ppt Infographics Designs PDF
This slide covers different techniques to recycle and manage plastic waste. It includes classification of methods into primary, secondary, tertiary and quaternary processes containing chemical depolymerisation, thermal, landfilling, etc. Persuade your audience using this Plastic Recycling And Waste Management Techniques Ppt Infographics Designs PDF. This PPT design covers three stages, thus making it a great tool to use. It also caters to a variety of topics including Mechanical, Reclycling, Chemical, Secondary. Download this PPT design now to present a convincing pitch that not only emphasizes the topic but also showcases your presentation skills.

Basis Of Global Market Segmentation Framework Ppt Infographics Demonstration PDF
This slide represents the framework showing the basis of international market segmentation and strategic brand positioning. It includes segmentation of international market on the basis of macro- level and behavioral level. Presenting Basis Of Global Market Segmentation Framework Ppt Infographics Demonstration PDF to dispense important information. This template comprises five stages. It also presents valuable insights into the topics including International Market, Segmentation Basis, Hybrid Basis Integration, Strategic Brand Positioning. This is a completely customizable PowerPoint theme that can be put to use immediately. So, download it and address the topic impactfully.
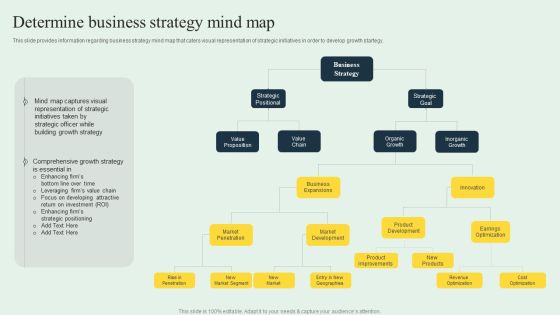
Effective Strategy Development Determine Business Strategy Mind Map Infographics PDF
This slide provides information regarding business strategy mind map that caters visual representation of strategic initiatives in order to develop growth startegy. Slidegeeks is one of the best resources for PowerPoint templates. You can download easily and regulate Effective Strategy Development Determine Business Strategy Mind Map Infographics PDF for your personal presentations from our wonderful collection. A few clicks is all it takes to discover and get the most relevant and appropriate templates. Use our Templates to add a unique zing and appeal to your presentation and meetings. All the slides are easy to edit and you can use them even for advertisement purposes.
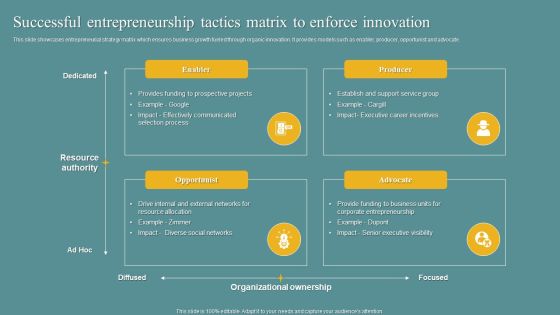
Successful Entrepreneurship Tactics Matrix To Enforce Innovation Infographics PDF
This slide showcases entrepreneurial strategy matrix which ensures business growth fueled through organic innovation. It provides models such as enabler, producer, opportunist and advocate. Persuade your audience using this Successful Entrepreneurship Tactics Matrix To Enforce Innovation Infographics PDF. This PPT design covers four stages, thus making it a great tool to use. It also caters to a variety of topics including Enabler, Opportunist, Advocate. Download this PPT design now to present a convincing pitch that not only emphasizes the topic but also showcases your presentation skills.

Eight Levers To Strategic Frameworks For Digital Transformation Infographics PDF
This slide includes digital transformation framework divided into two segments. Broadly this division is premised upon growth drivers and operational improvement. Persuade your audience using this Eight Levers To Strategic Frameworks For Digital Transformation Infographics PDF. This PPT design covers one stages, thus making it a great tool to use. It also caters to a variety of topics including Digital Transformation, Growth Drivers, Operational Improvement. Download this PPT design now to present a convincing pitch that not only emphasizes the topic but also showcases your presentation skills.

Mind Map Of Blue Ocean Leadership Ppt Infographics Layouts PDF
This template covers a tipping point leadership mind map. It shows differences from the conventional approach. It also depicts that blue ocean leadership can help organizations realize oceans of employee potential and stop leaders from wasting their time. The step-by-step process we have outlined gives organizations and leaders a clear roadmap to approach the implementation of blue ocean leadership. Do you know about Slidesgeeks Mind Map Of Blue Ocean Leadership Ppt Infographics Layouts PDF These are perfect for delivering any kind od presentation. Using it, create PowerPoint presentations that communicate your ideas and engage audiences. Save time and effort by using our pre designed presentation templates that are perfect for a wide range of topic. Our vast selection of designs covers a range of styles, from creative to business, and are all highly customizable and easy to edit. Download as a PowerPoint template or use them as Google Slides themes.

Cognitive Sensing Innovation Architecture Of Cognitive Radio Networks Infographics PDF
This slide outlines a cognitive radio network architecture consisting of primary and secondary networks where licensed users use the primary network and unlicensed users use the secondary without interrupting each other. Present like a pro with Cognitive Sensing Innovation Architecture Of Cognitive Radio Networks Infographics PDF Create beautiful presentations together with your team, using our easy-to-use presentation slides. Share your ideas in real-time and make changes on the fly by downloading our templates. So whether you are in the office, on the go, or in a remote location, you can stay in sync with your team and present your ideas with confidence. With Slidegeeks presentation got a whole lot easier. Grab these presentations today.

Managing Employee Turnover Employee Compensation Strategy Infographics PDF
Purpose of the following slide is to show the employee compensation strategy as it displays the key issues within the current strategy along with new policies that the organization needs to introduced. The provided table displays a timeline for implementing these strategies.This is a Managing Employee Turnover Employee Compensation Strategy Infographics PDF template with various stages. Focus and dispense information on one stage using this creative set, that comes with editable features. It contains large content boxes to add your information on topics like Compensation, Decided Compensation, Overall Compensation. You can also showcase facts, figures, and other relevant content using this PPT layout. Grab it now.

Modern Day Talent Sourcing Strategies For Recruitment Consulting Infographics PDF
The Following slide highlights the modern day talent sourcing strategies for recruitment consulting illustrating virtual recruitment, employer value proposition, referral program, aptitude hiring and adaptation.Persuade your audience using this Modern Day Talent Sourcing Strategies For Recruitment Consulting Infographics PDF This PPT design covers five stages, thus making it a great tool to use. It also caters to a variety of topics including Virtual Recruitment, Referral Program, Aptitude Hiring Download this PPT design now to present a convincing pitch that not only emphasizes the topic but also showcases your presentation skills.

Safety Audit Types For Fire Safety At Workplace Infographics PDF
The following slide covers types of safety audit aimed at examining and identifying gaps and issues in safety procedures and ensure compliance to norms. This covers compliance audit, program audit and management system audit. Presenting Safety Audit Types For Fire Safety At Workplace Infographics PDF to dispense important information. This template comprises three stages. It also presents valuable insights into the topics including Compliance Audit, Program Audit, Management System Audit. This is a completely customizable PowerPoint theme that can be put to use immediately. So, download it and address the topic impactfully.
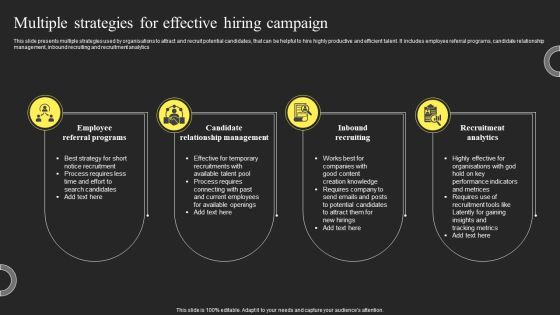
Multiple Strategies For Effective Hiring Campaign Infographics PDF
This slide presents multiple strategies used by organisations to attract and recruit potential candidates, that can be helpful to hire highly productive and efficient talent. It includes employee referral programs, candidate relationship management, inbound recruiting and recruitment analytics. Persuade your audience using this Multiple Strategies For Effective Hiring Campaign Infographics PDF. This PPT design covers four stages, thus making it a great tool to use. It also caters to a variety of topics including Employee Referral Programs, Candidate Relationship Management, Inbound Recruiting. Download this PPT design now to present a convincing pitch that not only emphasizes the topic but also showcases your presentation skills.

Implementation Procedure For Degrees Of Service Management Infographics PDF
This slide mentions the implementation procedure for degrees of service management. It includes gather data, building the plan, executing the plan, reporting of SLM and post implementation review. Persuade your audience using this Implementation Procedure For Degrees Of Service Management Infographics PDF. This PPT design covers five stages, thus making it a great tool to use. It also caters to a variety of topics including Implementation Review, Execute Plan, Build Plan. Download this PPT design now to present a convincing pitch that not only emphasizes the topic but also showcases your presentation skills.

Effective Procurement Flow Diagram To Mitigate Supplier Risk Infographics PDF
The following slide delineates a comprehensive procurement flow chart used to reduce supplier risk. It provides information about originator, project manager, sign-off authority, and super user. Persuade your audience using this Effective Procurement Flow Diagram To Mitigate Supplier Risk Infographics PDF. This PPT design covers four stages, thus making it a great tool to use. It also caters to a variety of topics including Project Manager, Originator, Super User. Download this PPT design now to present a convincing pitch that not only emphasizes the topic but also showcases your presentation skills.

Flow Diagram Illustrating It Procurement Process Infographics PDF
The following slide delineates procurement flow chart used for IT procurement process. The major steps involved in the template are selecting the product, obtaining a VPAT, filling out the IT purchase review form, etc. Persuade your audience using this Flow Diagram Illustrating It Procurement Process Infographics PDF. This PPT design covers one stages, thus making it a great tool to use. It also caters to a variety of topics including Product, Required, Organization. Download this PPT design now to present a convincing pitch that not only emphasizes the topic but also showcases your presentation skills.

Human Resources Performance Indicators Setting Process Diagram Infographics PDF
Following slide includes employee assessment flow chart which can be used to determine staff performance and productivity. It includes cross functioning between personals such as employees, department head, deputy manager, general manager and comprehensive department. Presenting Human Resources Performance Indicators Setting Process Diagram Infographics PDF to dispense important information. This template comprises one stages. It also presents valuable insights into the topics including Head Of Department, Deputy Manager, Reporting Manager, Team Leader. This is a completely customizable PowerPoint theme that can be put to use immediately. So, download it and address the topic impactfully.

AI Applications In Logistics And Supply Chain Management Infographics PDF
This slide covers uses of artificial intelligence in logistics and supply chain management. It involves applications such as demand forecasting models, integrated business planning, dynamic planning optimization and physical flow automation.Persuade your audience using this AI Applications In Logistics And Supply Chain Management Infographics PDF. This PPT design covers four stages, thus making it a great tool to use. It also caters to a variety of topics including Forecasting Models, Integrated Business, Dynamic Planning. Download this PPT design now to present a convincing pitch that not only emphasizes the topic but also showcases your presentation skills.
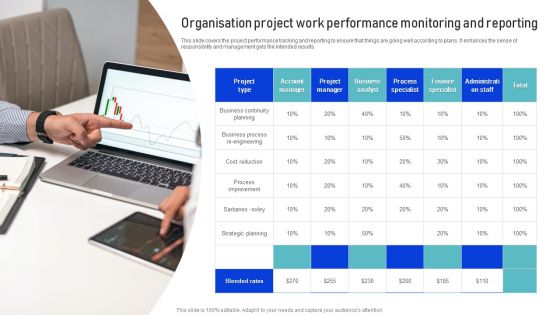
Organisation Project Work Performance Monitoring And Reporting Infographics PDF
This slide covers the project performance tracking and reporting to ensure that things are going well according to plans. It enhances the sense of responsibility and management gets the intended results. Presenting Organisation Project Work Performance Monitoring And Reporting Infographics PDF to dispense important information. This template comprises one stages. It also presents valuable insights into the topics including Business Continuity Planning, Strategic Planning, Business Analyst. This is a completely customizable PowerPoint theme that can be put to use immediately. So, download it and address the topic impactfully.

3 Key Strategic Areas For Effective Marketing Strategy Infographics PDF
This slide provides key strategic areas for developing a marketing plan that generates leads, sales and eventually business growth. It includes define clear goals, select marketing channels and implement efficient plan. Persuade your audience using this 3 Key Strategic Areas For Effective Marketing Strategy Infographics PDF. This PPT design covers three stages, thus making it a great tool to use. It also caters to a variety of topics including Strategy, Marketing Channels, Efficient Plan. Download this PPT design now to present a convincing pitch that not only emphasizes the topic but also showcases your presentation skills.
