Agenda Infographic
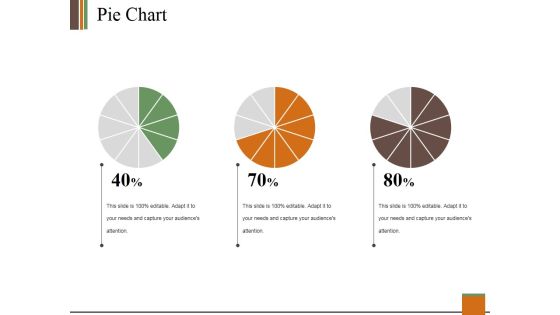
Pie Chart Ppt PowerPoint Presentation Summary Infographics
This is a pie chart ppt powerpoint presentation summary infographics. This is a three stage process. The stages in this process are pie, process, percentage, finance, business.

Combo Chart Ppt PowerPoint Presentation Portfolio Infographics
This is a combo chart ppt powerpoint presentation portfolio infographics. This is a eight stage process. The stages in this process are market size, growth, years, finance, business.

Line Chart Ppt PowerPoint Presentation Infographics
This is a line chart ppt powerpoint presentation infographics. This is a two stage process. The stages in this process are line chart, product, business, marketing, management.

Combo Chart Ppt PowerPoint Presentation Professional Infographics
This is a combo chart ppt powerpoint presentation professional infographics. This is a three stage process. The stages in this process are combo chart, market size, product.

Stock Chart Ppt PowerPoint Presentation Ideas Infographics
This is a stock chart ppt powerpoint presentation ideas infographics. This is a two stage process. The stages in this process are high, volume, low, product, stock chart.

Key Skills Circle Chart Ppt Infographics
This is a key skills circle chart ppt infographics. This is a five stage process. The stages in this process are questioning, researching, analyzing, evaluating, communicating, key skills.

Stock Chart Ppt PowerPoint Presentation Infographics
This is a stock chart ppt powerpoint presentation infographics. This is a five stage process. The stages in this process are high, volume, low.

Area Chart Ppt PowerPoint Presentation Infographics
This is a area chart ppt powerpoint presentation infographics. This is a one stage process. The stages in this process are sales in percentage, jan, feb, mar, apr.

Stock Chart Ppt PowerPoint Presentation Portfolio Infographics
This is a stock chart ppt powerpoint presentation portfolio infographics. This is a five stage process. The stages in this process are high, volume, low, finance, business.

Quarterly Roadmap To Build Guidance Program Infographics
Presenting our jaw-dropping quarterly roadmap to build guidance program infographics. You can alternate the color, font size, font type, and shapes of this PPT layout according to your strategic process. This PPT presentation is compatible with Google Slides and is available in both standard screen and widescreen aspect ratios. You can also download this well-researched PowerPoint template design in different formats like PDF, JPG, and PNG. So utilize this visually-appealing design by clicking the download button given below.

Sales Projections Ppt PowerPoint Presentation Outline Infographics
Presenting this set of slides with name sales projections ppt powerpoint presentation outline infographics. The topics discussed in these slide is sales projections. This is a completely editable PowerPoint presentation and is available for immediate download. Download now and impress your audience.
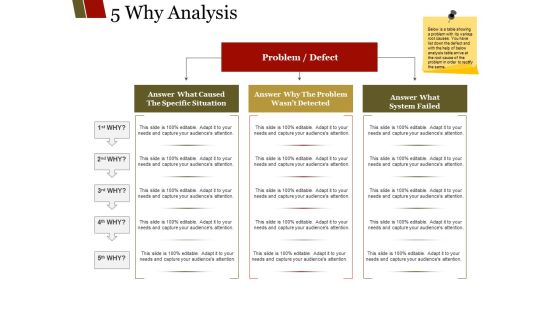
Why Analysis Ppt PowerPoint Presentation Outline Infographics
This is a why analysis ppt powerpoint presentation outline infographics. This is a three stage process. The stages in this process are answer what caused the specific situation, answer why the problem wasn t detected, answer what, system failed, problem defect.
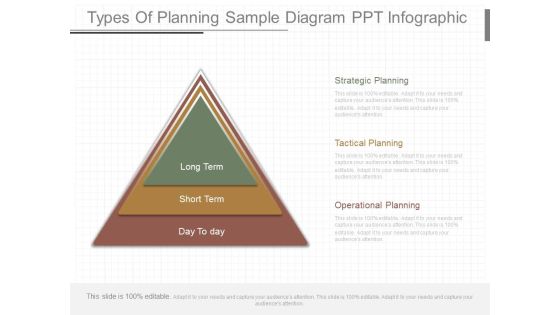
Types Of Planning Sample Diagram Ppt Infographics
This is a types of planning sample diagram ppt infographics. This is a three stage process. The stages in this process are long term, short term, day to day, strategic planning, tactical planning, operational planning.
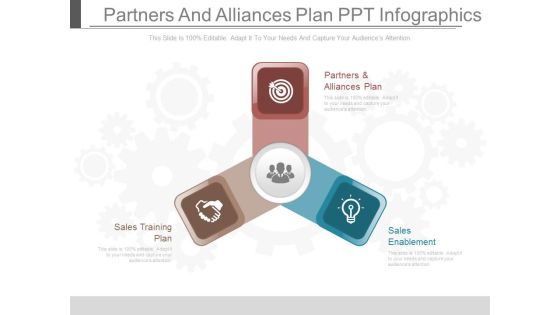
Partners And Alliances Plan Ppt Infographics
This is a partners and alliances plan ppt infographics. This is a three stage process. The stages in this process are partners and alliances plan, sales training plan, sales enablement.
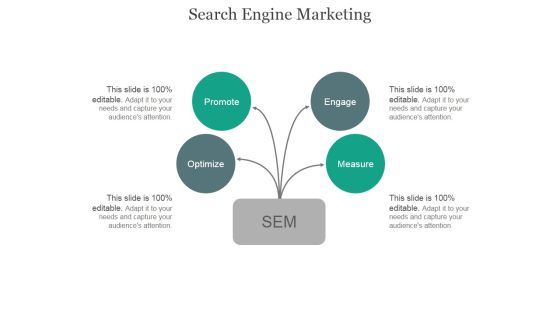
Search Engine Marketing Ppt PowerPoint Presentation Infographics
This is a search engine marketing ppt powerpoint presentation infographics. This is a four stage process. The stages in this process are optimize, promote, engage, measure.

Five Years System Design Planning Roadmap Infographics
Presenting our jaw dropping five years system design planning roadmap infographics. You can alternate the color, font size, font type, and shapes of this PPT layout according to your strategic process. This PPT presentation is compatible with Google Slides and is available in both standard screen and widescreen aspect ratios. You can also download this well researched PowerPoint template design in different formats like PDF, JPG, and PNG. So utilize this visually appealing design by clicking the download button given below.

Mobile Marketing Business Plan Template Ppt Infographics
This is a mobile marketing business plan template ppt infographics. This is a one stage process. The stages in this process are coupons, banners, search, location based, proximity, apps, sms mms, mobile marketing, customer, strategy, analysis, rci, reliance.

Recovery Plan Business Template Ppt Infographics
This is a recovery plan business template ppt infographics. This is a four stage process. The stages in this process are mitigation, recovery, response, preparation, restoration, emergency, pre impact, capacity building, disaster management cycle.
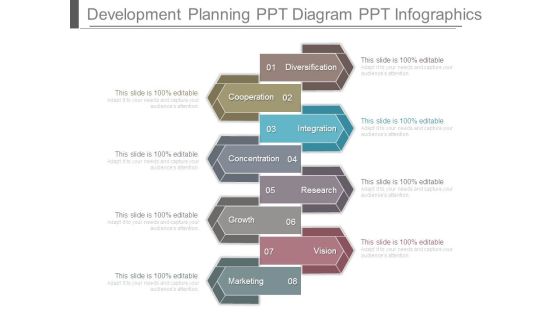
Development Planning Ppt Diagram Ppt Infographics
This is a development planning ppt diagram ppt infographics. This is a eight stage process. The stages in this process are diversification, cooperation, integration, concentration, research, growth, vision, marketing.

Action Plan For Objectives Ppt Infographics
This is a action plan for objectives ppt infographics. This is a four stage process. The stages in this process are objectives, tasks, success criteria, time frame, resources, room, time period.

Sample Sales Cycle Flow Chart Ppt Infographics
This is a sample sales cycle flow chart ppt infographics. This is a seven stage process. The stages in this process are fix it, feedback, ask customers, assess progress, set the improved product, make changes, improve it.

Work Experience Linear Timeline Ppt Infographics
This is a work experience linear timeline ppt infographics. This is a four stage process. The stages in this process are business, process, marketing, strategy, time planning.
Funnel Ppt PowerPoint Presentation Icon Infographics
This is a funnel ppt powerpoint presentation icon infographics. This is a four stage process. The stages in this process are business, marketing, funnel, process, planning.
Our Goal Ppt PowerPoint Presentation Model Infographics
This is a our goal ppt powerpoint presentation model infographics. This is a four stage process. The stages in this process are goal, arrows, planning, process, business.

Our Goal Ppt PowerPoint Presentation Portfolio Infographics
This is a our goal ppt powerpoint presentation portfolio infographics. This is a three stage process. The stages in this process are business, marketing, strategy, planning, goal.

Circular Ppt PowerPoint Presentation Summary Infographics
This is a circular ppt powerpoint presentation summary infographics. This is a eight stage process. The stages in this process are business, marketing, planning, strategy, loop.

Stacked Line Ppt PowerPoint Presentation Layouts Infographics
This is a stacked line ppt powerpoint presentation layouts infographics. This is a three stage process. The stages in this process are business, marketing, strategy, finance, planning.

Comparison Ppt PowerPoint Presentation Ideas Infographics
This is a comparison ppt powerpoint presentation ideas infographics. This is a three stages process. The stages in this process are comparison, financial, business, planning, marketing.
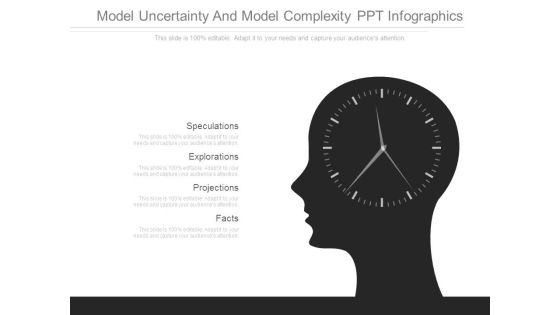
Model Uncertainty And Model Complexity Ppt Infographics
This is a model uncertainty and model complexity ppt infographics. This is a four stage process. The stages in this process are speculations, explorations, projections, facts.

Todays Goal Ppt PowerPoint Presentation Show Infographics
This is a todays goal ppt powerpoint presentation show infographics. This is a three stage process. The stages in this process are reliability, superior quality, commitment and dedication.

Venn Ppt PowerPoint Presentation Gallery Infographics
This is a venn ppt powerpoint presentation gallery infographics. This is a five stage process. The stages in this process are venn, business, marketing, process, management.

Comparison Ppt PowerPoint Presentation Model Infographics
This is a comparison ppt powerpoint presentation model infographics. This is a two stage process. The stages in this process are male, female, compare, percentage, human resource.

Comparison Ppt PowerPoint Presentation Pictures Infographics
This is a comparison ppt powerpoint presentation pictures infographics. This is a two stage process. The stages in this process are comparison, male, female, business, percentage.
Our Mission Ppt PowerPoint Presentation Show Infographics
This is a our mission ppt powerpoint presentation show infographics. This is a two stage process. The stages in this process are vision, mission.
Timeline Ppt PowerPoint Presentation Icon Infographics
This is a timeline ppt powerpoint presentation icon infographics. This is a five stage process. The stages in this process are timeline, business, marketing, success, planning.
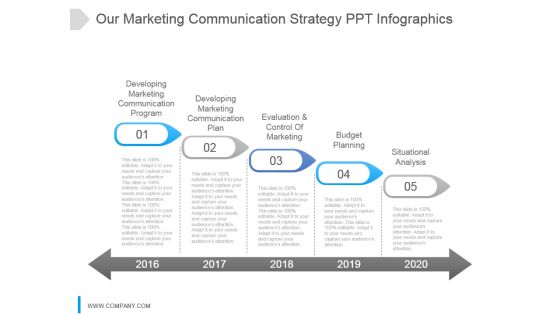
Our Marketing Communication Strategy Ppt Infographics
This is a our marketing communication strategy ppt infographics. This is a five stage process. The stages in this process are developing marketing communication program, developing marketing communication plan, evaluation and control of marketing, budget planning, situational analysis.
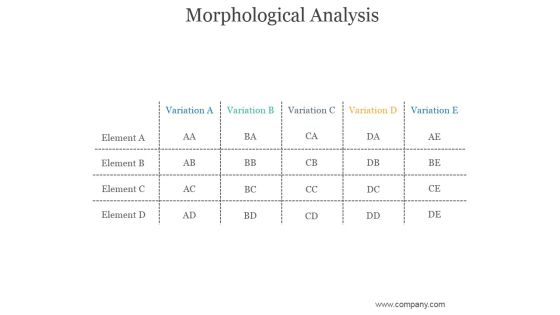
Morphological Analysis Ppt PowerPoint Presentation Infographics
This is a morphological analysis ppt powerpoint presentation infographics. This is a five stage process. The stages in this process are variation, element, business, marketing, success.

Retail Conversion Strategy Diagram Ppt Infographics
This is a retail conversion strategy diagram ppt infographics. This is a five stage process. The stages in this process are sharing, browsing, buying, researching, evaluating.

About Us Ppt PowerPoint Presentation Inspiration Infographics
This is a about us ppt powerpoint presentation inspiration infographics. This is a three stage process. The stages in this process are about us, communication, management, planning, business.

Venn Ppt PowerPoint Presentation Visual Aids Infographics
This is a venn ppt powerpoint presentation visual aids infographics. This is a three stage process. The stages in this process are venn, planning, business, strategy, management.

Timeline Template 1 Ppt PowerPoint Presentation Infographics
This is a timeline template 1 ppt powerpoint presentation infographics. This is a three stage process. The stages in this process are year, time planning, growth, success.

Comparison Ppt PowerPoint Presentation Gallery Infographics
This is a comparison ppt powerpoint presentation gallery infographics. This is a two stage process. The stages in this process are business, strategy, analysis, planning, finance, compare.
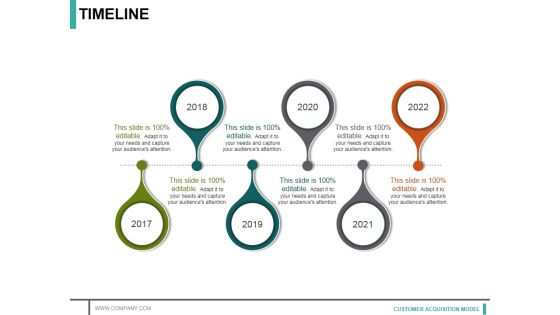
Timeline Ppt PowerPoint Presentation Model Infographics
This is a timeline ppt powerpoint presentation model infographics. This is a six stage process. The stages in this process are year, growth, success, time planning, business.

Puzzle Ppt PowerPoint Presentation Layouts Infographics
This is a puzzle ppt powerpoint presentation layouts infographics. This is a five stage process. The stages in this process are business, marketing, puzzle, strategy, planning.
Silhouettes Ppt PowerPoint Presentation Gallery Infographics
This is a silhouettes ppt powerpoint presentation gallery infographics. This is a two stage process. The stages in this process are silhouettes, communication, management, business, planning.
Quotes Ppt Powerpoint Presentation Icon Infographics
This is a quotes ppt powerpoint presentation icon infographics. This is a one stage process. The stages in this process are quotes, business, planning, strategy, management.

Financial Ppt PowerPoint Presentation Styles Infographics
This is a financial ppt powerpoint presentation styles infographics. This is a four stage process. The stages in this process are financial, analysis, management, business, planning.

Financial Summary Ppt PowerPoint Presentation Professional Infographics
This is a financial summary ppt powerpoint presentation professional infographics. This is a five stage process. The stages in this process are business, marketing, finance, planning, strategy.
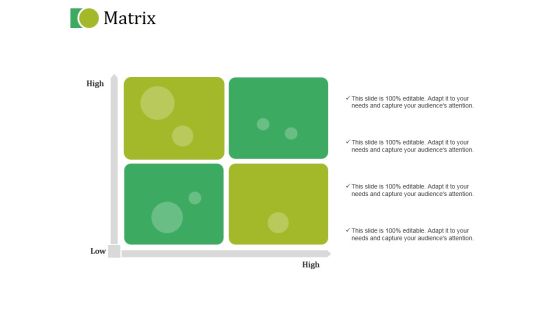
Matrix Ppt PowerPoint Presentation Show Infographics
This is a matrix ppt powerpoint presentation show infographics. This is a four stage process. The stages in this process are high, low, matrix, strategy, planning.

Comparison Ppt PowerPoint Presentation Professional Infographics
This is a comparison ppt powerpoint presentation professional infographics. This is a two stage process. The stages in this process are male, female, strategy, planning, technology.
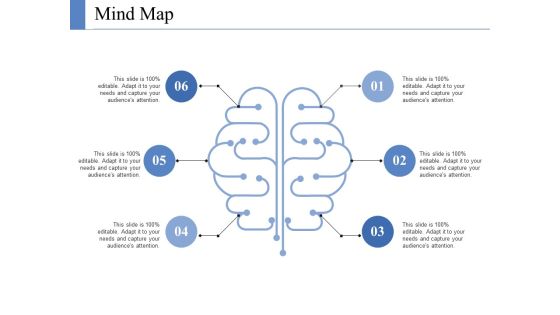
Mind Map Ppt PowerPoint Presentation Layouts Infographics
This is a mind map ppt powerpoint presentation layouts infographics. This is a six stage process. The stages in this process are mind map, marketing, strategy, planning, technology.
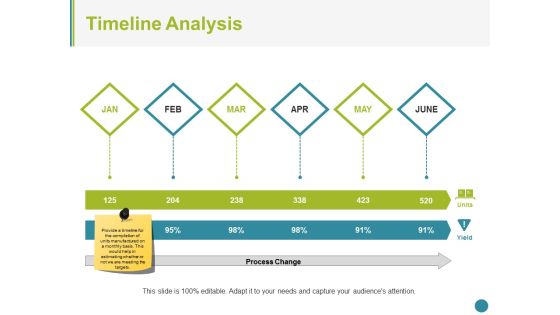
Timeline Analysis Ppt PowerPoint Presentation Ideas Infographics
This is a timeline analysis ppt powerpoint presentation ideas infographics. This is a six stage process. The stages in this process are timeline, analysis, process, strategy, planning, success.
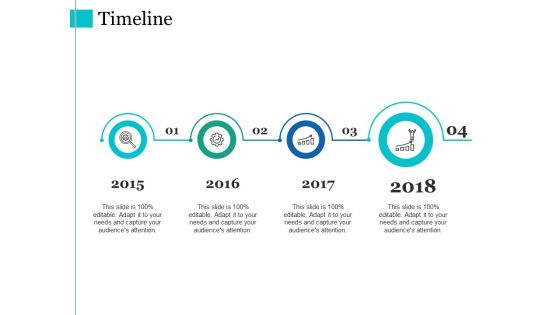
Timeline Ppt PowerPoint Presentation Styles Infographics
This is a timeline ppt powerpoint presentation styles infographics. This is a four stage process. The stages in this process are year, growth, success, time planning, business.

Our Goal Ppt PowerPoint Presentation Gallery Infographics
This is a our goal ppt powerpoint presentation gallery infographics. This is a three stage process. The stages in this process are planning, strategy, icons, management, business.

Departments And Team Ppt PowerPoint Presentation Infographics
This is a departments and team ppt powerpoint presentation infographics. This is a three stage process. The stages in this process are product manager, graphic designer, web designer, marketing, ceo.

Market Budget Ppt PowerPoint Presentation Infographics
This is a market budget ppt powerpoint presentation infographics. This is a five stage process. The stages in this process are marketing objectives, target marketing, business opportunities, competition, product and services.

Stacked Line Ppt PowerPoint Presentation Infographics
This is a stacked line ppt powerpoint presentation infographics. This is a two stage process. The stages in this process are business, marketing, growth, success, line.

Stacked Bar Ppt PowerPoint Presentation Summary Infographics
This is a stacked bar ppt powerpoint presentation summary infographics. This is a four stage process. The stages in this process are product, unit count, business, marketing, graph.
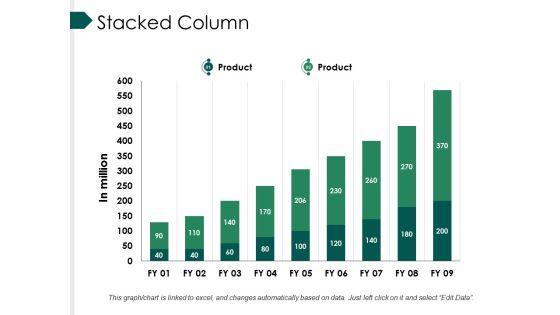
Stacked Column Ppt PowerPoint Presentation Professional Infographics
This is a stacked column ppt powerpoint presentation professional infographics. This is a nine stage process. The stages in this process are bar, marketing, strategy, finance, teamwork.

Career Objectives Ppt PowerPoint Presentation Infographics
This is a career objectives ppt powerpoint presentation infographics. This is a three stage process. The stages in this process are establishing strategic intent, setting long term objectives, choice of strategy.
 Home
Home