Agenda Infographic
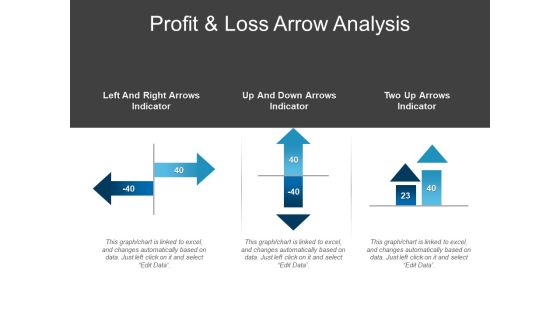
Profit And Loss Arrow Analysis Ppt PowerPoint Presentation Infographic Template Model
This is a profit and loss arrow analysis ppt powerpoint presentation infographic template model. This is a three stage process. The stages in this process are comparison chart, comparison table, comparison matrix.
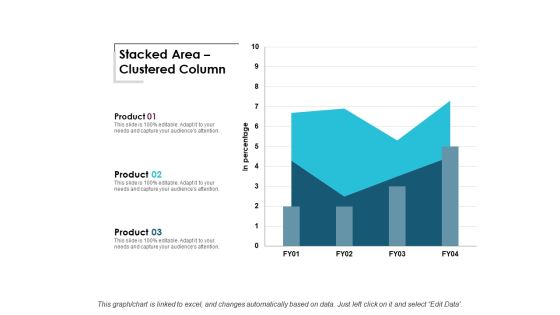
Stacked Area Clustered Column Ppt Powerpoint Presentation Infographic Template Background Images
This is a stacked area clustered column ppt powerpoint presentation infographic template background images. This is a three stage process. The stages in this process are area chart, finance, marketing, management, investment.

Three Graphs For Path Algorithm Ppt PowerPoint Presentation Infographic Template Templates
This is a three graphs for path algorithm ppt powerpoint presentation infographic template templates. This is a three stage process. The stages in this process are graph theory, chart theory, business.
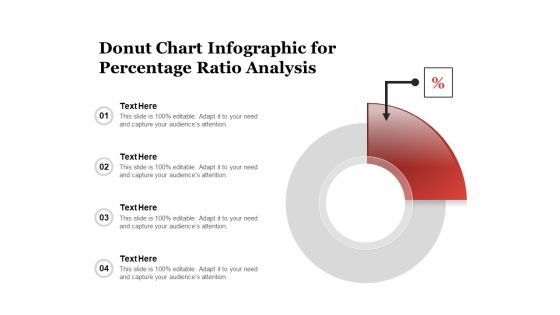
Donut Chart Infographic For Percentage Ratio Analysis Ppt PowerPoint Presentation File Graphics Example PDF
Persuade your audience using this donut chart infographic for percentage ratio analysis ppt powerpoint presentation file graphics example pdf. This PPT design covers four stages, thus making it a great tool to use. It also caters to a variety of topics including donut chart infographic for percentage ratio analysis. Download this PPT design now to present a convincing pitch that not only emphasizes the topic but also showcases your presentation skills.

Pie Chart Infographic Showing Revenue Share Ppt Styles Graphics Pictures PDF
Persuade your audience using this pie chart infographic showing revenue share ppt styles graphics pictures pdf. This PPT design covers three stages, thus making it a great tool to use. It also caters to a variety of topics including pie chart infographic showing revenue share. Download this PPT design now to present a convincing pitch that not only emphasizes the topic but also showcases your presentation skills.
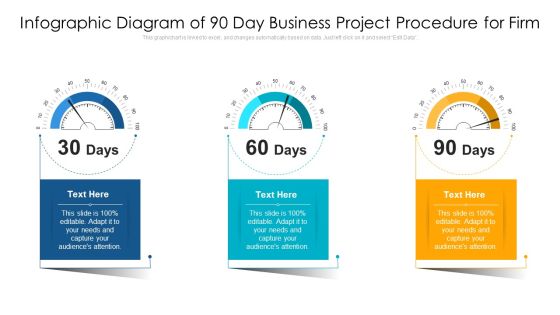
Infographic Diagram Of 90 Day Business Project Procedure For Firm Ppt PowerPoint Presentation Gallery Inspiration PDF
Showcasing this set of slides titled infographic diagram of 90 day business project procedure for firm ppt powerpoint presentation gallery inspiration pdf. The topics addressed in these templates are infographic diagram of 90 day business project procedure for firm. All the content presented in this PPT design is completely editable. Download it and make adjustments in color, background, font etc. as per your unique business setting.

Big Data Opportunities And Challenges Template 1 Ppt PowerPoint Presentation Infographic Template Summary
This is a big data opportunities and challenges template 1 ppt powerpoint presentation infographic template summary. This is a three stage process. The stages in this process are business, pie chart, finance, marketing, analysis, strategy.

Stacked Line With Markers Ppt PowerPoint Presentation Infographic Template Graphics Example
This is a stacked line with markers ppt powerpoint presentation infographic template graphics example. This is a one stage process. The stages in this process are in million, task, product, finance, line graph.

Competitor Revenue And Profit Template 2 Ppt PowerPoint Presentation Infographic Template Format Ideas
This is a competitor revenue and profit template 2 ppt powerpoint presentation infographic template format ideas. This is a five stage process. The stages in this process are competitor, revenue, profit, graph, growth.
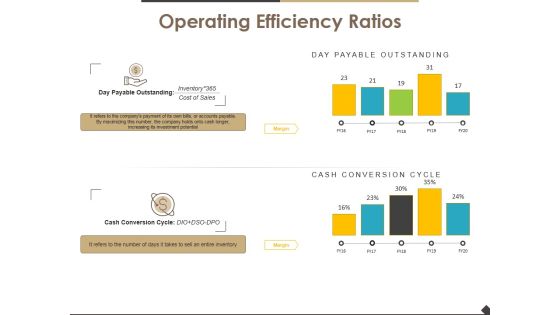
Operating Efficiency Ratios Template 2 Ppt PowerPoint Presentation Infographic Template Guide
This is a operating efficiency ratios template 2 ppt powerpoint presentation infographic template guide. This is a two stage process. The stages in this process are operating efficiency ratios, finance, marketing, strategy, business.

Customer Service Benchmarking Template 1 Ppt PowerPoint Presentation Infographic Template Shapes
This is a customer service benchmarking template 1 ppt powerpoint presentation infographic template shapes. This is a three stage process. The stages in this process are business, finance, marketing, strategy, analysis.

Balance Sheet Kpis Template 3 Ppt PowerPoint Presentation Infographic Template Demonstration
This is a balance sheet kpis template 3 ppt powerpoint presentation infographic template demonstration. This is a four stage process. The stages in this process are balance sheet, finance, marketing, strategy, analysis.

Profitability Ratios Template 5 Ppt PowerPoint Presentation Infographic Template Clipart Images
This is a profitability ratios template 5 ppt powerpoint presentation infographic template clipart images. This is a two stage process. The stages in this process are business, marketing, graph, roce, roa.

Company Sales And Performance Dashboard Ppt PowerPoint Presentation Pictures Infographic Template
This is a company sales and performance dashboard ppt powerpoint presentation pictures infographic template. This is a four stage process. The stages in this process are business, finance, analysis, management, marketing.
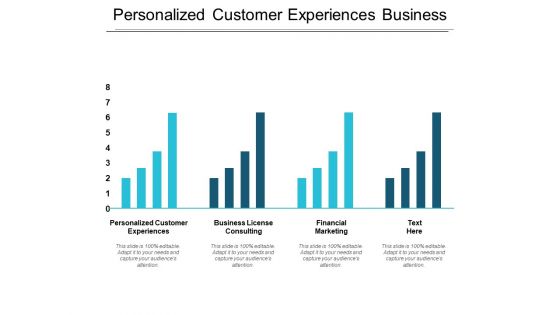
Personalized Customer Experiences Business License Consulting Finance Marketing Ppt PowerPoint Presentation Infographic Template Professional
This is a personalized customer experiences business license consulting finance marketing ppt powerpoint presentation infographic template professional. This is a four stage process. The stages in this process are personalized customer experiences, business license consulting, finance marketing.

Clustered Column Line Investment Ppt PowerPoint Presentation Infographic Template File Formats
This is a clustered column line investment ppt powerpoint presentation infographic template file formats. This is a three stage process. The stages in this process are finance, analysis, business, investment, marketing.
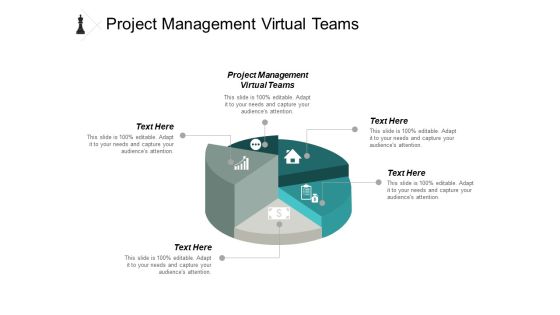
Project Management Virtual Teams Ppt PowerPoint Presentation Infographic Template Display Cpb
This is a project management virtual teams ppt powerpoint presentation infographic template display cpb. This is a six stage process. The stages in this process are project management virtual teams, business, management, marketing.
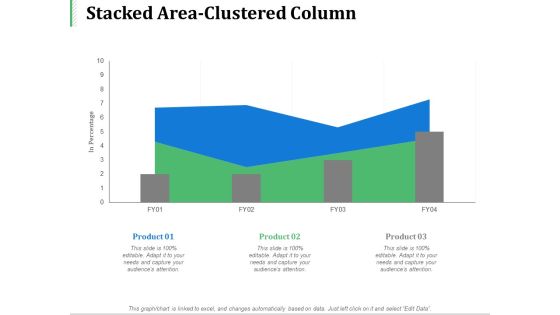
Stacked Area Clustered Column Marketing Ppt PowerPoint Presentation Infographic Template Vector
This is a stacked area clustered column marketing ppt powerpoint presentation infographic template vector. This is a three stage process. The stages in this process are business, management, marketing, product, percentage.

Employee Weekly Efficiency Dashboard Ppt PowerPoint Presentation Infographic Template Graphic Images
This is a employee weekly efficiency dashboard ppt powerpoint presentation infographic template graphic images. This is a six stage process. The stages in this process are percentage, product, business, management, marketing.

Stack Of Gold Bars In Shape Of Triangle Ppt Powerpoint Presentation Infographic Template Guidelines
This is a stack of gold bars in shape of triangle ppt powerpoint presentation infographic template guidelines. This is a four stage process. The stages in this process are stacked bar, pile bar, heap bar.
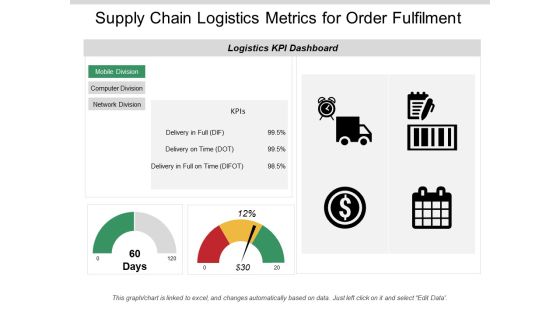
Supply Chain Logistics Metrics For Order Fulfilment Ppt PowerPoint Presentation Infographic Template Information
This is a supply chain logistics metrics for order fulfilment ppt powerpoint presentation infographic template information. This is a two stage process. The stages in this process are logistics performance, logistics dashboard, logistics kpis.
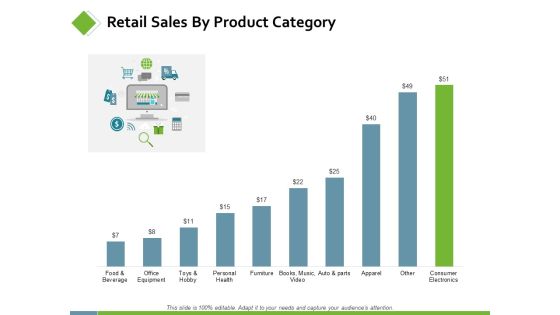
Retail Sales By Product Category Ppt PowerPoint Presentation Infographic Template Images
This is a retail sales by product category ppt powerpoint presentation infographic template images. This is a two stage process. The stages in this process are finance, analysis, business, investment, marketing.

Waterfall Graph Showing Births Deaths And Population Change Ppt PowerPoint Presentation Infographic Template Visual Aids
This is a waterfall graph showing births deaths and population change ppt powerpoint presentation infographic template visual aids. This is a three stage process. The stages in this process are profit and loss, balance sheet, income statement, benefit and loss.

Cash Flow Statement Kpis Tabular Form Ppt PowerPoint Presentation Summary Infographic Template
This is a cash flow statement kpis tabular form ppt powerpoint presentation summary infographic template. This is a four stage process. The stages in this process are finance, analysis, business, investment, marketing.
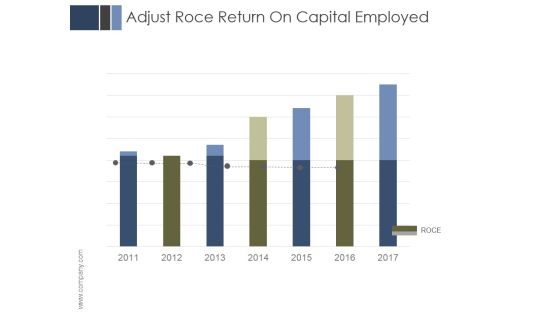
Adjust Roce Return On Capital Employed Ppt PowerPoint Presentation Infographic Template
This is a adjust roce return on capital employed ppt powerpoint presentation infographic template. This is a seven stage process. The stages in this process are business, marketing, refunding, planning, finance.
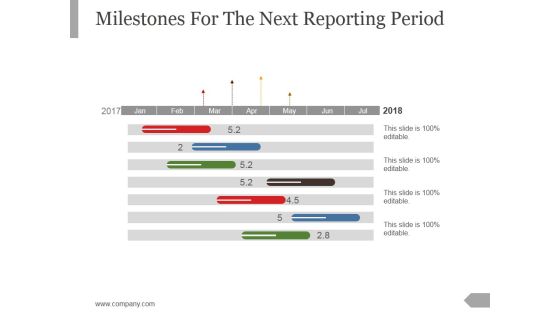
Milestones For The Next Reporting Period Template 1 Ppt PowerPoint Presentation Infographic Template
This is a milestones for the next reporting period template 1 ppt powerpoint presentation infographic template. This is a seven stage process. The stages in this process are business, marketing, management, timeline, planning.

Milestones Achieved Template 1 Ppt PowerPoint Presentation Infographic Template Design Inspiration
This is a milestones achieved template 1 ppt powerpoint presentation infographic template design inspiration. This is a three stage process. The stages in this process are business, location, achieved, management, planning.

What Do I Bring To The Table Ppt PowerPoint Presentation Infographic Template Examples
This is a what do i bring to the table ppt powerpoint presentation infographic template examples. This is a six stage process. The stages in this process are business, marketing, management, table, planning.

Mission And Vision In The Strategy Process Ppt PowerPoint Presentation Infographic Template Design Inspiration
This is a mission and vision in the strategy process ppt powerpoint presentation infographic template design inspiration. This is a six stage process. The stages in this process are goals, mission, value, vision, strategy, action plan.

Vision And Mission Template 2 Ppt PowerPoint Presentation Infographic Template Inspiration
This is a vision and mission template 2 ppt powerpoint presentation infographic template inspiration. This is a two stage process. The stages in this process are management, planning, success, business, strategy.
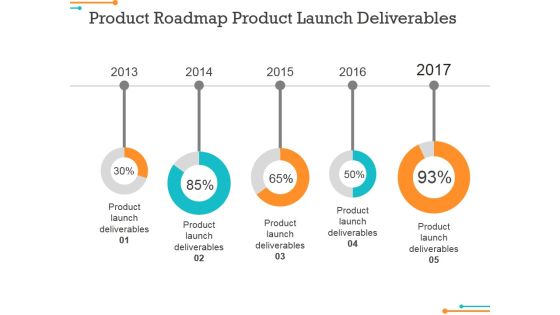
Product Roadmap Product Launch Deliverables Ppt PowerPoint Presentation Inspiration Infographic Template
This is a product roadmap product launch deliverables ppt powerpoint presentation inspiration infographic template. This is a five stage process. The stages in this process are product launch deliverables, roadmap, time planning, business.
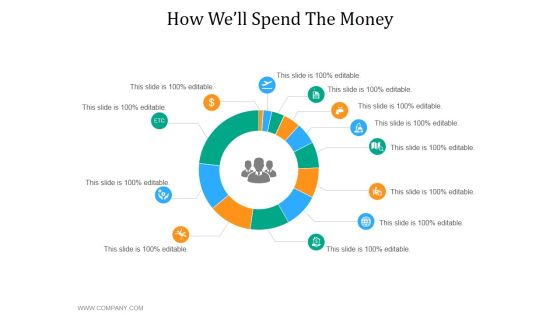
How Well Spend The Money Ppt PowerPoint Presentation Infographic Template Designs
This is a how well spend the money ppt powerpoint presentation infographic template designs. This is a twelve stage process. The stages in this process are business, marketing, process, planning, strategy.
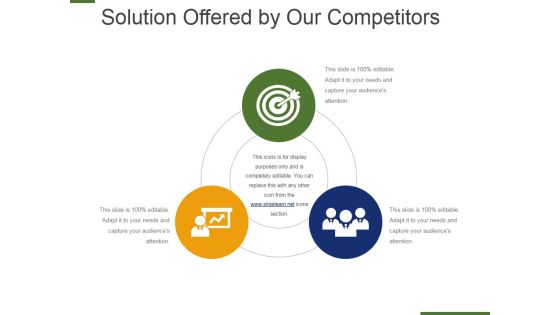
Solution Offered By Our Competitors Ppt PowerPoint Presentation Infographic Template Background Images
This is a solution offered by our competitors ppt powerpoint presentation infographic template background images. This is a three stage process. The stages in this planning, management, strategy, marketing, business.

Information Technology In A Supply Chain Analytical Applications Ppt PowerPoint Presentation Infographic Template Skills
This is a information technology in a supply chain analytical applications ppt powerpoint presentation infographic template skills. This is a three stage process. The stages in this process are strategic, planning, operational, supplier apps.
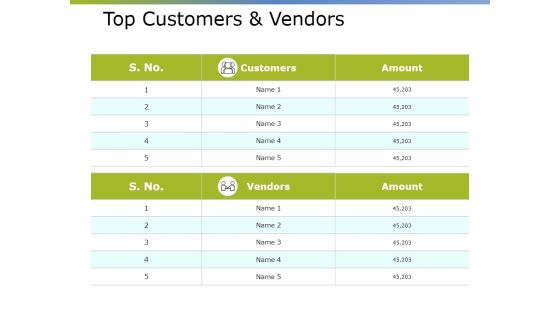
Top Customers And Vendors Ppt PowerPoint Presentation Infographic Template Example 2015
This is a top customers and vendors ppt powerpoint presentation infographic template example 2015. This is a two stage process. The stages in this process are business, marketing, strategy, planning, tables.

Sales Performance Dashboard Template 2 Ppt PowerPoint Presentation Infographic Template Clipart
This is a sales performance dashboard template 2 ppt powerpoint presentation infographic template clipart. This is a six stage process. The stages in this process are top sales reps, new customer, sales funnel, top selling plans, top opportunities.

Business Improvement Initiatives Circular Steps Ppt PowerPoint Presentation File Infographic Template
This is a business improvement initiatives circular steps ppt powerpoint presentation file infographic template. This is a five stage process. The stages in this process are operational excellence, operational plan, operational process.

Data Collection And Processing Ppt PowerPoint Presentation Infographic Template Graphics Pictures
This is a data collection and processing ppt powerpoint presentation infographic template graphics pictures. This is a four stage process. The stages in this process are data collection and processing, marketing, strategy, management, planning.
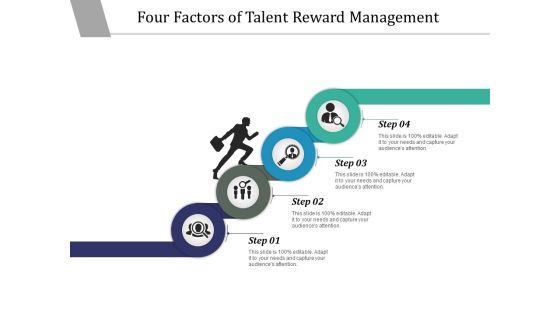
Four Factors Of Talent Reward Management Ppt PowerPoint Presentation Infographic Template Ideas
This is a four factors of talent reward management ppt powerpoint presentation infographic template ideas. This is a four stage process. The stages in this process are 4 step approach, 4 step process, 4 step plan.
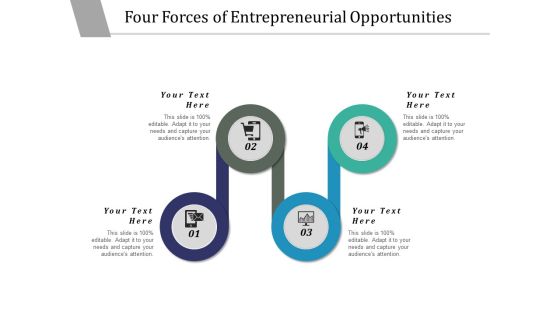
Four Forces Of Entrepreneurial Opportunities Ppt PowerPoint Presentation Infographic Template Background
This is a four forces of entrepreneurial opportunities ppt powerpoint presentation infographic template background. This is a four stage process. The stages in this process are 4 step approach, 4 step process, 4 step plan.

Business Model Canvas Value Propositions Ppt PowerPoint Presentation Infographic Template Objects
This is a business model canvas value propositions ppt powerpoint presentation infographic template objects. This is a five stage process. The stages in this process are strategy, business, marketing, planning, management.
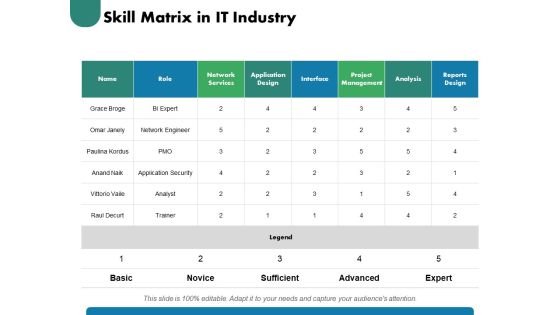
Skill Matrix In IT Industry Ppt PowerPoint Presentation Infographic Template Graphic Images
This is a skill matrix in it industry ppt powerpoint presentation infographic template graphic images. This is a six stage process. The stages in this process are table, marketing, business, management, planning, strategy.
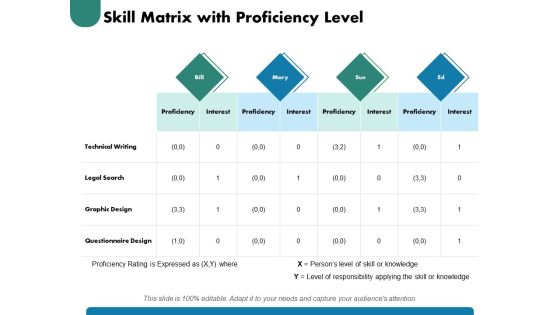
Skill Matrix With Proficiency Level Ppt PowerPoint Presentation Infographic Template Brochure
This is a skill matrix with proficiency level ppt powerpoint presentation infographic template brochure. This is a four stage process. The stages in this process are table, marketing, business, management, planning, strategy.

Cyber Security Seven Step Cyber Insurance Ppt PowerPoint Presentation Infographic Template Graphic Tips
This is a cyber security seven step cyber insurance ppt powerpoint presentation infographic template graphic tips. This is a seven stage process. The stages in this process are develop a plan, assess and measure, cyber insurance, mitigate risk, get started.

Use Case Corporate Debt Or Bond Ppt PowerPoint Presentation Infographic Template Microsoft
This is a use case corporate debt or bond ppt powerpoint presentation infographic template microsoft. This is a three stage process. The stages in this process are business, management, planning, strategy, marketing.

Business Infographic Timeline Goals Factors And Accountability Ppt PowerPoint Presentation Clipart
This is a business infographic timeline goals factors and accountability ppt powerpoint presentation clipart. This is a six stage process. The stages in this process are strategy plan, strategy objectives, strategy action.

Poka Yoke Rules Simpler Is Better Ppt PowerPoint Presentation Infographic Template Template
This is a poka yoke rules simpler is better ppt powerpoint presentation infographic template template. This is a five stage process. The stages in this process are simpler is better, planning, strategy, marketing, management.
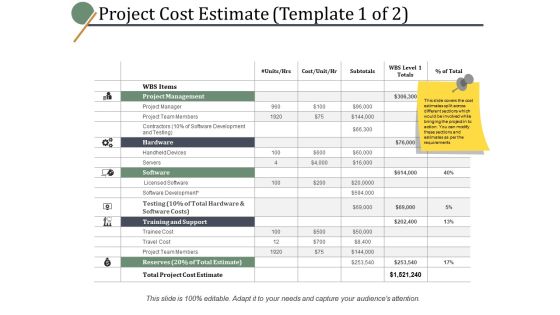
Project Cost Estimate Training And Support Ppt PowerPoint Presentation Infographic Template
This is a project cost estimate training and support ppt powerpoint presentation infographic template. This is a six stage process. The stages in this process are business, management, marketing, planning.
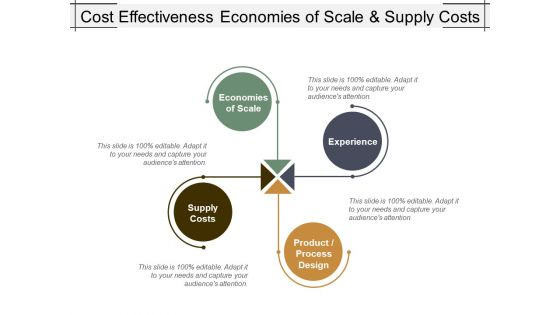
Cost Effectiveness Economies Of Scale And Supply Costs Ppt PowerPoint Presentation Infographic Template Format Ideas
This is a cost effectiveness economies of scale and supply costs ppt powerpoint presentation infographic template format ideas. This is a four stage process. The stages in this process are cost planning, cost efficiency, cost organization.
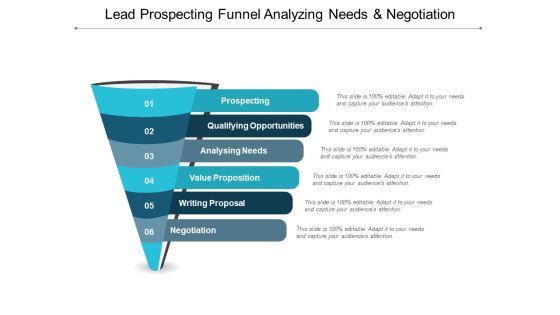
Lead Prospecting Funnel Analyzing Needs And Negotiation Ppt PowerPoint Presentation Infographic Template Microsoft
This is a Lead Prospecting Funnel Analyzing Needs And Negotiation Ppt Powerpoint Presentation Infographic Template Microsoft. This is a six stage process. The stages in this process are sales plan, sales prospecting, sales reps.
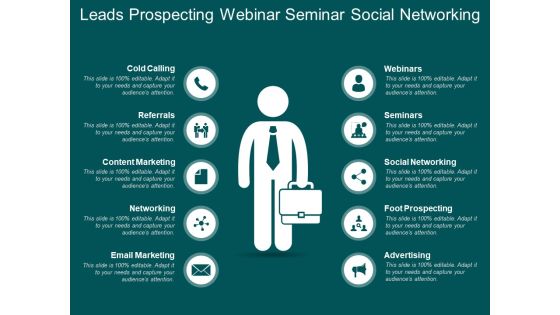
Leads Prospecting Webinar Seminar Social Networking Ppt PowerPoint Presentation Infographic Template Graphics Download
This is a Leads Prospecting Webinar Seminar Social Networking Ppt Powerpoint Presentation Infographic Template Graphics Download. This is a ten stage process. The stages in this process are sales plan, sales prospecting, sales reps.

Digital Capabilities Client Engagement People Innovation Ppt Powerpoint Presentation Infographic Template Background Image
This is a digital capabilities client engagement people innovation ppt powerpoint presentation infographic template background image. This is a four stage process. The stages in this process are digital strategy, digital plan, digital approach.

Business Goals And Results With Icons Ppt PowerPoint Presentation Infographic Template Mockup
This is a business goals and results with icons ppt powerpoint presentation infographic template mockup. This is a five stage process. The stages in this process are objective and benefit, goal and benefit, plan and benefit.

Business Goals And Results With Six Points Ppt PowerPoint Presentation Infographic Template Shapes
This is a business goals and results with six points ppt powerpoint presentation infographic template shapes. This is a six stage process. The stages in this process are objective and benefit, goal and benefit, plan and benefit.

Business Goals And Outcomes With Eight Points And Icons Ppt PowerPoint Presentation Infographic Template Brochure
This is a business goals and outcomes with eight points and icons ppt powerpoint presentation infographic template brochure. This is a eight stage process. The stages in this process are objective and benefit, goal and benefit, plan and benefit.
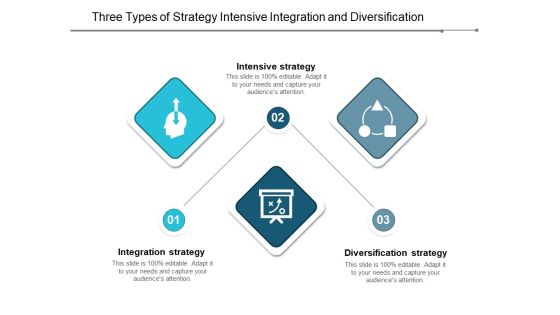
Three Types Of Strategy Intensive Integration And Diversification Ppt Powerpoint Presentation Infographic Template Layout Ideas
This is a three types of strategy intensive integration and diversification ppt powerpoint presentation infographic template layout ideas. This is a three stage process. The stages in this process are executive plan, executive strategy, executive approach.
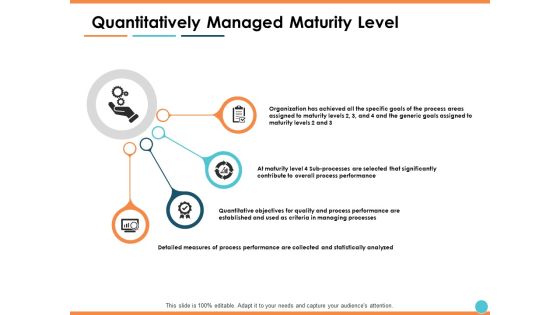
Quantitatively Managed Maturity Level Ppt PowerPoint Presentation Infographic Template Example Introduction
This is a quantitatively managed maturity level ppt powerpoint presentation infographic template example introduction. This is a four stage process. The stages in this process are business, planning, strategy, marketing, management.
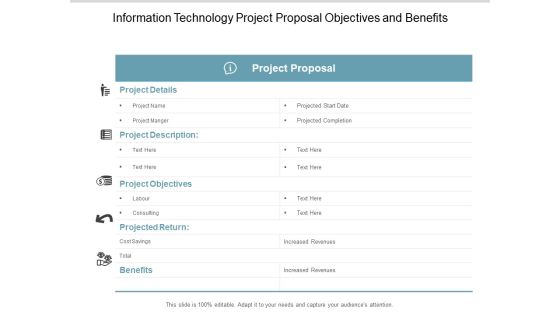
Information Technology Project Proposal Objectives And Benefits Ppt Powerpoint Presentation Infographic Template Layout
This is a information technology project proposal objectives and benefits ppt powerpoint presentation infographic template layout. This is a five stage process. The stages in this process are it solution proposal, it solution approach, it solution plan.

Tools And Techniques Of Inventory Management Ppt Powerpoint Presentation Infographic Template Information
This is a tools and techniques of inventory management ppt powerpoint presentation infographic template information. This is a four stage process. The stages in this process are business, management, planning, strategy, marketing.
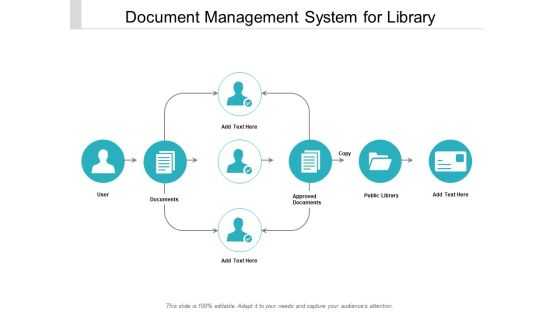
Document Management System For Library Ppt Powerpoint Presentation Infographic Template Vector
This is a document management system for library ppt powerpoint presentation infographic template vector. This is a six stage process. The stages in this process are planning process, approval process, developmental approval.

 Home
Home