6 Step Diagram

QA Modification For Product Quality Development And Consumer Satisfaction Circular Diagram Elements PDF
This is a qa modification for product quality development and consumer satisfaction circular diagram elements pdf template with various stages. Focus and dispense information on six stages using this creative set, that comes with editable features. It contains large content boxes to add your information on topics like circular diagram. You can also showcase facts, figures, and other relevant content using this PPT layout. Grab it now.
Overview Of An Effective Budget System Components And Strategies Circular Diagram Portrait PDF
This is a overview of an effective budget system components and strategies circular diagram portrait pdf template with various stages. Focus and dispense information on six stages using this creative set, that comes with editable features. It contains large content boxes to add your information on topics like circular diagram. You can also showcase facts, figures, and other relevant content using this PPT layout. Grab it now.
HR Software Solution Capital Funding Pitch Deck Circular Diagram Sample PDF
This is a hr software solution capital funding pitch deck circular diagram sample pdf template with various stages. Focus and dispense information on six stages using this creative set, that comes with editable features. It contains large content boxes to add your information on topics like circular diagram. You can also showcase facts, figures, and other relevant content using this PPT layout. Grab it now.

Patient Satisfaction Assessment To Address Service Quality In Healthcare Centre Circular Diagram Professional PDF
This is a patient satisfaction assessment to address service quality in healthcare centre circular diagram professional pdf template with various stages. Focus and dispense information on six stages using this creative set, that comes with editable features. It contains large content boxes to add your information on topics like circular diagram. You can also showcase facts, figures, and other relevant content using this PPT layout. Grab it now.
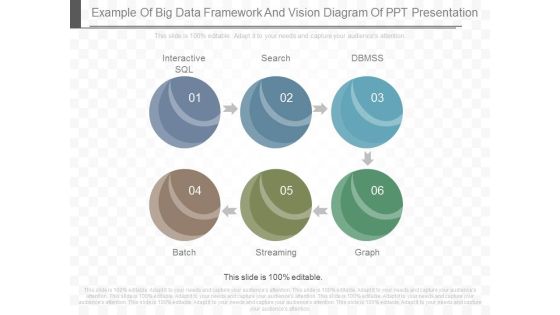
Example Of Big Data Framework And Vision Diagram Of Ppt Presentation
This is a example of big data framework and vision diagram of ppt presentation. This is a six stage process. The stages in this process are interactive sql, search, dbmss, batch, streaming, graph.

Conversion Rate Optimization Process For Online Business Sample Diagram Presentation Pictures
This is a conversion rate optimization process for online business sample diagram presentation pictures. This is a six stage process. The stages in this process are awareness, total visitors, placing item in cart, interest, desire, purchasing items.
Developing New Trade Name Idea Linear Diagram Ppt Icon Graphics Example PDF
This is a developing new trade name idea linear diagram ppt icon graphics example pdf template with various stages. Focus and dispense information on six stages using this creative set, that comes with editable features. It contains large content boxes to add your information on topics like linear diagram. You can also showcase facts, figures, and other relevant content using this PPT layout. Grab it now.

Agile Development Cycle Diagram Ppt PowerPoint Presentation Icon Graphics Cpb Pdf
Presenting this set of slides with name agile development cycle diagram ppt powerpoint presentation icon graphics cpb pdf. This is an editable Powerpoint six stages graphic that deals with topics like agile development cycle diagram to help convey your message better graphically. This product is a premium product available for immediate download and is 100 percent editable in Powerpoint. Download this now and use it in your presentations to impress your audience.
Idea Sharing Diagram For Discrete Probability Distributions Ppt PowerPoint Presentation Icon Outline PDF
Persuade your audience using this idea sharing diagram for discrete probability distributions ppt powerpoint presentation icon outline pdf. This PPT design covers six stages, thus making it a great tool to use. It also caters to a variety of topics including idea sharing diagram for discrete probability distributions. Download this PPT design now to present a convincing pitch that not only emphasizes the topic but also showcases your presentation skills.

AIM Principles For Data Storage Circular Diagram Ppt Pictures Inspiration PDF
This is a aim principles for data storage circular diagram ppt pictures inspiration pdf template with various stages. Focus and dispense information on six stages using this creative set, that comes with editable features. It contains large content boxes to add your information on topics like circular diagram. You can also showcase facts, figures, and other relevant content using this PPT layout. Grab it now.

Cause And Effect For Business Problem Solution Circular Diagram Structure PDF
This is a cause and effect for business problem solution circular diagram structure pdf template with various stages. Focus and dispense information on six stages using this creative set, that comes with editable features. It contains large content boxes to add your information on topics like circular diagram. You can also showcase facts, figures, and other relevant content using this PPT layout. Grab it now.

Multi Channel Online Commerce Circular Diagram For Mobile Marketing Professional PDF
This is a multi channel online commerce circular diagram for mobile marketing professional pdf template with various stages. Focus and dispense information on six stages using this creative set, that comes with editable features. It contains large content boxes to add your information on topics like circular diagram. You can also showcase facts, figures, and other relevant content using this PPT layout. Grab it now.
Linear Arrow Roadmap Diagram For Mobile Application Cost Breakdown Ppt PowerPoint Presentation Gallery Graphics Example PDF
Persuade your audience using this linear arrow roadmap diagram for mobile application cost breakdown ppt powerpoint presentation gallery graphics example pdf This PPT design covers six stages, thus making it a great tool to use. It also caters to a variety of topics including linear arrow roadmap diagram for mobile application cost breakdown. Download this PPT design now to present a convincing pitch that not only emphasizes the topic but also showcases your presentation skills.

Half Yearly Marketing Scheme Diagram For Electric Meter Accuracy Ppt PowerPoint Presentation Gallery Maker PDF
Persuade your audience using this half yearly marketing scheme diagram for electric meter accuracy ppt powerpoint presentation gallery maker pdf. This PPT design covers six stages, thus making it a great tool to use. It also caters to a variety of topics including half yearly marketing scheme diagram for electric meter accuracy. Download this PPT design now to present a convincing pitch that not only emphasizes the topic but also showcases your presentation skills.
Six Sections Circle For SCM Process With Icons Ppt PowerPoint Presentation Diagram Templates PDF
Persuade your audience using this six sections circle for scm process with icons ppt powerpoint presentation diagram templates pdf. This PPT design covers six stages, thus making it a great tool to use. It also caters to a variety of topics including plan, source, execute. Download this PPT design now to present a convincing pitch that not only emphasizes the topic but also showcases your presentation skills.
Implementing Human Resources HR Best Practices Strategy Circular Diagram Ppt File Icon PDF
Presenting this set of slides with name implementing human resources hr best practices strategy circular diagram ppt file icon pdf. This is a six stage process. The stages in this process is circular. This is a completely editable PowerPoint presentation and is available for immediate download. Download now and impress your audience.
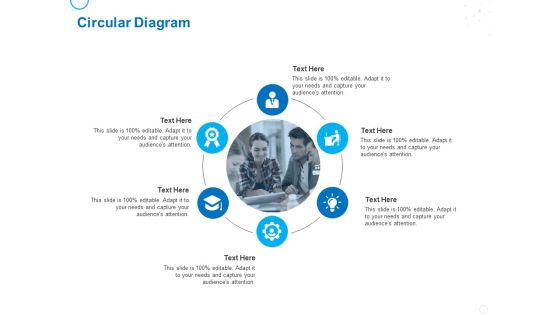
Service Strategy And Service Lifecycle Implementation Circular Diagram Ppt Infographic Template Templates PDF
Presenting this set of slides with name service strategy and service lifecycle implementation circular diagram ppt infographic template templates pdf. This is a six stage process. The stages in this process are circular process. This is a completely editable PowerPoint presentation and is available for immediate download. Download now and impress your audience.
How To Strengthen Relationships With Clients And Partners Circular Process Ppt Diagram Lists PDF
Presenting this set of slides with name how to strengthen relationships with clients and partners circular process ppt diagram lists pdf. This is a six stage process. The stages in this process are circular process. This is a completely editable PowerPoint presentation and is available for immediate download. Download now and impress your audience.

CRM For Real Estate Marketing Circular Diagram Ppt PowerPoint Presentation Summary Inspiration PDF
Presenting this set of slides with name crm for real estate marketing circular diagram ppt powerpoint presentation summary inspiration pdf. This is a six stage process. The stages in this process are circular process. This is a completely editable PowerPoint presentation and is available for immediate download. Download now and impress your audience.
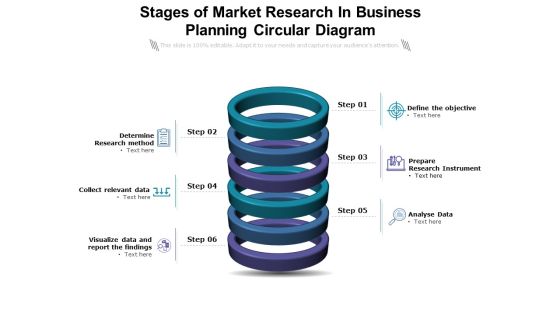
Stages Of Market Research In Business Planning Circular Diagram Ppt PowerPoint Presentation Styles Gridlines PDF
Presenting this set of slides with name stages of market research in business planning circular diagram ppt powerpoint presentation styles gridlines pdf. This is a six stage process. The stages in this process are determine research method, collect relevant data, visualize data and report the findings, define the objective, prepare research instrument, analyse data. This is a completely editable PowerPoint presentation and is available for immediate download. Download now and impress your audience.

Entity Relationship Diagram For Banking System Ppt Layouts Design Templates PDF
This slide showcases entity relationship diagram for banking systems which helps evaluate relationship of bank management with its database. It provides information regarding customers, employees, reports, transactions, logs and accounts. Presenting Entity Relationship Diagram For Banking System Ppt Layouts Design Templates PDF to dispense important information. This template comprises six stages. It also presents valuable insights into the topics including Customer, Employees, Reports, Accounts, Logs, Transactions. This is a completely customizable PowerPoint theme that can be put to use immediately. So, download it and address the topic impactfully.
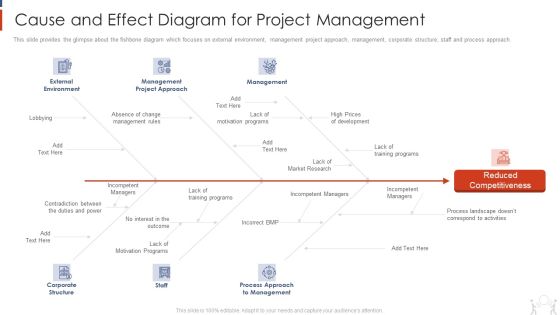
Project Management Modelling Techniques IT Cause And Effect Diagram For Project Management Information PDF
This slide provides the glimpse about the fishbone diagram which focuses on external environment, management project approach, management, corporate structure, staff and process approach. This is a project management modelling techniques it cause and effect diagram for project management information pdf template with various stages. Focus and dispense information on six stages using this creative set, that comes with editable features. It contains large content boxes to add your information on topics like external environment, management project approach, management, corporate structure, staff. You can also showcase facts, figures, and other relevant content using this PPT layout. Grab it now.
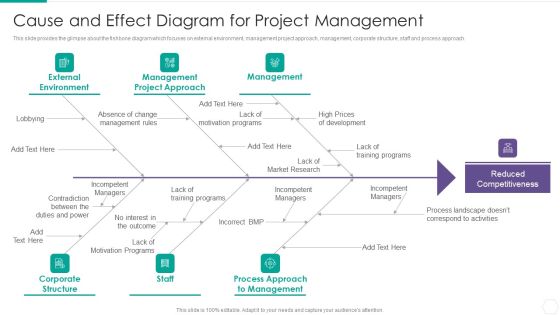
Quantitative Risk Assessment Cause And Effect Diagram For Project Management Rules PDF
This slide provides the glimpse about the fishbone diagram which focuses on external environment, management project approach, management, corporate structure, staff and process approach. This is a Quantitative Risk Assessment Cause And Effect Diagram For Project Management Rules PDF template with various stages. Focus and dispense information on six stages using this creative set, that comes with editable features. It contains large content boxes to add your information on topics like Management, External Environment, Corporate Structure, Market. You can also showcase facts, figures, and other relevant content using this PPT layout. Grab it now.

Challenges Involved In Parent Company With Monopoly Ppt PowerPoint Presentation Diagram Ppt
Presenting this set of slides with name challenges involved in parent company with monopoly ppt powerpoint presentation diagram ppt. This is a six stage process. The stages in this process are holding company, business plan, investment company. This is a completely editable PowerPoint presentation and is available for immediate download. Download now and impress your audience.

Agenda Enhancing Buyer Journey Ppt PowerPoint Presentation Diagram Graph Charts PDF
If you are looking for a format to display your unique thoughts, then the professionally designed Agenda Enhancing Buyer Journey Ppt PowerPoint Presentation Diagram Graph Charts PDF is the one for you. You can use it as a Google Slides template or a PowerPoint template. Incorporate impressive visuals, symbols, images, and other charts. Modify or reorganize the text boxes as you desire. Experiment with shade schemes and font pairings. Alter, share or cooperate with other people on your work. Download Agenda Enhancing Buyer Journey Ppt PowerPoint Presentation Diagram Graph Charts PDF and find out how to give a successful presentation. Present a perfect display to your team and make your presentation unforgettable.

E Commerce Ideas For Social Media Paid And Non Paid Campaign Diagram Ppt Images
This is a e commerce ideas for social media paid and non paid campaign diagram ppt images. This is a six stage process. The stages in this process are visual marketing, engage business with your social presence, host regularly updated awesome content, encourage consumers to share on social media, ease your wallet, crowdfund your ecommerce business.
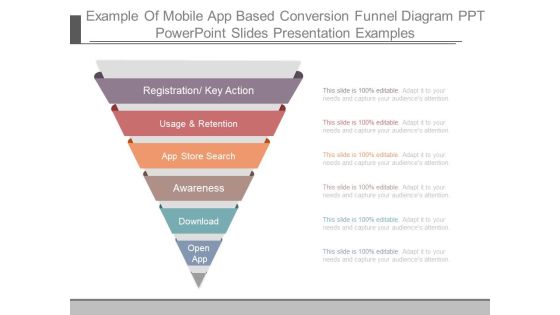
Example Of Mobile App Based Conversion Funnel Diagram Ppt Powerpoint Slides Presentation Examples
This is a example of mobile app based conversion funnel diagram ppt powerpoint slides presentation examples. This is a six stage process. The stages in this process are open app, download, awareness, app store search, usage and retention, registration key action.

Economic Capital And Solvency Compliance And Reporting Diagram Presentation Background Images
This is a economic capital and solvency compliance and reporting diagram presentation background images. This is a six stage process. The stages in this process are confidence level, standard report templates, expected loss, algo financial modeler, standard formula model, economic capital.

Agenda For Big Data Analytics Ppt PowerPoint Presentation Diagram Lists PDF
Presenting Agenda For Big Data Analytics Ppt PowerPoint Presentation Diagram Lists PDF to provide visual cues and insights. Share and navigate important information on six stages that need your due attention. This template can be used to pitch topics like Data Management, Technologies, Business. In addtion, this PPT design contains high resolution images, graphics, etc, that are easily editable and available for immediate download.

Understanding The Kubernetes Components Through Diagram Kubernetes 7 Use Cases Ppt File Ideas PDF
Presenting this set of slides with name understanding the kubernetes components through diagram kubernetes 7 use cases ppt file ideas pdf. This is a six stage process. The stages in this process are microservices, lift and shift, cloud native network functions, machine learning, heavy computing, simple. This is a completely editable PowerPoint presentation and is available for immediate download. Download now and impress your audience.

The Fishbone Analysis Tool Why Use Cause And Effect Diagram Mockup PDF
This is a the fishbone analysis tool why use cause and effect diagram mockup pdf template with various stages. Focus and dispense information on six stages using this creative set, that comes with editable features. It contains large content boxes to add your information on topics like communicate issues, encourages critical thinking, team members, facilitates system thinking, listing multiple causes. You can also showcase facts, figures, and other relevant content using this PPT layout. Grab it now.

Understanding The Kubernetes Components Through Diagram Table Of Contents Ppt Ideas Graphic Images
Presenting this set of slides with name understanding the kubernetes components through diagram table of contents ppt ideas graphic images. This is a six stage process. The stages in this process are introduction kubernetes, kubernetes component, nodes kubernetes, kubernetes development process, networking kubernetes, security measures kubernetes. This is a completely editable PowerPoint presentation and is available for immediate download. Download now and impress your audience.
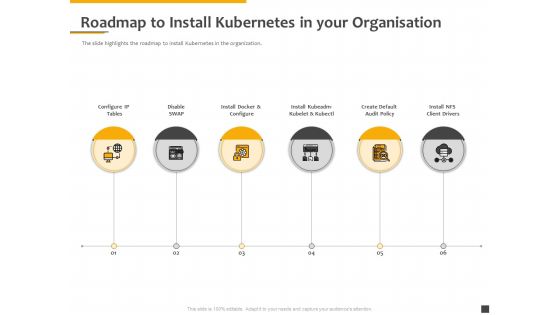
Understanding The Kubernetes Components Through Diagram Roadmap To Install Kubernetes In Your Organisation Background PDF
Presenting this set of slides with name understanding the kubernetes components through diagram roadmap to install kubernetes in your organisation background pdf. This is a six stage process. The stages in this process are configure ip tables, disable swap, install docker and configure, install kubeadm, kubelet and kubectl, create default, audit policy, install nfs, client drivers. This is a completely editable PowerPoint presentation and is available for immediate download. Download now and impress your audience.

Compare Intent B2B Marketing Pricing Ppt PowerPoint Presentation Diagram Graph Charts Cpb
Presenting this set of slides with name compare intent b2b marketing pricing ppt powerpoint presentation diagram graph charts cpb. This is an editable Powerpoint six stages graphic that deals with topics like compare intent b2b marketing pricing to help convey your message better graphically. This product is a premium product available for immediate download and is 100 percent editable in Powerpoint. Download this now and use it in your presentations to impress your audience.

Cost Acquiring Customers Ppt PowerPoint Presentation Diagram Graph Charts Cpb Pdf
Presenting this set of slides with name cost acquiring customers ppt powerpoint presentation diagram graph charts cpb pdf. This is an editable Powerpoint six stages graphic that deals with topics like cost acquiring customers to help convey your message better graphically. This product is a premium product available for immediate download and is 100 percent editable in Powerpoint. Download this now and use it in your presentations to impress your audience.
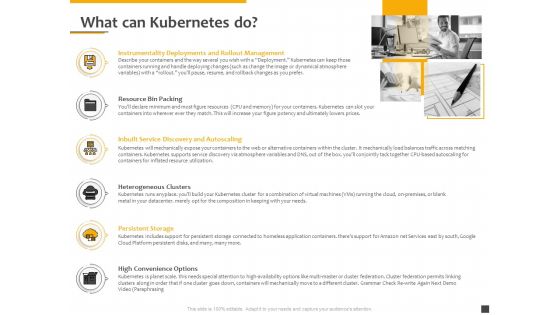
Understanding The Kubernetes Components Through Diagram What Can Kubernetes Do Ppt Gallery Information PDF
Presenting this set of slides with name understanding the kubernetes components through diagram what can kubernetes do ppt gallery information pdf. This is a six stage process. The stages in this process are instrumentality deployments and rollout management, resource bin packing, inbuilt service discovery and autoscaling, heterogeneous clusters, persistent storage, high convenience options. This is a completely editable PowerPoint presentation and is available for immediate download. Download now and impress your audience.

Cause And Effect For Business Problem Solution Why Use Cause And Effect Diagram Brochure PDF
This is a cause and effect for business problem solution why use cause and effect diagram brochure pdf template with various stages. Focus and dispense information on six stages using this creative set, that comes with editable features. It contains large content boxes to add your information on topics like communicate, facilitates. You can also showcase facts, figures, and other relevant content using this PPT layout. Grab it now.
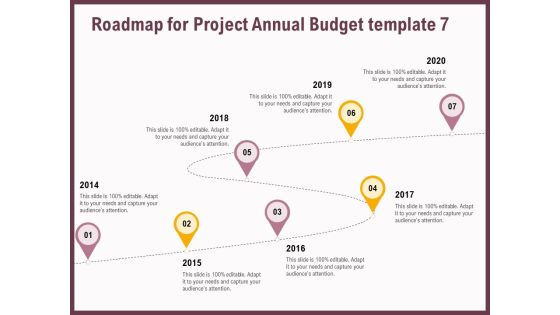
Elements Roadmap For Project Annual Budget 2014 To 2020 Ppt Diagram Templates PDF
This is a elements roadmap for project annual budget 2014 to 2020 ppt diagram templates pdf template with various stages. Focus and dispense information on six stages using this creative set, that comes with editable features. It contains large content boxes to add your information on topics like roadmap, 2014 to 2020. You can also showcase facts, figures, and other relevant content using this PPT layout. Grab it now.
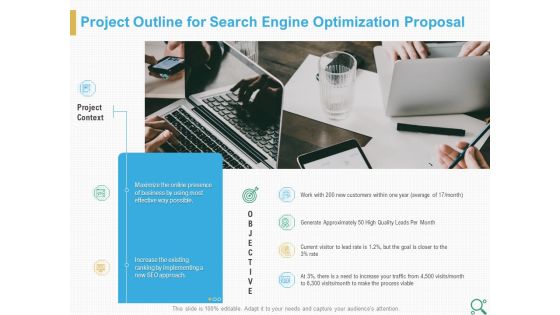
Project Outline For Search Engine Optimization Proposal Ppt Diagram Images PDF
This is a project outline for search engine optimization proposal ppt diagram images pdf template with various stages. Focus and dispense information on six stages using this creative set, that comes with editable features. It contains large content boxes to add your information on topics like project outline. You can also showcase facts, figures, and other relevant content using this PPT layout. Grab it now.

Benefits Of Big Data Management For Business Ppt PowerPoint Presentation Diagram Templates PDF
This is a Benefits Of Big Data Management For Business Ppt PowerPoint Presentation Diagram Templates PDF template with various stages. Focus and dispense information on six stages using this creative set, that comes with editable features. It contains large content boxes to add your information on topics like Business Costs, Revenue, Organizations. You can also showcase facts, figures, and other relevant content using this PPT layout. Grab it now.

Payment Value Chain For Digital Money Ppt PowerPoint Presentation Diagram Images PDF
This slide defines the value chain used for making payment by electronic money. It includes information related to consumer, merchant, acquirer, payment network, issuer, etc.Presenting Payment Value Chain For Digital Money Ppt PowerPoint Presentation Diagram Images PDF to dispense important information. This template comprises six stages. It also presents valuable insights into the topics including Services Merchant, Services Merchant, Handles Communication. This is a completely customizable PowerPoint theme that can be put to use immediately. So, download it and address the topic impactfully.
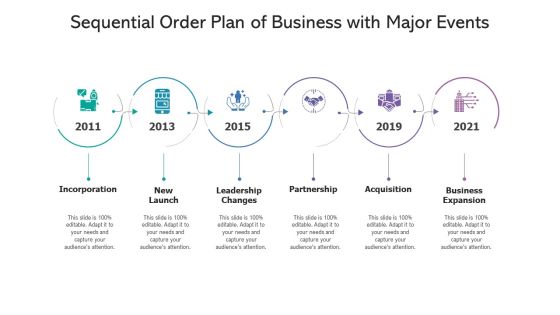
Sequential Order Plan Of Business With Major Events Ppt PowerPoint Presentation Diagram Templates PDF
Persuade your audience using this sequential order plan of business with major events ppt powerpoint presentation diagram templates pdf. This PPT design covers six stages, thus making it a great tool to use. It also caters to a variety of topics including acquisition, business, incorporation. Download this PPT design now to present a convincing pitch that not only emphasizes the topic but also showcases your presentation skills.
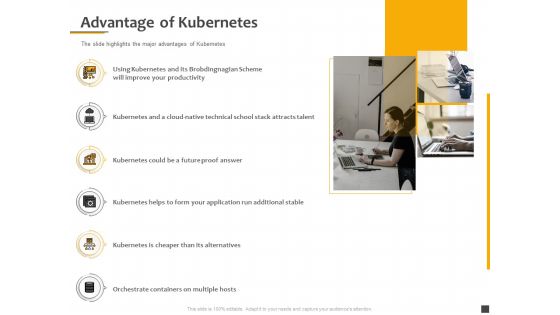
Understanding The Kubernetes Components Through Diagram Advantage Of Kubernetes Ppt Layouts Example PDF
Presenting this set of slides with name understanding the kubernetes components through diagram advantage of kubernetes ppt layouts example pdf. This is a six stage process. The stages in this process are using kubernetes brobdingnagian scheme improve your productivity, kubernetes and cloud native technical school stack attracts talent, kubernetes could future proof answer, kubernetes helps application run additional stable, kubernetes cheaper alternatives, orchestrate containers on multiple hosts. This is a completely editable PowerPoint presentation and is available for immediate download. Download now and impress your audience.

API Outline Multiple Components Of API Feature Ppt Diagram Templates PDF
Described below are the multiple component and or features sets of API Management including API design, deployment, security, analytics and monetization. This is a api outline multiple components of api feature ppt diagram templates pdf template with various stages. Focus and dispense information on six stages using this creative set, that comes with editable features. It contains large content boxes to add your information on topics like design, build, deploy, govern, expose. You can also showcase facts, figures, and other relevant content using this PPT layout. Grab it now.

Business Plan Methods Tools And Templates Set 2 PESTEL Analysis Diverging Radial Diagram Summary PDF
This slide displays PESTEL analysis used by organization as a strategic management tool to identify and analyze the impact of external factors on its business. External factors included in this slide are political, economic, social. Technological, environmental and legal. This is a business plan methods tools and templates set 2 pestel analysis diverging radial diagram summary pdf template with various stages. Focus and dispense information on six stages using this creative set, that comes with editable features. It contains large content boxes to add your information on topics like legal, environment, technology, social, economic, political. You can also showcase facts, figures, and other relevant content using this PPT layout. Grab it now.
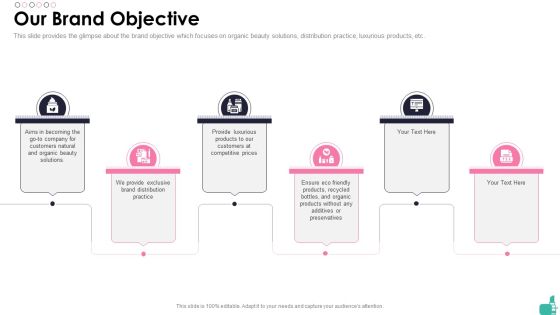
Investor Funding Elevator Pitch Deck For Beauty Merchandise Our Brand Objective Ppt Diagram Ppt PDF
This slide provides the glimpse about the brand objective which focuses on organic beauty solutions, distribution practice, luxurious products, etc. Presenting investor funding elevator pitch deck for beauty merchandise our brand objective ppt diagram ppt pdf to provide visual cues and insights. Share and navigate important information on six stages that need your due attention. This template can be used to pitch topics like competitive prices, organic products, additives or preservatives. In addtion, this PPT design contains high resolution images, graphics, etc, that are easily editable and available for immediate download.
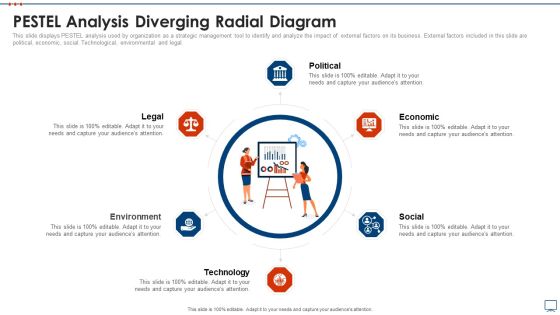
Strategic Business Plan Effective Tools PESTEL Analysis Diverging Radial Diagram Rules PDF
This slide displays PESTEL analysis used by organization as a strategic management tool to identify and analyze the impact of external factors on its business. External factors included in this slide are political, economic, social. Technological, environmental and legal. Presenting strategic business plan effective tools pestel analysis diverging radial diagram rules pdf to provide visual cues and insights. Share and navigate important information on six stages that need your due attention. This template can be used to pitch topics like political, economic, social, technology, environment, legal. In addtion, this PPT design contains high resolution images, graphics, etc, that are easily editable and available for immediate download.

Workforce Motivation Strategies To Optimize Staff Productivity Ppt PowerPoint Presentation Diagram Templates PDF
This slide provides information regarding workforce motivation initiatives to enhance staff productivity. Key initiatives include role conflicts management, handling overall communication, managing dynamic project environments, etc. Slidegeeks has constructed Workforce Motivation Strategies To Optimize Staff Productivity Ppt PowerPoint Presentation Diagram Templates PDF after conducting extensive research and examination. These presentation templates are constantly being generated and modified based on user preferences and critiques from editors. Here, you will find the most attractive templates for a range of purposes while taking into account ratings and remarks from users regarding the content. This is an excellent jumping off point to explore our content and will give new users an insight into our top notch PowerPoint Templates.

Strategies To Tackle Operational Risk In Banking Institutions Circular Diagram Pictures PDF
Presenting strategies to tackle in banking institutions need for operational risk management framework portrait pdf to provide visual cues and insights. Share and navigate important information on six stages that need your due attention. This template can be used to pitch topics like circular diagram. In addtion, this PPT design contains high resolution images, graphics, etc, that are easily editable and available for immediate download.
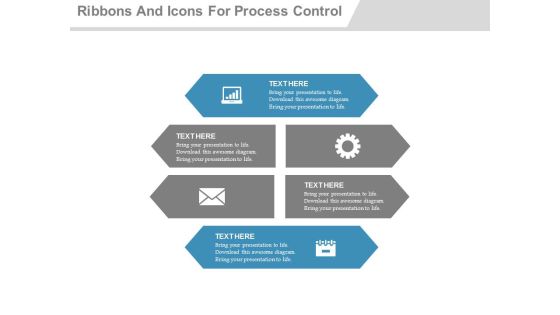
Six Steps For Total Productive Maintenance Powerpoint Template
Our above business diagram has been designed with six text tags with icons. This PPT slide may be used to present concept of total productive maintenance. Use this business diagram to present your work in a more smart and precise manner.
Six Lego Steps With Business Icons Powerpoint Slides
Download this exclusive business diagram to present business strategy. This PPT slide contains the six Lego steps with business icons. Download this business slide for business management related topics.
Sequential Growth Five Arrow Steps And Icons Powerpoint Template
Our above business diagram has been designed with sequential growth steps arrow chart. This slide is suitable to present success strategy. This template offers an excellent background to build impressive presentation.
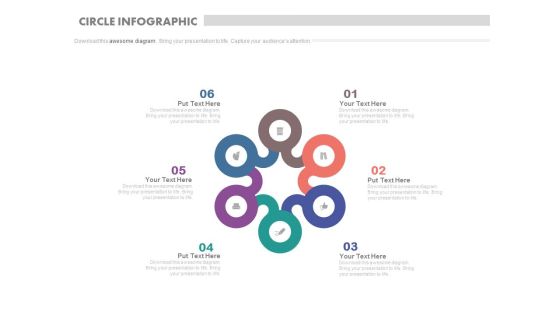
Six Steps Circle Infographics For Process Flow Powerpoint Slides
This business slide contains circular infographic design. This diagram provides schematic representation of any information. Visual effect this slide helps in maintaining the flow of the discussion and provides more clarity to the subject.

Six Steps Circular Chart For Workflow Powerpoint Slides
This business slide contains circular infographic design. This diagram provides schematic representation of any information. Visual effect this slide helps in maintaining the flow of the discussion and provides more clarity to the subject.

Six Steps Circular Puzzle Timeline Chart Powerpoint Slides
This business slide contains circular infographic design. This diagram provides schematic representation of any information. Visual effect this slide helps in maintaining the flow of the discussion and provides more clarity to the subject.

Bulb With Brain And Six Steps Powerpoint Slides
Graphic of brain with bulb and icons have been displayed in this PowerPoint slide. This PowerPoint diagram helps to exhibit creative ideas and thinking process. Use this PowerPoint template to build an exclusive presentation.

Circular Alphabetic Steps For Educational Strategy Powerpoint Slides
This business slide contains circular infographic design. This diagram provides schematic representation of any information. Visual effect this slide helps in maintaining the flow of the discussion and provides more clarity to the subject.

Six Stage Circular Arrow Diagram For Business Flow Ppt PowerPoint Presentation Example
This is a six stage circular arrow diagram for business flow ppt powerpoint presentation example. This is a six stage process. The stages in this process are skill, process, circle, icon, flow.

Six Stage Circular Diagram For Business Process Management Ppt PowerPoint Presentation Template
This is a six stage circular diagram for business process management ppt powerpoint presentation template. This is a six stage process. The stages in this process are icon, loop, circle, process, flow.

Big Data Life Cycle Impacts Circular Diagram Ppt PowerPoint Presentation Introduction
This is a big data life cycle impacts circular diagram ppt powerpoint presentation introduction. This is a six stage process. The stages in this process are sports predictions, easier commutes, smartphones, personalized advertising, presidential campaigns, advanced healthcare.

 Home
Home