5
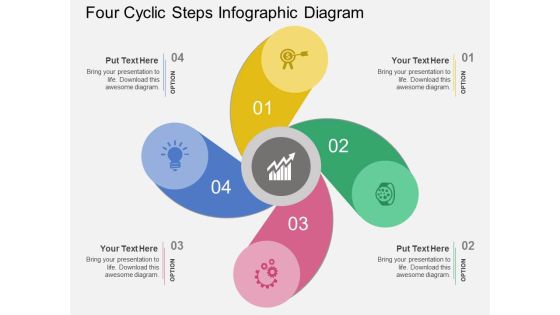
Four Cyclic Steps Infographic Diagram Powerpoint Template
The above PPT template displays infographic of four cyclic steps. This diagram helps to display business process steps. Adjust the above diagram in your business presentations to visually support your content.

Three Steps Infographic Diagram Powerpoint Template
The above PPT template displays infographic of three steps. This diagram helps to display business process steps. Adjust the above diagram in your business presentations to visually support your content.
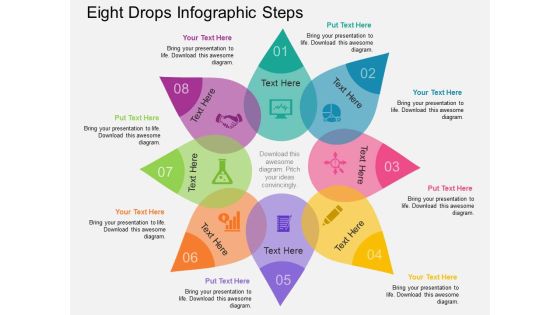
Eight Drops Infographic Steps Powerpoint Template
Drops Infographic steps have been used to design this business slide. This diagram may be used to exhibit business processes and planning. Download this diagram slide to make impressive presentations.

Business Infographic For Process Flow Powerpoint Template
Business infographic diagram has been displayed in this PPT slide. This business diagram helps to exhibit process steps in visual manner. Download this PowerPoint template to build an exclusive presentation.

Sample Sales Cycle Flow Chart Ppt Infographics
This is a sample sales cycle flow chart ppt infographics. This is a seven stage process. The stages in this process are fix it, feedback, ask customers, assess progress, set the improved product, make changes, improve it.
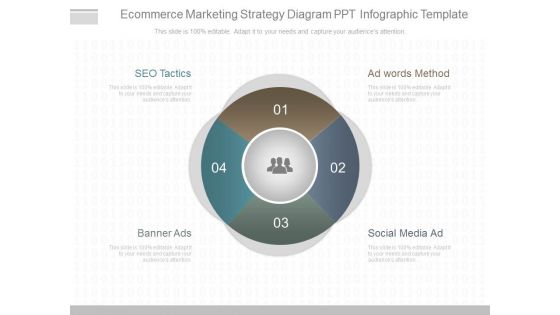
Ecommerce Marketing Strategy Diagram Ppt Infographic Template
This is a ecommerce marketing strategy diagram ppt infographic template. This is a four stage process. The stages in this process are ad words method, social media ad, banner ads, seo tactics.

Strategy And Planning Ppt Infographic Template
This is a strategy and planning ppt infographic template. This is a two stage process. The stages in this process are strategy and planning, marketing planning, demand generation, brand management.

Business Core Values Diagram Ppt Infographics
This is a business core values diagram ppt infographics. This is a six stage process. The stages in this process are execution, customer orientation, integrity, commitment, innovation, excellence, core value.

Integrated Quality Management System Diagram Infographics
This is a integrated quality management system diagram infographics. This is a six stage process. The stages in this process are integrated qm system, corporate legislation, local legislation, regulatory requirement, iso requirement, customer legislation, market legislation.

Technology Change Management Ppt Infographic Template
This is a technology change management ppt infographic template. This is a four stage process. The stages in this process are sla review, operation review, release reading review, change initiation review, optimizing, supporting, operating, changing.
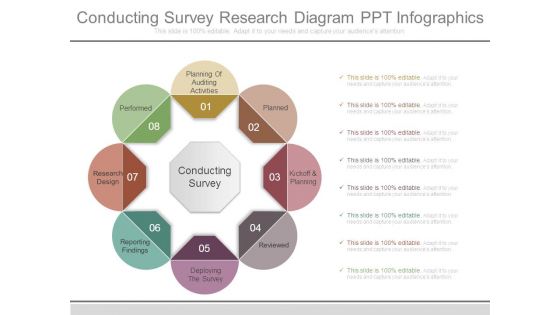
Conducting Survey Research Diagram Ppt Infographics
This is a conducting survey research diagram ppt infographics. This is a eight stage process. The stages in this process are planned, kickoff and planning, reviewed, deploying the survey, reporting findings, research design, performed, planning of auditing activities, conducting survey.
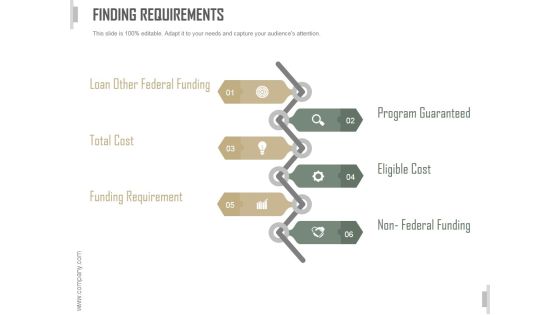
Finding Requirements Ppt PowerPoint Presentation Infographic Template
This is a finding requirements ppt powerpoint presentation infographic template. This is a six stage process. The stages in this process are loan other federal funding, total cost, funding requirement, program guaranteed , eligible cost, non federal funding.
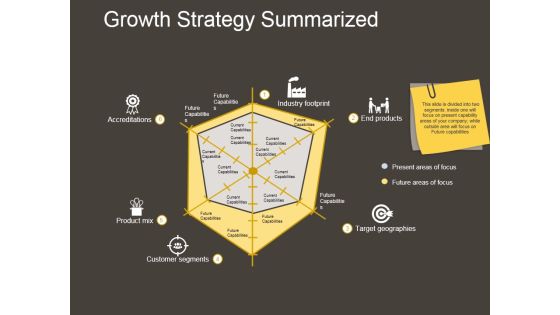
Growth Strategy Summarized Ppt PowerPoint Presentation Infographics
This is a growth strategy summarized ppt powerpoint presentation infographics. This is a six stage process. The stages in this process are accreditations, product mix, customer segments, target geographies, end products, industry footprint.

Scheduling Ppt PowerPoint Presentation Infographics Slides
This is a scheduling ppt powerpoint presentation infographics slides. This is a six stage process. The stages in this process are jan, feb, mar, apr, may, jun, our core values.

Service Development Ppt PowerPoint Presentation Infographics Visuals
This is a service development ppt powerpoint presentation infographics visuals. This is a three stage process. The stages in this process are brainstorm concepts, prioritize insight, hypothesis, experiment, clear need.

Financial Measures Ppt PowerPoint Presentation Model Infographics
This is a financial measures ppt powerpoint presentation model infographics. This is a seven stage process. The stages in this process are cost of raw material, revenue from goods sold, inventory holding cost, transportation cost, cost of expired perishable goods.

Tqm Principles Ppt PowerPoint Presentation Model Infographics
This is a tqm principles ppt powerpoint presentation model infographics. This is a eight stage process. The stages in this process are supplier relationship, decision making, continual improvement, strategic approach, process approach.

Revenue Streams Ppt PowerPoint Presentation Infographics Layout
This is a revenue streams ppt powerpoint presentation infographics layout. This is a four stage process. The stages in this process are partner commission, supplier commission, selling in house products, indirect sources such as advertising, affiliates etc.
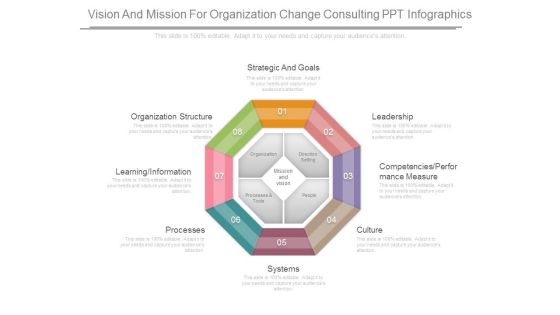
Vision And Mission For Organization Change Consulting Ppt Infographics
This is a vision and mission for organization change consulting ppt infographics. This is a eight stage process. The stages in this process are strategic and goals, leadership , culture , systems , processes , organization, structure , organization, direction setting.

Growth Strategy For Market Expansion Ppt Infographic Template
This is a growth strategy for market expansion ppt infographic template. This is a six stage process. The stages in this process are synchronistic strategies, new ways to sell, customer centric culture, websites that work, innovative design and media, branding to led.

Strategy Structure System Infographic Ppt PowerPoint Presentation Portfolio Inspiration
Presenting this set of slides with name strategy structure system infographic ppt powerpoint presentation portfolio inspiration. This is a six stage process. The stages in this process are strategy, structure, mckinsey seven s modal. This is a completely editable PowerPoint presentation and is available for immediate download. Download now and impress your audience.

Mobile Phone Track Ppt Infographic Template
This is a mobile phone track ppt infographic template. This is a eight stage process. The stages in this process are mobile phone track, record all calls, read all text message, secret microscope activation, view picture and video, view call logs, read emails, gps tracking.
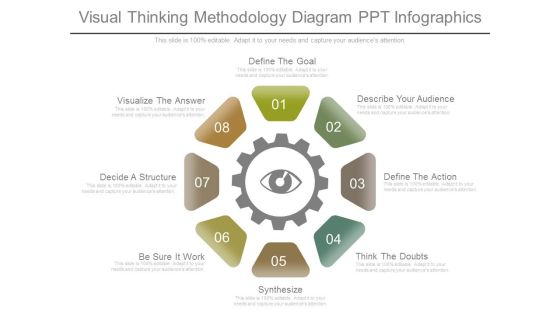
Visual Thinking Methodology Diagram Ppt Infographics
This is a visual thinking methodology diagram ppt infographics. This is a eight stage process. The stages in this process are define the goal, describe your audience, define the action, think the doubts, synthesize, be sure it work, decide a structure, visualize the answer.
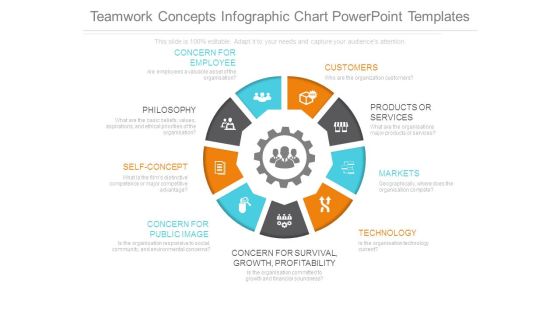
Teamwork Concepts Infographic Chart Powerpoint Templates
This is a teamwork concepts infographic chart powerpoint templates. This is a nine stage process. The stages in this process are concern for survival growth profitability, concern for employee, customers, products or services, markets, technology, concern for public image, self concept, philosophy.

Audit Quality Ppt PowerPoint Presentation Infographic Template
This is a audit quality ppt powerpoint presentation infographic template. This is a eleven stage process. The stages in this process are financial reporting timetable, contextual factors, business practices and law, laws and regulations, financial reporting framework, information system, broader cultural, audit, audit regulation.

Principles Of Change Ppt PowerPoint Presentation Infographics
This is a principles of change ppt powerpoint presentation infographics. This is a seven stage process. The stages in this process are resistance and comfort, authority for change, value systems, incremental vs radical change, the right answer is not enough, change is a process, senders and receivers.

Expense Model Ppt PowerPoint Presentation Infographics Portrait
This is a expense model ppt powerpoint presentation infographics portrait. This is a seven stage process. The stages in this process are name of company and purpose it serves, average cost to acquire a customer, how long will new funding last, how long is sales cycle to get a client.

SMM Strategies Ppt PowerPoint Presentation Infographics Template
Presenting this set of slides with name smm strategies ppt powerpoint presentation infographics template. This is a seven stage process. The stages in this process are content, implement, goal, social media, marketing strategy. This is a completely editable PowerPoint presentation and is available for immediate download. Download now and impress your audience.
Puzzle Ppt PowerPoint Presentation Infographic Template Brochure
Presenting this set of slides with name puzzle ppt powerpoint presentation infographic template brochure. This is a three stage process. The stage in this process is puzzle. This is a completely editable PowerPoint presentation and is available for immediate download. Download now and impress your audience.

Manifesto For Agile Application Development Agile Marketing Values Infographics PDF
This slide provides the glimpse about the agile marketing values such as validated learning, customer focused collaboration, adaptive campaigns, customer discovery, flexible planning, etc. This is a Manifesto For Agile Application Development Agile Marketing Values Infographics PDF template with various stages. Focus and dispense information on seven stages using this creative set, that comes with editable features. It contains large content boxes to add your information on topics like Validated Learning, Customer Focused Collaboration, Adaptive And Iterative Campaigns, ProcessCustomer Discovery. You can also showcase facts, figures, and other relevant content using this PPT layout. Grab it now.
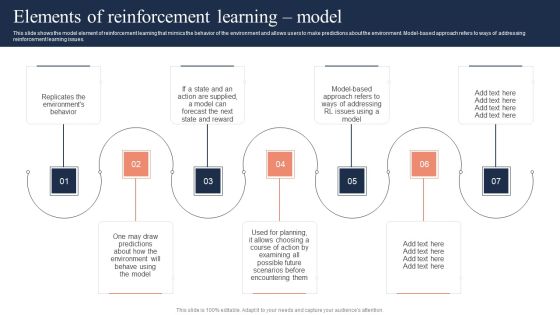
Fundamentals Of Reinforcement Elements Of Reinforcement Learning Model Infographics PDF
This slide shows the model element of reinforcement learning that mimics the behavior of the environment and allows users to make predictions about the environment. Model-based approach refers to ways of addressing reinforcement learning issues. Want to ace your presentation in front of a live audience Our Fundamentals Of Reinforcement Elements Of Reinforcement Learning Model Infographics PDF can help you do that by engaging all the users towards you. Slidegeeks experts have put their efforts and expertise into creating these impeccable powerpoint presentations so that you can communicate your ideas clearly. Moreover, all the templates are customizable, and easy-to-edit and downloadable. Use these for both personal and commercial use.
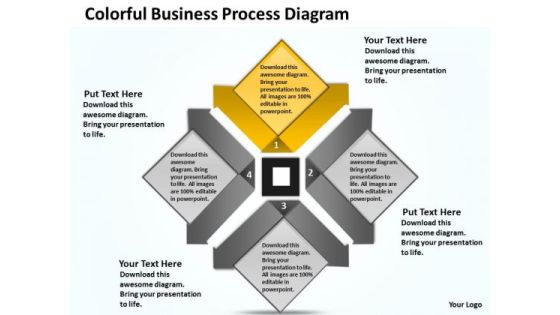
Business Model Diagrams PowerPoint Templates Backgrounds For Slides
We present our business model diagrams PowerPoint templates backgrounds for slides.Download our Business PowerPoint Templates because Our PowerPoint Templates and Slides will generate and maintain the level of interest you desire. They will create the impression you want to imprint on your audience. Present our Process and Flows PowerPoint Templates because You should Press the right buttons with our PowerPoint Templates and Slides. They will take your ideas down the perfect channel. Download our Success PowerPoint Templates because It will Raise the bar of your Thoughts. They are programmed to take you to the next level. Download our Flow Charts PowerPoint Templates because Our PowerPoint Templates and Slides will embellish your thoughts. See them provide the desired motivation to your team. Download and present our Arrows PowerPoint Templates because You can Zap them with our PowerPoint Templates and Slides. See them reel under the impact.Use these PowerPoint slides for presentations relating to Business, catalog, chart, demonstration, description, design, diagram, five, futuristic, green, illustration, information, interface, internet, level, list, marketing, model, multiple, navigation, network, pattern, pie, presentation, registry, report, section, space, sphere, statement, statistics, steps, structure, target. The prominent colors used in the PowerPoint template are Yellow, Gray, Black. People tell us our business model diagrams PowerPoint templates backgrounds for slides are specially created by a professional team with vast experience. They diligently strive to come up with the right vehicle for your brilliant Ideas. PowerPoint presentation experts tell us our five PowerPoint templates and PPT Slides will save the presenter time. Presenters tell us our business model diagrams PowerPoint templates backgrounds for slides look good visually. Use our chart PowerPoint templates and PPT Slides provide great value for your money. Be assured of finding the best projection to highlight your words. Customers tell us our business model diagrams PowerPoint templates backgrounds for slides have awesome images to get your point across. People tell us our five PowerPoint templates and PPT Slides effectively help you save your valuable time.

EMM Solution International Market Segmentation Infographics PDF
This is a emm solution international market segmentation infographics pdf template with various stages. Focus and dispense information on four stages using this creative set, that comes with editable features. It contains large content boxes to add your information on topics like international market segmentation, cultural, geographic, economic, political legal. You can also showcase facts, figures, and other relevant content using this PPT layout. Grab it now.
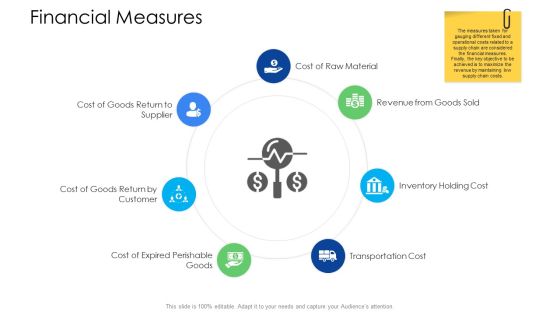
Logistics Management Services Financial Measures Infographics PDF
Presenting logistics management services financial measures infographics pdf to provide visual cues and insights. Share and navigate important information on seven stages that need your due attention. This template can be used to pitch topics like revenue from goods sold, inventory holding cost, transportation cost, cost of raw material. In addtion, this PPT design contains high resolution images, graphics, etc, that are easily editable and available for immediate download.

System For Operational Performance Management Infographics PDF
This slide covers the framework for operational performance management which includes planning, executing, measuring and improving with key business drivers such as people, leadership, operational security, etc. Presenting System For Operational Performance Management Infographics PDF to dispense important information. This template comprises four stages. It also presents valuable insights into the topics including Performance, Procedures, People, Plant. This is a completely customizable PowerPoint theme that can be put to use immediately. So, download it and address the topic impactfully.
Business Diagram Business Infographic With Icons PowerPoint Templates
Graphic of circular twisted arrows has been used to design this business diagram. This diagram contains helps to depict business process flows. Explain your strategy to co-ordinate activities.

Companys Merger And Acquisition Process Infographics PDF
This slide shows the companys merger and acquisition process which includes Definition of strategic goals, definition of investment framework, carrying out of target screening, etc.This is a companys merger and acquisition process infographics pdf template with various stages. Focus and dispense information on six stages using this creative set, that comes with editable features. It contains large content boxes to add your information on topics like carrying out of target screening, definition of investment framework, definition of strategic goal. You can also showcase facts, figures, and other relevant content using this PPT layout. Grab it now.

Catastrophe Recovery Application Plan Introduction Infographics PDF
This slide represents the disaster recovery plan and various steps of an effective DR plan, such as assemble a plan, identify the scope, appoint emergency contacts, designate a disaster recovery team, assign roles and responsibilities, and so on. Presenting catastrophe recovery application plan introduction infographics pdf to provide visual cues and insights. Share and navigate important information on eight stages that need your due attention. This template can be used to pitch topics like identify scope, assemble plan, testing and maintenance, restore technology functionality, disaster recovery plan. In addtion, this PPT design contains high resolution images, graphics, etc, that are easily editable and available for immediate download.

Knowledge Management Process Innovation Lifecycle Infographics PDF
The slide showcases knowledge management innovation cycle it illustrates the transformation of unstructured knowledge into more structured, reproducible information that is included into processes or products. It covers key processes like create, codify, embed and diffuse. Persuade your audience using this Knowledge Management Process Innovation Lifecycle Infographics PDF. This PPT design covers four stages, thus making it a great tool to use. It also caters to a variety of topics including Create, Codify, Embed. Download this PPT design now to present a convincing pitch that not only emphasizes the topic but also showcases your presentation skills.

Consulting Services Agreement Sample Ppt PowerPoint Presentation Infographic Template Infographic Template Cpb
This is a consulting services agreement sample ppt powerpoint presentation infographic template infographic template cpb. This is a three stage process. The stages in this process are consulting services agreement sample, management, marketing, business.

10 Stage Infographic Of Shared Services Customer Satisfaction Survey Infographic Ppt PowerPoint Presentation Inspiration Outfit PDF
Presenting 10 stage infographic of shared services customer satisfaction survey infographic ppt powerpoint presentation inspiration outfit pdf to dispense important information. This template comprises ten stages. It also presents valuable insights into the topics including 10 stage infographic of shared services customer satisfaction survey infographic. This is a completely customizable PowerPoint theme that can be put to use immediately. So, download it and address the topic impactfully.

Puzzle Infographic Semicircular Diagram PowerPoint Template

Seven Steps Semicircular Infographic Chart Powerpoint Template
This business slide contains four option banners with business icons. This PPT diagram is suitable to present concept of profit growth value analysis. Visual effect of this diagram provides more clarity to the subject.

7 Circle Infographics For Business Intelligence Teams Ppt PowerPoint Presentation Infographics Brochure PDF
Persuade your audience using this 7 circle infographics for business intelligence teams ppt powerpoint presentation infographics brochure pdf. This PPT design covers seven stages, thus making it a great tool to use. It also caters to a variety of topics including 7 circle infographics for business intelligence teams. Download this PPT design now to present a convincing pitch that not only emphasizes the topic but also showcases your presentation skills.

7 Steps Infographic Stages For Human Resources Change Management Strategy Ppt PowerPoint Presentation Infographics Example PDF
Persuade your audience using this 7 steps infographic stages for human resources change management strategy ppt powerpoint presentation infographics example pdf. This PPT design covers seven stages, thus making it a great tool to use. It also caters to a variety of topics including 7 steps infographic stages for human resources change management strategy. Download this PPT design now to present a convincing pitch that not only emphasizes the topic but also showcases your presentation skills.

BI Sectional Two Interconnected Circles Ppt PowerPoint Presentation Infographics Infographics PDF
Presenting this set of slides with name bi sectional two interconnected circles ppt powerpoint presentation infographics infographics pdf. This is a two stage process. The stages in this process are bi sectional two interconnected circles. This is a completely editable PowerPoint presentation and is available for immediate download. Download now and impress your audience.

Connecting Data Points Vector Icon Ppt PowerPoint Presentation Infographics Infographics PDF
Presenting this set of slides with name connecting data points vector icon ppt powerpoint presentation infographics infographics pdf. This is a three stage process. The stages in this process are connecting data points vector icon. This is a completely editable PowerPoint presentation and is available for immediate download. Download now and impress your audience.
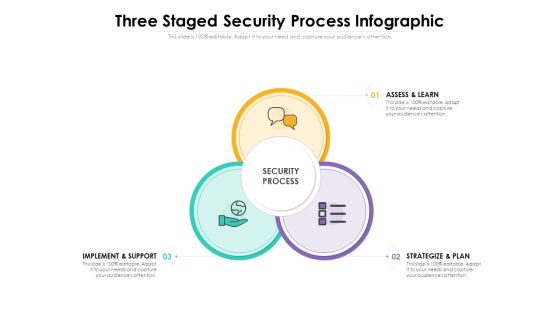
Three Staged Security Process Infographic Ppt PowerPoint Presentation File Infographic Template PDF
Presenting this set of slides with name three staged security process infographic ppt powerpoint presentation file infographic template pdf. This is a three stage process. The stages in this process are assess and learn, strategize and plan, implement and support. This is a completely editable PowerPoint presentation and is available for immediate download. Download now and impress your audience.

Brand Loyalty Through Public Relation Tactics Ppt PowerPoint Presentation Infographics Infographics PDF
Presenting brand loyalty through public relation tactics ppt powerpoint presentation infographics infographics pdf to dispense important information. This template comprises three stages. It also presents valuable insights into the topics including brand loyalty through public relation tactics. This is a completely customizable PowerPoint theme that can be put to use immediately. So, download it and address the topic impactfully.
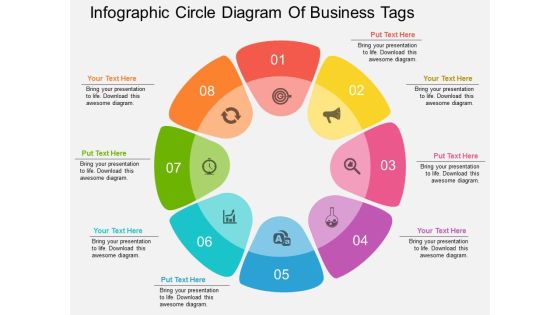
Infographic Circle Diagram Of Business Tags Powerpoint Template
Create dynamic presentations with our professional template containing circular infographic layout. This diagram is useful to display eight steps of any process. Download this template to leave permanent impression on your audience.
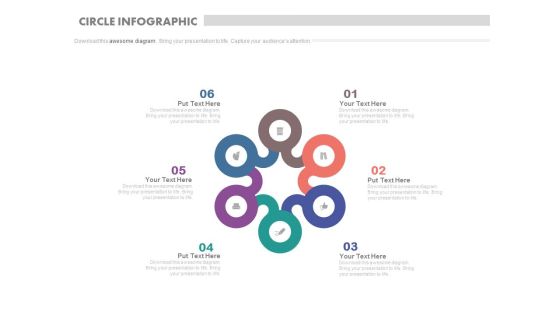
Six Steps Circle Infographics For Process Flow Powerpoint Slides
This business slide contains circular infographic design. This diagram provides schematic representation of any information. Visual effect this slide helps in maintaining the flow of the discussion and provides more clarity to the subject.

Circle Infographics Developing A Marketing Strategy Powerpoint Template
This business slide contains circular infographic design. This diagram may be used for developing a marketing strategy. Visual effect this slide helps in maintaining the flow of the discussion and provides more clarity to the subject.
Six Sections Business Process Flow Ppt PowerPoint Presentation Icon Infographics
This is a six sections business process flow ppt powerpoint presentation icon infographics. This is a six stage process. The stages in this process are 6 circular arrows, 6 circle arrows, 6 cycle arrows.

Four Arrows Showing Buisness Factors Ppt PowerPoint Presentation Ideas Infographics
This is a four arrows showing buisness factors ppt powerpoint presentation ideas infographics. This is a four stage process. The stages in this process are circle process 4 arrows, circle cycle 4 arrows, circular process 4 arrows.
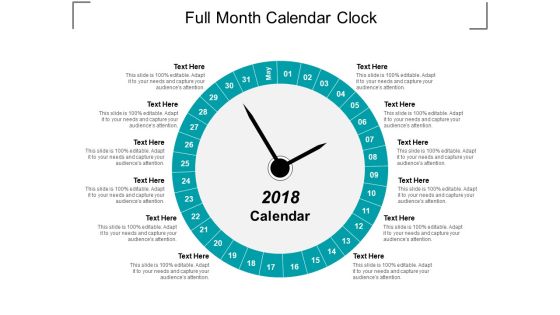
Full Month Calendar Clock Ppt Powerpoint Presentation Infographic Template Clipart
This is a full month calendar clock ppt powerpoint presentation infographic template clipart. This is a twelve stage process. The stages in this process are circular calendar, circle calendar, cyclic calendar.

Automation Banking Financial Services Ppt PowerPoint Presentation Infographic Template Infographics Cpb
Presenting this set of slides with name automation banking financial services ppt powerpoint presentation infographic template infographics cpb. This is an editable Powerpoint four stages graphic that deals with topics like automation banking financial services to help convey your message better graphically. This product is a premium product available for immediate download and is 100 percent editable in Powerpoint. Download this now and use it in your presentations to impress your audience.
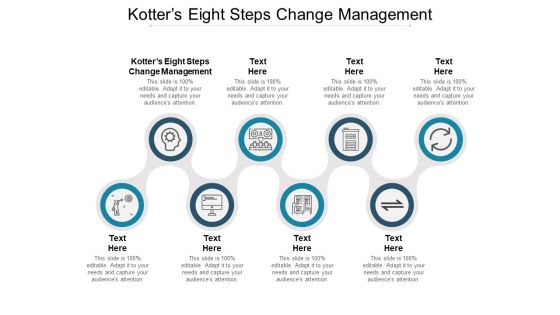
Kotters Eight Steps Change Management Ppt PowerPoint Presentation Infographic Template Infographic Template Cpb
Presenting this set of slides with name kotters eight steps change management ppt powerpoint presentation infographic template infographic template cpb. This is an editable Powerpoint eight stages graphic that deals with topics like kotters eight steps change management to help convey your message better graphically. This product is a premium product available for immediate download and is 100 percent editable in Powerpoint. Download this now and use it in your presentations to impress your audience.

Ten Stages Infographic Template To Create A Resource Plan Ppt PowerPoint Presentation Infographics Skills
Presenting this set of slides with name ten stages infographic template to create a resource plan ppt powerpoint presentation infographics skills. This is a ten stage process. The stages in this process are create a resource plan, financial planning, risk planning, supplier contract, communication plan, create a project plan, quality plan, phase review. This is a completely editable PowerPoint presentation and is available for immediate download. Download now and impress your audience.

Purchase Pay Control Matrix Ppt PowerPoint Presentation Infographic Template Infographics Cpb Pdf
Presenting this set of slides with name purchase pay control matrix ppt powerpoint presentation infographic template infographics cpb pdf. This is an editable Powerpoint twelve stages graphic that deals with topics like purchase pay control matrix to help convey your message better graphically. This product is a premium product available for immediate download and is 100 percent editable in Powerpoint. Download this now and use it in your presentations to impress your audience.

Service Improvement Strategy Pdca Cycle Ppt PowerPoint Presentation Infographics Infographic Template PDF
Presenting this set of slides with name service improvement strategy pdca cycle ppt powerpoint presentation infographics infographic template pdf. This is a seven stage process. The stages in this process are identify improvement strategy, implement improvement, present and use information, analyse information and data, data processing, data gathering, define your measurements, information knowledge, data wisdom. This is a completely editable PowerPoint presentation and is available for immediate download. Download now and impress your audience.
 Home
Home