5 Year Timeline

Employee Count And Breakdown Web Design And Development Company Profile Information PDF
This slide represents the employee count for last five years from 2018 to 2022. It also includes employee split by geography and gender From laying roadmaps to briefing everything in detail, our templates are perfect for you. You can set the stage with your presentation slides. All you have to do is download these easy to edit and customizable templates. Employee Count And Breakdown Web Design And Development Company Profile Information PDF will help you deliver an outstanding performance that everyone would remember and praise you for. Do download this presentation today.
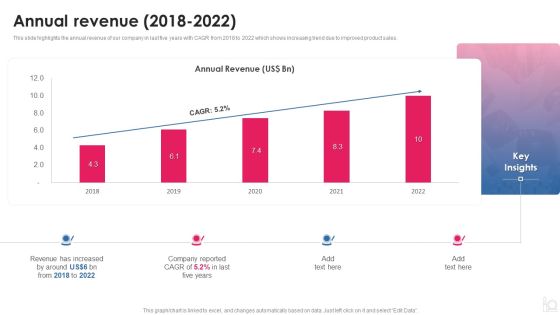
Makeup And Beauty Care Products Company Profile Annual Revenue 2018 To 2022 Sample PDF
This slide highlights the annual revenue of our company in last five years with CAGR from 2018 to 2022 which shows increasing trend due to improved product sales.Deliver and pitch your topic in the best possible manner with this Makeup And Beauty Care Products Company Profile Annual Revenue 2018 To 2022 Sample PDF Use them to share invaluable insights on Revenue Increased, Company Reported, Annual Revenue and impress your audience. This template can be altered and modified as per your expectations. So, grab it now.
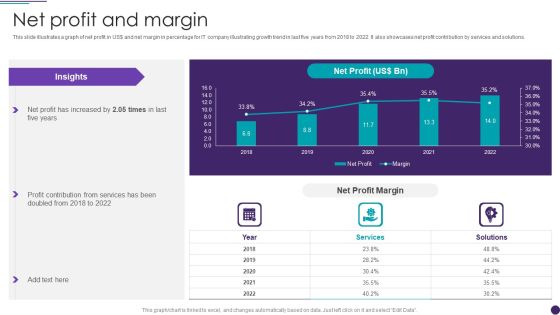
IT Services Business Profile Net Profit And Margin Sample PDF
This slide illustrates a graph of net profit in US doller and net margin in percentage for IT company illustrating growth trend in last five years from 2018 to 2022. It also showcases net profit contribution by services and solutions. Deliver and pitch your topic in the best possible manner with this IT Services Business Profile Net Profit And Margin Sample PDF. Use them to share invaluable insights on Services, Net Profit Margin and impress your audience. This template can be altered and modified as per your expectations. So, grab it now.

IT Services Business Profile Operating Profit And Margin Sample PDF
This slide illustrates a graph of operating profit in US doller and operating margin in percentage for IT company illustrating growth trend in last five years from 2018 to 2022. It also showcases operating profit contribution by services and solutions. Deliver an awe inspiring pitch with this creative IT Services Business Profile Operating Profit And Margin Sample PDF bundle. Topics like Operating Profit, Services can be discussed with this completely editable template. It is available for immediate download depending on the needs and requirements of the user.
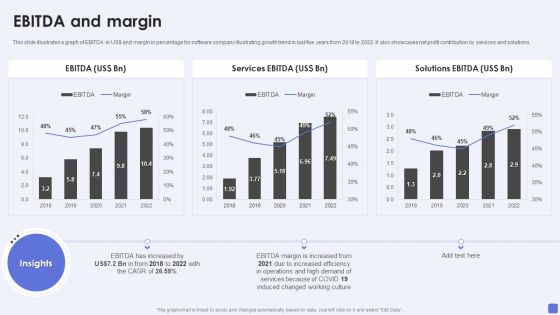
Software Services Business Profile EBITDA And Margin Ppt PowerPoint Presentation Gallery Slide Portrait PDF
This slide illustrates a graph of EBITDA in US dollar and margin in percentage for software company illustrating growth trend in last five years from 2018 to 2022. It also showcases net profit contribution by services and solutions. Deliver an awe inspiring pitch with this creative Software Services Business Profile EBITDA And Margin Ppt PowerPoint Presentation Gallery Slide Portrait PDF bundle. Topics like Services EB, Solutions EBITDA, EBITDA Margin can be discussed with this completely editable template. It is available for immediate download depending on the needs and requirements of the user.

Software Services Business Profile Gross Profit And Margin Ppt PowerPoint Presentation Gallery Templates PDF
This slide illustrates a graph of gross profit in US dollar and gross margin in percentage for software company illustrating growth trend in last five years from 2018 to 2022. It also showcases gross profit contribution by services and solutions. Deliver an awe inspiring pitch with this creative Software Services Business Profile Gross Profit And Margin Ppt PowerPoint Presentation Gallery Templates PDF bundle. Topics like Total Gross Profit, Services Gross Profit, Solutions Gross Profit can be discussed with this completely editable template. It is available for immediate download depending on the needs and requirements of the user.
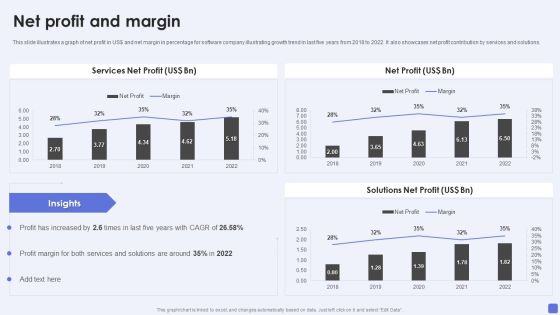
Software Services Business Profile Net Profit And Margin Ppt PowerPoint Presentation File Slides PDF
This slide illustrates a graph of net profit in US dollar and net margin in percentage for software company illustrating growth trend in last five years from 2018 to 2022. It also showcases net profit contribution by services and solutions. Deliver an awe inspiring pitch with this creative Software Services Business Profile Net Profit And Margin Ppt PowerPoint Presentation File Slides PDF bundle. Topics like Services Net Profit, Net Profit, Solutions Net Profit can be discussed with this completely editable template. It is available for immediate download depending on the needs and requirements of the user.

Software Services Business Profile Operating Profit And Margin Ppt PowerPoint Presentation Gallery Inspiration PDF
This slide illustrates a graph of operating profit in US dollar and operating margin in percentage for software company illustrating growth trend in last five years from 2018 to 2022. It also showcases operating profit contribution by services and solutions. Deliver and pitch your topic in the best possible manner with this Software Services Business Profile Operating Profit And Margin Ppt PowerPoint Presentation Gallery Inspiration PDF. Use them to share invaluable insights on Operating Profit, Services Operating Profit, Solutions Operating Profit and impress your audience. This template can be altered and modified as per your expectations. So, grab it now.
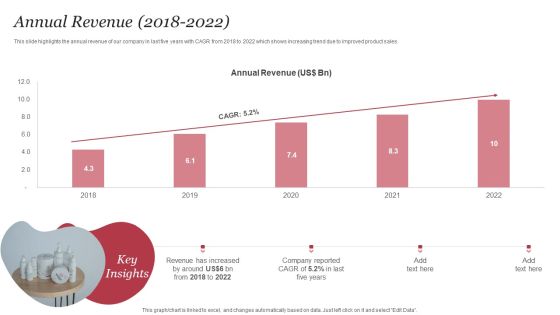
Personal Care Company Profile Annual Revenue 2018 To 2022 Graphics PDF
This slide highlights the annual revenue of our company in last five years with CAGR from 2018 to 2022 which shows increasing trend due to improved product sales. Deliver and pitch your topic in the best possible manner with this Personal Care Company Profile Annual Revenue 2018 To 2022 Graphics PDF. Use them to share invaluable insights on Annual Revenue, Key Insights, Annual Revenue, 2018 To 2022 and impress your audience. This template can be altered and modified as per your expectations. So, grab it now.

Advertising Solutions Company Details Operating Profit 2018 To 2022 Ppt PowerPoint Presentation Gallery Themes PDF
This slide focuses on operating profit of advertising agency for last five years from 2018 to 2022 which represents increasing trend due to reduced operating expenses. Deliver and pitch your topic in the best possible manner with this Advertising Solutions Company Details Operating Profit 2018 To 2022 Ppt PowerPoint Presentation Gallery Themes PDF. Use them to share invaluable insights on Operating Profit, 2018 To 2022, Profits Increased and impress your audience. This template can be altered and modified as per your expectations. So, grab it now.

Software Products And Solutions Firm Details EBITDA And Margin Structure PDF
This slide illustrates a graph of EBITDA in US dollar and margin in percentage for software company illustrating growth trend in last five years from 2018 to 2022. It also showcases net profit contribution by services and solutions. Deliver an awe inspiring pitch with this creative Software Products And Solutions Firm Details EBITDA And Margin Structure PDF bundle. Topics like EBITDA, Services EBITDA, Solutions EBITDA, 2018 To 2022 can be discussed with this completely editable template. It is available for immediate download depending on the needs and requirements of the user.
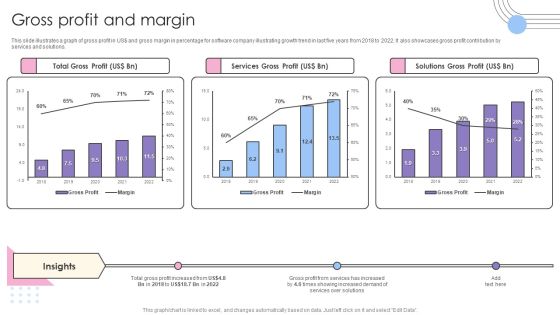
Software Products And Solutions Firm Details Gross Profit And Margin Pictures PDF
This slide illustrates a graph of gross profit in US dollar and gross margin in percentage for software company illustrating growth trend in last five years from 2018 to 2022. It also showcases gross profit contribution by services and solutions. Deliver and pitch your topic in the best possible manner with this Software Products And Solutions Firm Details Gross Profit And Margin Pictures PDF. Use them to share invaluable insights on Total Gross Profit, Services Gross Profit, Solutions Gross Profit and impress your audience. This template can be altered and modified as per your expectations. So, grab it now.

Software Products And Solutions Firm Details Net Profit And Margin Information PDF
This slide illustrates a graph of net profit in US dollar and net margin in percentage for software company illustrating growth trend in last five years from 2018 to 2022. It also showcases net profit contribution by services and solutions. Deliver and pitch your topic in the best possible manner with this Software Products And Solutions Firm Details Net Profit And Margin Information PDF. Use them to share invaluable insights on Net Profit, Services Net Profit, Solutions Net Profit and impress your audience. This template can be altered and modified as per your expectations. So, grab it now.

Software Products And Solutions Firm Details Operating Profit And Margin Mockup PDF
This slide illustrates a graph of operating profit in US dollar and operating margin in percentage for software company illustrating growth trend in last five years from 2018 to 2022. It also showcases operating profit contribution by services and solutions. Deliver an awe inspiring pitch with this creative Software Products And Solutions Firm Details Operating Profit And Margin Mockup PDF bundle. Topics like Operating Profit, Services Operating Profit, Solutions Operating Profit can be discussed with this completely editable template. It is available for immediate download depending on the needs and requirements of the user.
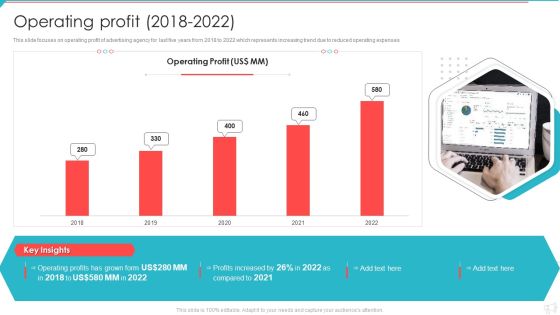
Advertisement And Marketing Agency Company Profile Operating Profit 2018 To 2022 Infographics PDF
This slide focuses on operating profit of advertising agency for last five years from 2018 to 2022 which represents increasing trend due to reduced operating expenses. Deliver and pitch your topic in the best possible manner with this Advertisement And Marketing Agency Company Profile Operating Profit 2018 To 2022 Infographics PDF. Use them to share invaluable insights on Operating Profit, Profits Increased, 2018 To 2022 and impress your audience. This template can be altered and modified as per your expectations. So, grab it now.

Business Software Development Company Profile EBITDA And Margin Summary PDF
This slide illustrates a graph of EBITDA in US dollar and margin in percentage for software company illustrating growth trend in last five years from 2018 to 2022. It also showcases net profit contribution by services and solutions. Deliver an awe inspiring pitch with this creative Business Software Development Company Profile EBITDA And Margin Summary PDF bundle. Topics like EBITDA, Services EBITDA, Solutions EBITDA can be discussed with this completely editable template. It is available for immediate download depending on the needs and requirements of the user.

Business Software Development Company Profile Gross Profit And Margin Microsoft PDF
This slide illustrates a graph of gross profit in US dollar and gross margin in percentage for software company illustrating growth trend in last five years from 2018 to 2022. It also showcases gross profit contribution by services and solutions. Deliver and pitch your topic in the best possible manner with this Business Software Development Company Profile Gross Profit And Margin Microsoft PDF. Use them to share invaluable insights on Total Gross Profit, Services Gross Profit, Solutions Gross Profit and impress your audience. This template can be altered and modified as per your expectations. So, grab it now.

Business Software Development Company Profile Net Profit And Margin Mockup PDF
This slide illustrates a graph of net profit in US dollar and net margin in percentage for software company illustrating growth trend in last five years from 2018 to 2022. It also showcases net profit contribution by services and solutions. Deliver an awe inspiring pitch with this creative Business Software Development Company Profile Net Profit And Margin Mockup PDF bundle. Topics like Net Profit, Services Net Profit, Solutions Net Profit can be discussed with this completely editable template. It is available for immediate download depending on the needs and requirements of the user.

Business Software Development Company Profile Operating Profit And Margin Summary PDF
This slide illustrates a graph of operating profit in US dollar and operating margin in percentage for software company illustrating growth trend in last five years from 2018 to 2022. It also showcases operating profit contribution by services and solutions. Deliver and pitch your topic in the best possible manner with this Business Software Development Company Profile Operating Profit And Margin Summary PDF. Use them to share invaluable insights on Operating Profit, Services Operating Profit, Solutions Operating Profit and impress your audience. This template can be altered and modified as per your expectations. So, grab it now.

Hospital Medical Research Company Profile Operating Profit And Margin Sample PDF
The slide showcases operating profit trend last five financial years along with profitability margin. It also showcases operating profit share for FY22 from pharmacy, hospital and research business verticals. Deliver and pitch your topic in the best possible manner with this Hospital Medical Research Company Profile Operating Profit And Margin Sample PDF. Use them to share invaluable insights on Operating Profit, Operating Profit Split, Business Units 2022 and impress your audience. This template can be altered and modified as per your expectations. So, grab it now.
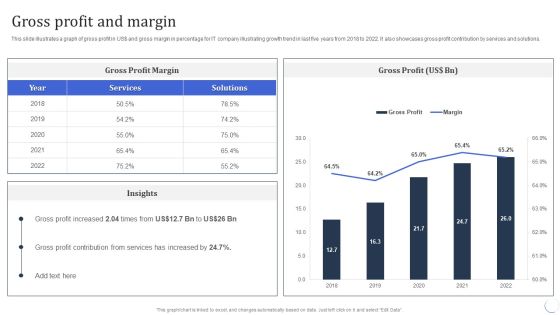
Infotech Solutions Research And Development Company Summary Gross Profit And Margin Ideas PDF
This slide illustrates a graph of gross profit in US dollar and gross margin in percentage for IT company illustrating growth trend in last five years from 2018 to 2022. It also showcases gross profit contribution by services and solutions. Deliver an awe inspiring pitch with this creative Infotech Solutions Research And Development Company Summary Gross Profit And Margin Ideas PDF bundle. Topics like Services, Gross Profit Margin can be discussed with this completely editable template. It is available for immediate download depending on the needs and requirements of the user.

Infotech Solutions Research And Development Company Summary Net Profit And Margin Information PDF
This slide illustrates a graph of net profit in US dollar and net margin in percentage for IT company illustrating growth trend in last five years from 2018 to 2022. It also showcases net profit contribution by services and solutions. Deliver and pitch your topic in the best possible manner with this Infotech Solutions Research And Development Company Summary Net Profit And Margin Information PDF. Use them to share invaluable insights on Profit Contribution, Services, Net Profit and impress your audience. This template can be altered and modified as per your expectations. So, grab it now.
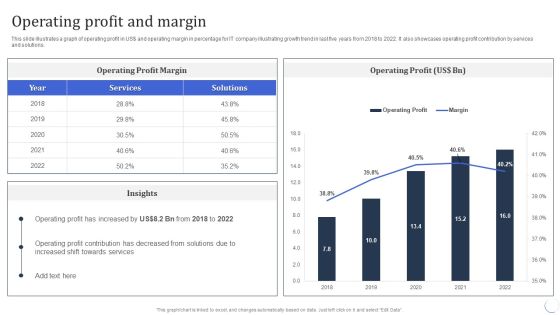
Infotech Solutions Research And Development Company Summary Operating Profit And Margin Download PDF
This slide illustrates a graph of operating profit in US dollar and operating margin in percentage for IT company illustrating growth trend in last five years from 2018 to 2022. It also showcases operating profit contribution by services and solutions. Deliver an awe inspiring pitch with this creative Infotech Solutions Research And Development Company Summary Operating Profit And Margin Download PDF bundle. Topics like Services, Operating Profit can be discussed with this completely editable template. It is available for immediate download depending on the needs and requirements of the user.

Pharmaceutical And Clinical Research Summary Operating Profit And Margin Microsoft PDF
The slide showcases operating profit trend last five financial years along with profitability margin. It also showcases operating profit share for FY22 from pharmacy, hospital and research business verticals. Deliver and pitch your topic in the best possible manner with this Pharmaceutical And Clinical Research Summary Operating Profit And Margin Microsoft PDF. Use them to share invaluable insights on Operating Profit Margin, Raw Material, Price and impress your audience. This template can be altered and modified as per your expectations. So, grab it now.

IT Application Services Company Outline Gross Profit And Margin Elements PDF
This slide illustrates a graph of gross profit in US dollar and gross margin in percentage for IT company illustrating growth trend in last five years from 2018 to 2022. It also showcases gross profit contribution by services and solutions. Deliver an awe inspiring pitch with this creative IT Application Services Company Outline Gross Profit And Margin Elements PDF bundle. Topics like Gross Profit Margin, Services can be discussed with this completely editable template. It is available for immediate download depending on the needs and requirements of the user.

IT Application Services Company Outline Net Profit And Margin Structure PDF
This slide illustrates a graph of net profit in US dollar and net margin in percentage for IT company illustrating growth trend in last five years from 2018 to 2022. It also showcases net profit contribution by services and solutions. Deliver and pitch your topic in the best possible manner with this IT Application Services Company Outline Net Profit And Margin Structure PDF. Use them to share invaluable insights on Net Profit Margin, Services, Margin and impress your audience. This template can be altered and modified as per your expectations. So, grab it now.
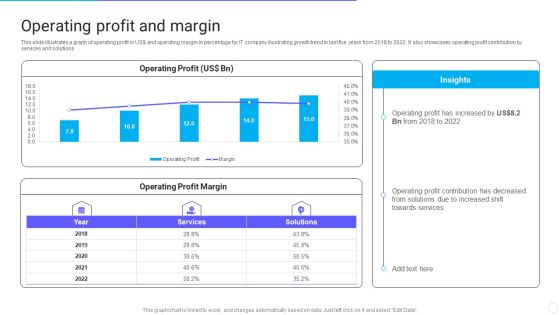
IT Application Services Company Outline Operating Profit And Margin Structure PDF
This slide illustrates a graph of operating profit in US dollar and operating margin in percentage for IT company illustrating growth trend in last five years from 2018 to 2022. It also showcases operating profit contribution by services and solutions. Deliver an awe inspiring pitch with this creative IT Application Services Company Outline Operating Profit And Margin Structure PDF bundle. Topics like Operating Profit And Margin can be discussed with this completely editable template. It is available for immediate download depending on the needs and requirements of the user.
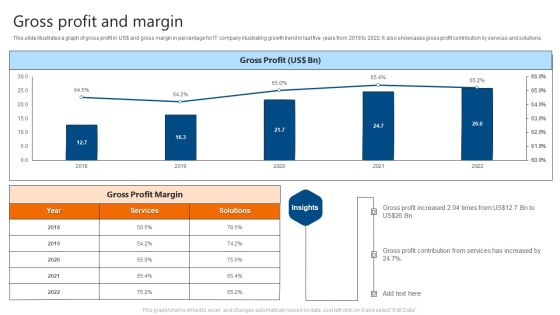
Gross Profit And Margin IT Software Development Company Profile Slides PDF
This slide illustrates a graph of gross profit in US doller and gross margin in percentage for IT company illustrating growth trend in last five years from 2018 to 2022. It also showcases gross profit contribution by services and solutions. Deliver and pitch your topic in the best possible manner with this Gross Profit And Margin IT Software Development Company Profile Slides PDF. Use them to share invaluable insights on Gross Profit, Margin and impress your audience. This template can be altered and modified as per your expectations. So, grab it now.
Net Profit And Margin IT Software Development Company Profile Icons PDF
This slide illustrates a graph of net profit in US doller and net margin in percentage for IT company illustrating growth trend in last five years from 2018 to 2022. It also showcases net profit contribution by services and solutions. Deliver an awe inspiring pitch with this creative Net Profit And Margin IT Software Development Company Profile Icons PDF bundle. Topics like Net Profit, Net Profit Margin can be discussed with this completely editable template. It is available for immediate download depending on the needs and requirements of the user.

Operating Profit And Margin IT Software Development Company Profile Guidelines PDF
This slide illustrates a graph of operating profit in US doller and operating margin in percentage for IT company illustrating growth trend in last five years from 2018 to 2022. It also showcases operating profit contribution by services and solutions. Deliver and pitch your topic in the best possible manner with this Operating Profit And Margin IT Software Development Company Profile Guidelines PDF. Use them to share invaluable insights on Operating Profit, Operating Profit Margin and impress your audience. This template can be altered and modified as per your expectations. So, grab it now.
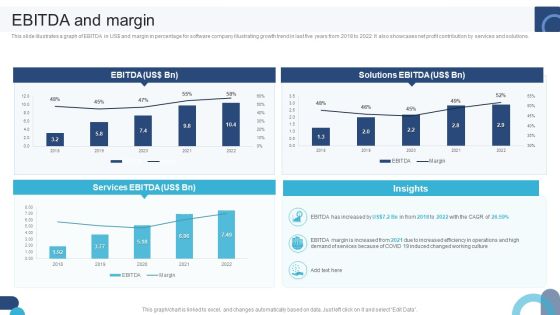
Digital Application Software Development Business Profile EBITDA And Margin Guidelines PDF
This slide illustrates a graph of EBITDA in US dollar and margin in percentage for software company illustrating growth trend in last five years from 2018 to 2022. It also showcases net profit contribution by services and solutions. If your project calls for a presentation, then Slidegeeks is your go-to partner because we have professionally designed, easy-to-edit templates that are perfect for any presentation. After downloading, you can easily edit Digital Application Software Development Business Profile EBITDA And Margin Guidelines PDF and make the changes accordingly. You can rearrange slides or fill them with different images. Check out all the handy templates
Digital Products Company Outline Ebitda And Margin Inspiration PDF
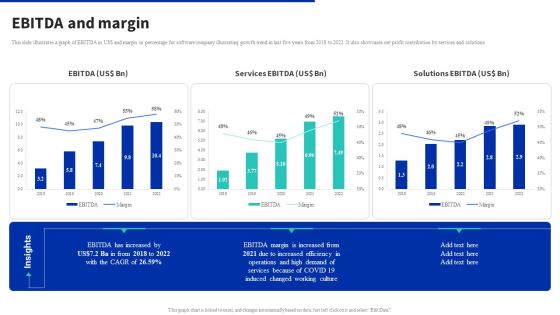
This slide illustrates a graph of EBITDA in US dollar and margin in percentage for software company illustrating growth trend in last five years from 2018 to 2022. It also showcases net profit contribution by services and solutions. Take your projects to the next level with our ultimate collection of Digital Products Company Outline Ebitda And Margin Inspiration PDF. Slidegeeks has designed a range of layouts that are perfect for representing task or activity duration, keeping track of all your deadlines at a glance. Tailor these designs to your exact needs and give them a truly corporate look with your own brand colors they will make your projects stand out from the rest.
Pharmaceutical Company Financial Summary Operating Profit And Margin Background PDF
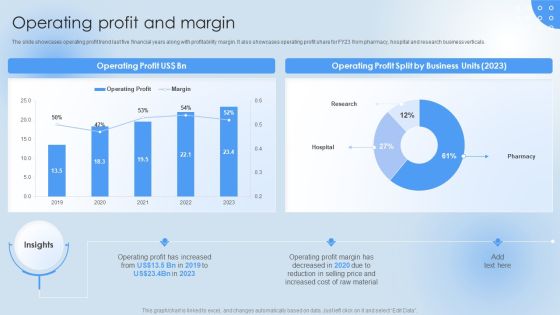
The slide showcases operating profit trend last five financial years along with profitability margin. It also showcases operating profit share for FY23 from pharmacy, hospital and research business verticals. Present like a pro with Pharmaceutical Company Financial Summary Operating Profit And Margin Background PDF Create beautiful presentations together with your team, using our easy-to-use presentation slides. Share your ideas in real-time and make changes on the fly by downloading our templates. So whether youre in the office, on the go, or in a remote location, you can stay in sync with your team and present your ideas with confidence. With Slidegeeks presentation got a whole lot easier. Grab these presentations today.

Revenue And Net Profit Trend For Brand Ideas PDF
This slide represents revenue and net profit for five years for the company. It showcase increase in revenue due to product recognition in market and gaining competitive edge in market. Formulating a presentation can take up a lot of effort and time, so the content and message should always be the primary focus. The visuals of the PowerPoint can enhance the presenters message, so our Revenue And Net Profit Trend For Brand Ideas PDF was created to help save time. Instead of worrying about the design, the presenter can concentrate on the message while our designers work on creating the ideal templates for whatever situation is needed. Slidegeeks has experts for everything from amazing designs to valuable content, we have put everything into Revenue And Net Profit Trend For Brand Ideas PDF.
Ad And Media Agency Company Profile Operating Profit 2018 To 2022 Information PDF
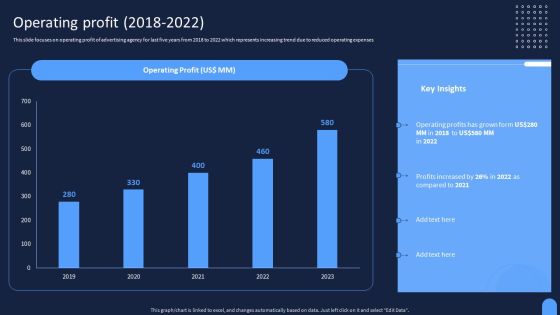
This slide focuses on operating profit of advertising agency for last five years from 2018 to 2022 which represents increasing trend due to reduced operating expenses. If you are looking for a format to display your unique thoughts, then the professionally designed Ad And Media Agency Company Profile Operating Profit 2018 To 2022 Information PDF is the one for you. You can use it as a Google Slides template or a PowerPoint template. Incorporate impressive visuals, symbols, images, and other charts. Modify or reorganize the text boxes as you desire. Experiment with shade schemes and font pairings. Alter, share or cooperate with other people on your work. Download Ad And Media Agency Company Profile Operating Profit 2018 To 2022 Information PDF and find out how to give a successful presentation. Present a perfect display to your team and make your presentation unforgettable.

Digital Application Software Development Business Profile Gross Profit And Margin Pictures PDF
This slide illustrates a graph of gross profit in US dollar and gross margin in percentage for software company illustrating growth trend in last five years from 2018 to 2022. It also showcases gross profit contribution by services and solutions. Formulating a presentation can take up a lot of effort and time, so the content and message should always be the primary focus. The visuals of the PowerPoint can enhance the presenters message, so our Digital Application Software Development Business Profile Gross Profit And Margin Pictures PDF was created to help save time. Instead of worrying about the design, the presenter can concentrate on the message while our designers work on creating the ideal templates for whatever situation is needed. Slidegeeks has experts for everything from amazing designs to valuable content, we have put everything into Digital Application Software Development Business Profile Gross Profit And Margin Pictures PDF.

Digital Application Software Development Business Profile Net Profit And Margin Information PDF
This slide illustrates a graph of net profit in US dollar and net margin in percentage for software company illustrating growth trend in last five years from 2018 to 2022. It also showcases net profit contribution by services and solutions. Welcome to our selection of the Digital Application Software Development Business Profile Net Profit And Margin Information PDF. These are designed to help you showcase your creativity and bring your sphere to life. Planning and Innovation are essential for any business that is just starting out. This collection contains the designs that you need for your everyday presentations. All of our PowerPoints are 100 percent editable, so you can customize them to suit your needs. This multi-purpose template can be used in various situations. Grab these presentation templates today.
Digital Application Software Development Business Profile Operating Profit And Margin Professional PDF
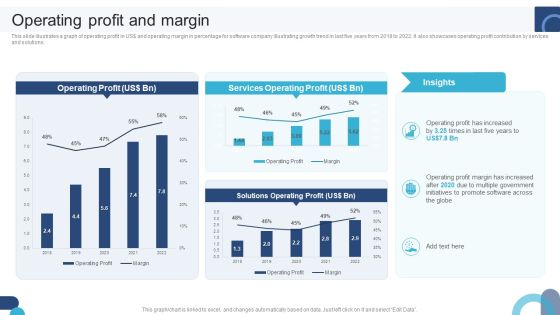
This slide illustrates a graph of operating profit in US dollar and operating margin in percentage for software company illustrating growth trend in last five years from 2018 to 2022. It also showcases operating profit contribution by services and solutions. Explore a selection of the finest Digital Application Software Development Business Profile Operating Profit And Margin Professional PDF here. With a plethora of professionally designed and pre-made slide templates, you can quickly and easily find the right one for your upcoming presentation. You can use our Digital Application Software Development Business Profile Operating Profit And Margin Professional PDF to effectively convey your message to a wider audience. Slidegeeks has done a lot of research before preparing these presentation templates. The content can be personalized and the slides are highly editable. Grab templates today from Slidegeeks.

Business Strategy Consulting Solutions Company Outline Operating Income Clipart PDF
This slide shows the operating income of our consulting company for last five years from 2018 to 2022 which includes increasing trend of operating income. This Business Strategy Consulting Solutions Company Outline Operating Income Clipart PDF from Slidegeeks makes it easy to present information on your topic with precision. It provides customization options, so you can make changes to the colors, design, graphics, or any other component to create a unique layout. It is also available for immediate download, so you can begin using it right away. Slidegeeks has done good research to ensure that you have everything you need to make your presentation stand out. Make a name out there for a brilliant performance.
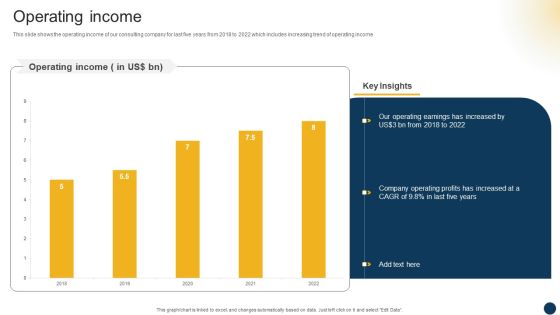
Organizational Advisory Solutions Business Profile Operating Income Summary PDF
This slide shows the operating income of our consulting company for last five years from 2018 to 2022 which includes increasing trend of operating income. This Organizational Advisory Solutions Business Profile Operating Income Summary PDF from Slidegeeks makes it easy to present information on your topic with precision. It provides customization options, so you can make changes to the colors, design, graphics, or any other component to create a unique layout. It is also available for immediate download, so you can begin using it right away. Slidegeeks has done good research to ensure that you have everything you need to make your presentation stand out. Make a name out there for a brilliant performance.
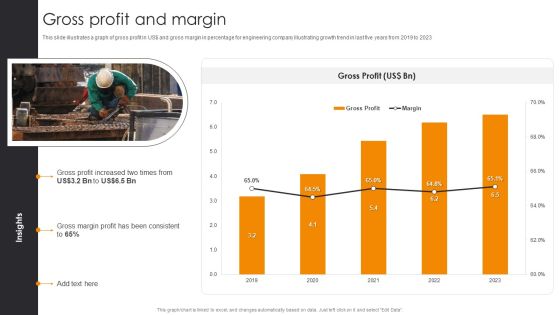
Gross Profit And Margin Engineering Company Financial Analysis Report Rules PDF
This slide illustrates a graph of gross profit in US dollar and gross margin in percentage for engineering company illustrating growth trend in last five years from 2019 to 2023. Retrieve professionally designed Gross Profit And Margin Engineering Company Financial Analysis Report Rules PDF to effectively convey your message and captivate your listeners. Save time by selecting pre-made slideshows that are appropriate for various topics, from business to educational purposes. These themes come in many different styles, from creative to corporate, and all of them are easily adjustable and can be edited quickly. Access them as PowerPoint templates or as Google Slides themes. You do not have to go on a hunt for the perfect presentation because Slidegeeks got you covered from everywhere.

IT Firm Financial Statement Gross Profit And Margin Summary PDF
This slide illustrates a graph of gross profit in US dollar and gross margin in percentage for IT company illustrating growth trend in last five years from 2019 to 2023. It also showcases gross profit contribution by services and solutions. Boost your pitch with our creative IT Firm Financial Statement Gross Profit And Margin Summary PDF. Deliver an awe inspiring pitch that will mesmerize everyone. Using these presentation templates you will surely catch everyones attention. You can browse the ppts collection on our website. We have researchers who are experts at creating the right content for the templates. So you do not have to invest time in any additional work. Just grab the template now and use them.
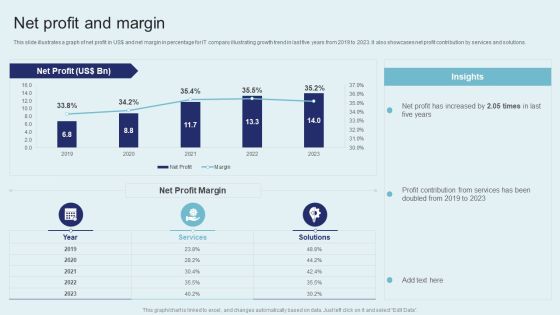
IT Firm Financial Statement Net Profit And Margin Slides PDF
This slide illustrates a graph of net profit in US dollar and net margin in percentage for IT company illustrating growth trend in last five years from 2019 to 2023. It also showcases net profit contribution by services and solutions. Do you have to make sure that everyone on your team knows about any specific topic I yes, then you should give IT Firm Financial Statement Net Profit And Margin Slides PDF a try. Our experts have put a lot of knowledge and effort into creating this impeccable IT Firm Financial Statement Net Profit And Margin Slides PDF. You can use this template for your upcoming presentations, as the slides are perfect to represent even the tiniest detail. You can download these templates from the Slidegeeks website and these are easy to edit. So grab these today.

IT Firm Financial Statement Operating Profit And Margin Formats PDF
This slide illustrates a graph of operating profit in US dollar and operating margin in percentage for IT company IT Firm Fina growth trend in last five years from 2019 to 2023. It also showcases operating profit contribution by services and solutions. Get a simple yet stunning designed IT Firm Financial Statement Operating Profit And Margin Formats PDF. It is the best one to establish the tone in your meetings. It is an excellent way to make your presentations highly effective. So, download this PPT today from Slidegeeks and see the positive impacts. Our easy to edit IT Firm Financial Statement Operating Profit And Margin Formats PDF can be your go to option for all upcoming conferences and meetings. So, what are you waiting for Grab this template today.
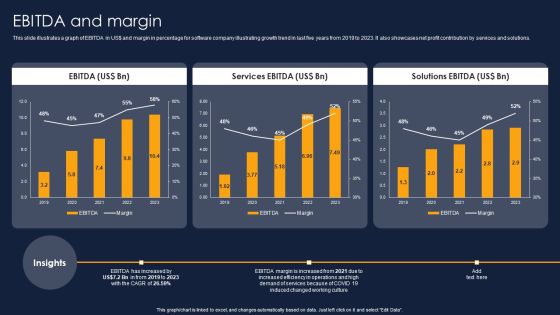
Ebitda And Margin Financial Performance Report Of Software Firm Pictures PDF
This slide illustrates a graph of EBITDA in US doller and margin in percentage for software company illustrating growth trend in last five years from 2019 to 2023. It also showcases net profit contribution by services and solutions. Get a simple yet stunning designed Ebitda And Margin Financial Performance Report Of Software Firm Pictures PDF. It is the best one to establish the tone in your meetings. It is an excellent way to make your presentations highly effective. So, download this PPT today from Slidegeeks and see the positive impacts. Our easy-to-edit Ebitda And Margin Financial Performance Report Of Software Firm Pictures PDF can be your go-to option for all upcoming conferences and meetings. So, what are you waiting for Grab this template today.
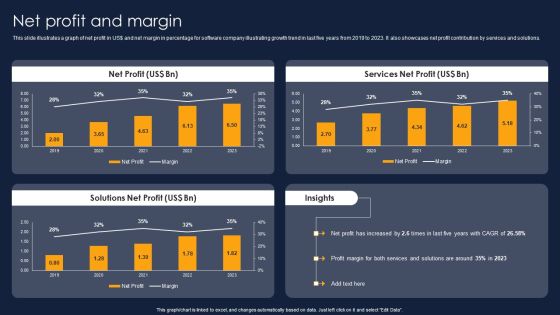
Net Profit And Margin Financial Performance Report Of Software Firm Demonstration PDF
This slide illustrates a graph of net profit in US doller and net margin in percentage for software company illustrating growth trend in last five years from 2019 to 2023. It also showcases net profit contribution by services and solutions. Present like a pro with Net Profit And Margin Financial Performance Report Of Software Firm Demonstration PDF Create beautiful presentations together with your team, using our easy-to-use presentation slides. Share your ideas in real-time and make changes on the fly by downloading our templates. So whether you are in the office, on the go, or in a remote location, you can stay in sync with your team and present your ideas with confidence. With Slidegeeks presentation got a whole lot easier. Grab these presentations today.
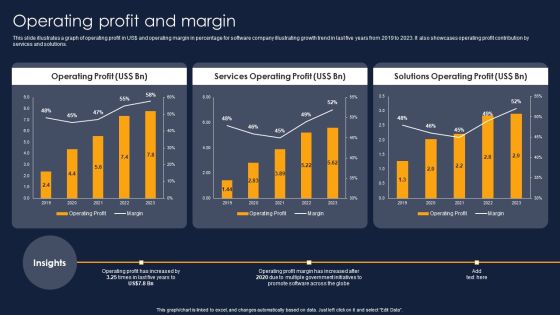
Operating Profit And Margin Financial Performance Report Of Software Firm Themes PDF
This slide illustrates a graph of operating profit in US doller and operating margin in percentage for software company illustrating growth trend in last five years from 2019 to 2023. It also showcases operating profit contribution by services and solutions. Slidegeeks is here to make your presentations a breeze with Operating Profit And Margin Financial Performance Report Of Software Firm Themes PDF With our easy-to-use and customizable templates, you can focus on delivering your ideas rather than worrying about formatting. With a variety of designs to choose from, you are sure to find one that suits your needs. And with animations and unique photos, illustrations, and fonts, you can make your presentation pop. So whether you are giving a sales pitch or presenting to the board, make sure to check out Slidegeeks first.
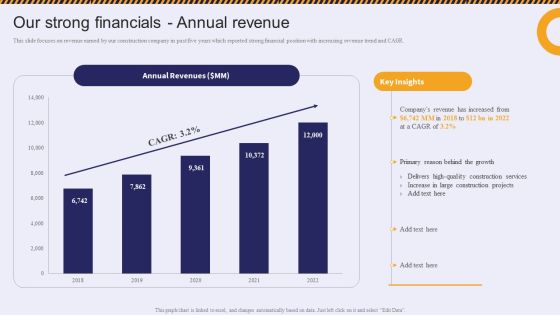
Our Strong Financials Annual Revenue Residential And Commercial Building Construction Topics PDF
This slide focuses on revenue earned by our construction company in past five years which reported strong financial position with increasing revenue trend and CAGR.This Our Strong Financials Annual Revenue Residential And Commercial Building Construction Topics PDF from Slidegeeks makes it easy to present information on your topic with precision. It provides customization options, so you can make changes to the colors, design, graphics, or any other component to create a unique layout. It is also available for immediate download, so you can begin using it right away. Slidegeeks has done good research to ensure that you have everything you need to make your presentation stand out. Make a name out there for a brilliant performance.
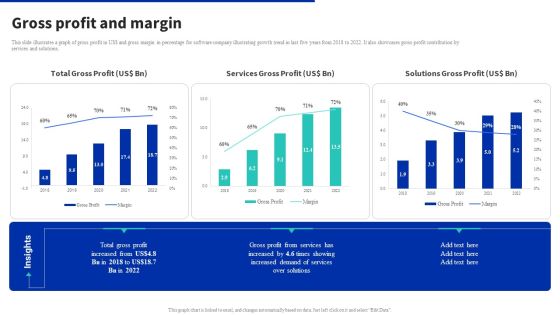
Digital Products Company Outline Gross Profit And Margin Professional PDF
This slide illustrates a graph of gross profit in US dollar and gross margin in percentage for software company illustrating growth trend in last five years from 2018 to 2022. It also showcases gross profit contribution by services and solutions. Get a simple yet stunning designed Digital Products Company Outline Gross Profit And Margin Professional PDF. It is the best one to establish the tone in your meetings. It is an excellent way to make your presentations highly effective. So, download this PPT today from Slidegeeks and see the positive impacts. Our easy to edit Digital Products Company Outline Gross Profit And Margin Professional PDF can be your go to option for all upcoming conferences and meetings. So, what are you waiting for Grab this template today.

Digital Products Company Outline Operating Profit And Margin Structure PDF
This slide illustrates a graph of operating profit in US dollar and operating margin in percentage for software company illustrating growth trend in last five years from 2018 to 2022. It also showcases operating profit contribution by services and solutions. Present like a pro with Digital Products Company Outline Operating Profit And Margin Structure PDF Create beautiful presentations together with your team, using our easy to use presentation slides. Share your ideas in real time and make changes on the fly by downloading our templates. So whether you are in the office, on the go, or in a remote location, you can stay in sync with your team and present your ideas with confidence. With Slidegeeks presentation got a whole lot easier. Grab these presentations today.
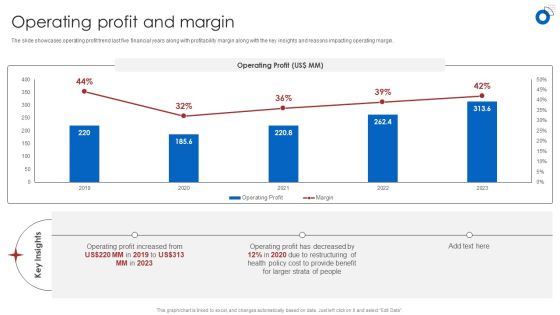
Insurance Business Financial Analysis Operating Profit And Margin Ppt Styles Structure PDF
The slide showcases operating profit trend last five financial years along with profitability margin along with the key insights and reasons impacting operating margin. Formulating a presentation can take up a lot of effort and time, so the content and message should always be the primary focus. The visuals of the PowerPoint can enhance the presenters message, so our Insurance Business Financial Analysis Operating Profit And Margin Ppt Styles Structure PDF was created to help save time. Instead of worrying about the design, the presenter can concentrate on the message while our designers work on creating the ideal templates for whatever situation is needed. Slidegeeks has experts for everything from amazing designs to valuable content, we have put everything into Insurance Business Financial Analysis Operating Profit And Margin Ppt Styles Structure PDF.
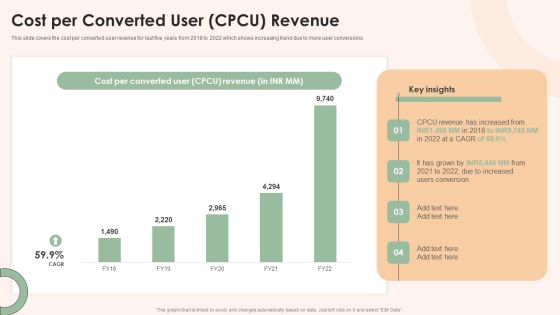
Online Advertising Firm Business Profile Cost Per Converted User CPCU Revenue Information PDF
This slide covers the cost per converted user revenue for last five years from 2018 to 2022 which shows increasing trend due to more user conversions Get a simple yet stunning designed Online Advertising Firm Business Profile Cost Per Converted User CPCU Revenue Information PDF. It is the best one to establish the tone in your meetings. It is an excellent way to make your presentations highly effective. So, download this PPT today from Slidegeeks and see the positive impacts. Our easy to edit Online Advertising Firm Business Profile Cost Per Converted User CPCU Revenue Information PDF can be your go to option for all upcoming conferences and meetings. So, what are you waiting for Grab this template today.

Ppt Theme Company Pre Procedure In Five Horizontal And Vertical Rulers Stages 4 Design
We present our PPT Theme Company pre procedure in five horizontal and vertical ruler's stages 4 design. Use our Arrows PowerPoint Templates because, the ideas and plans are on your finger tips. Use our Boxes PowerPoint Templates because, Targets: - You have a handle on all the targets, a master of the game, the experienced and consummate juggler. Use our Symbol PowerPoint Templates because; illustrate your plans on using the many social media modes available to inform society at large of the benefits of your product. Use our Process and Flows PowerPoint Templates because, All elements of the venture are equally critical. Use our Marketing PowerPoint Templates because; Take your team along by explaining your plans. Use these PowerPoint slides for presentations relating to Account, Arrow, Arrows, Away, Box, Business, Chart, Choice, Choose, Concept, Concepts, Consultation, Corporate, Design, Diagram, Direction, Elements, Flow, Follow, Follows, Future, Group, Grow, Increase, Lines, Many, Month, Move, Past, Period, Phase, Project, Report, Rise, Row, Step, Success, Text, Time, Timeline, Today, Up, Way, Ways, Work, Year. The prominent colors used in the PowerPoint template are Blue, Gray, and Black

Product Inauguration Event Planning And Administration Event Planning And Management Download PDF
This slide provides an overview of ABC event planning company. The slide includes founder, founded year, headquarter, industry, awards and achievements, services and revenue of past five years. Coming up with a presentation necessitates that the majority of the effort goes into the content and the message you intend to convey. The visuals of a PowerPoint presentation can only be effective if it supplements and supports the story that is being told. Keeping this in mind our experts created Product Inauguration Event Planning And Administration Event Planning And Management Download PDF to reduce the time that goes into designing the presentation. This way, you can concentrate on the message while our designers take care of providing you with the right template for the situation.

Canned Food Company Profile CSR Spend Sample PDF
The slide highlights the corporate social responsibility spend for last five years. It shows CSR spend trend for global and US and total spend split between US and global CSR.Deliver an awe inspiring pitch with this creative Canned Food Company Profile CSR Spend Sample PDF bundle. Topics like Company Is Targeted, Quantum Foods , Global Spend can be discussed with this completely editable template. It is available for immediate download depending on the needs and requirements of the user.
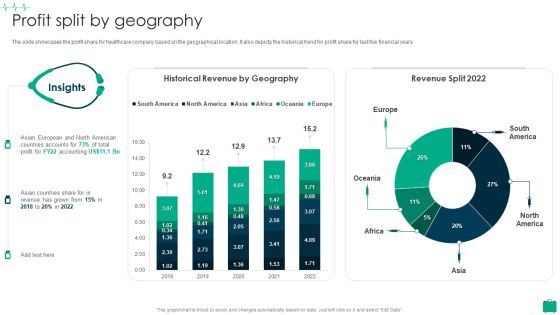
Healthcare Services Company Profile Profit Split By Geography Sample PDF
The slide showcases the profit share for healthcare company based on the geographical location. It also depicts the historical trend for profit share for last five financial years. Deliver an awe inspiring pitch with this creative Healthcare Services Company Profile Profit Split By Geography Sample PDF bundle. Topics like Historical Revenue, Countries Accounts, Geography can be discussed with this completely editable template. It is available for immediate download depending on the needs and requirements of the user.
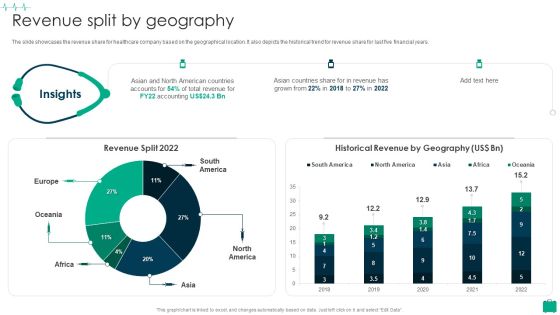
Healthcare Services Company Profile Revenue Split By Geography Summary PDF
The slide showcases the revenue share for healthcare company based on the geographical location. It also depicts the historical trend for revenue share for last five financial years.Deliver an awe inspiring pitch with this creative Healthcare Services Company Profile Revenue Split By Geography Summary PDF bundle. Topics like American Countries, Asian Countries, Historical Revenue can be discussed with this completely editable template. It is available for immediate download depending on the needs and requirements of the user.
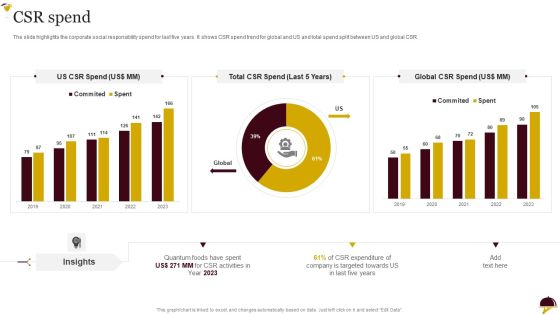
Food Company Overview CSR Spend Brochure PDF
The slide highlights the corporate social responsibility spend for last five years. It shows CSR spend trend for global and US and total spend split between US and global CSR.Deliver and pitch your topic in the best possible manner with this Food Company Overview CSR Spend Brochure PDF. Use them to share invaluable insights on Quantum Foods, Targeted Towards, Insights and impress your audience. This template can be altered and modified as per your expectations. So, grab it now.

Packaged Food Firm Description CSR Spend Summary PDF
The slide highlights the corporate social responsibility spend for last five years. It shows CSR spend trend for global and US and total spend split between US and global CSR.Deliver and pitch your topic in the best possible manner with this Packaged Food Firm Description CSR Spend Summary PDF. Use them to share invaluable insights on Expenditure Of Company, Targeted Towards, CSR Activities and impress your audience. This template can be altered and modified as per your expectations. So, grab it now.

Hospital Medical Research Company Profile Profit Split By Geography Structure PDF
The slide showcases the profit share for healthcare company based on the geographical location. It also depicts the historical trend for profit share for last five financial years. Deliver an awe inspiring pitch with this creative Hospital Medical Research Company Profile Profit Split By Geography Structure PDF bundle. Topics like Shareholding March 2022, FII Shareholding Region, Shareholding March 2022 can be discussed with this completely editable template. It is available for immediate download depending on the needs and requirements of the user.

Clinical Services Company Profile Profit Split By Geography Infographics PDF
The slide showcases the profit share for healthcare company based on the geographical location. It also depicts the historical trend for profit share for last five financial years. Deliver and pitch your topic in the best possible manner with this Clinical Services Company Profile Profit Split By Geography Infographics PDF. Use them to share invaluable insights on Historical Revenue By Geography, Revenue Split and impress your audience. This template can be altered and modified as per your expectations. So, grab it now.

Clinical Services Company Profile Revenue Split By Geography Graphics PDF
The slide showcases the revenue share for healthcare company based on the geographical location. It also depicts the historical trend for revenue share for last five financial years. Deliver an awe inspiring pitch with this creative Clinical Services Company Profile Revenue Split By Geography Graphics PDF bundle. Topics like Revenue Split, Historical Revenue By Geography can be discussed with this completely editable template. It is available for immediate download depending on the needs and requirements of the user.
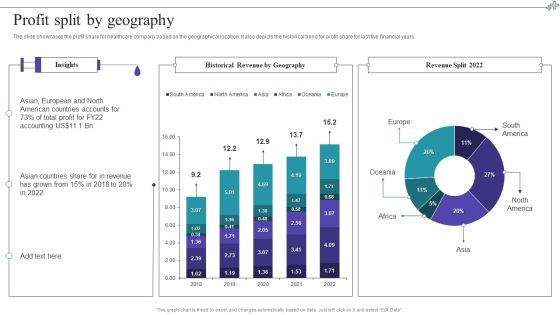
Medical Care Company Overview Profit Split By Geography Inspiration PDF
The slide showcases the profit share for healthcare company based on the geographical location. It also depicts the historical trend for profit share for last five financial years. Deliver an awe inspiring pitch with this creative Medical Care Company Overview Profit Split By Geography Inspiration PDF bundle. Topics like Profit Split By Geography can be discussed with this completely editable template. It is available for immediate download depending on the needs and requirements of the user.

Medical Care Company Overview Revenue Split By Geography Portrait PDF
The slide showcases the revenue share for healthcare company based on the geographical location. It also depicts the historical trend for revenue share for last five financial years. Deliver an awe inspiring pitch with this creative Medical Care Company Overview Revenue Split By Geography Portrait PDF bundle. Topics like Revenue Split By Geography can be discussed with this completely editable template. It is available for immediate download depending on the needs and requirements of the user.
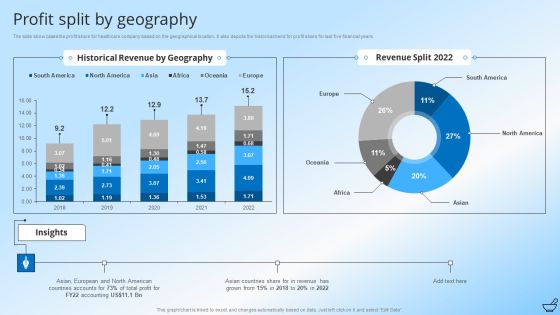
Pharmaceutical And Clinical Research Summary Profit Split By Geography Designs PDF
The slide showcases the profit share for healthcare company based on the geographical location. It also depicts the historical trend for profit share for last five financial years. Deliver an awe inspiring pitch with this creative Pharmaceutical And Clinical Research Summary Profit Split By Geography Designs PDF bundle. Topics like Revenue, Profit Split By Geography can be discussed with this completely editable template. It is available for immediate download depending on the needs and requirements of the user.

Pharmaceutical And Clinical Research Summary Revenue Split By Geography Themes PDF
The slide showcases the revenue share for healthcare company based on the geographical location. It also depicts the historical trend for revenue share for last five financial years. Deliver an awe inspiring pitch with this creative Pharmaceutical And Clinical Research Summary Revenue Split By Geography Themes PDF bundle. Topics like Historical Revenue By Geography, Revenue Split can be discussed with this completely editable template. It is available for immediate download depending on the needs and requirements of the user.
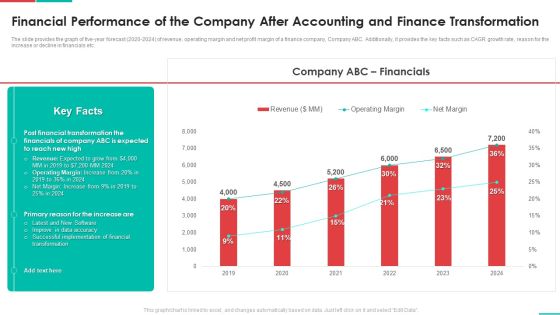
Roadmap For Financial Accounting Transformation Financial Performance Of The Company After Accounting Elements PDF
The slide provides the graph of five-year forecast 2020-2024 of revenue, operating margin and net profit margin of a finance company, Company ABC. Additionally, it provides the key facts such as CAGR growth rate, reason for the increase or decline in financials etc. Deliver and pitch your topic in the best possible manner with this roadmap for financial accounting transformation financial performance of the company after accounting elements pdf. Use them to share invaluable insights on implementation, financial, data accuracy, revenue and impress your audience. This template can be altered and modified as per your expectations. So, grab it now.

Global Healthcare Device Sale Trends Microsoft PDF
This slide shows international market sale trends that can be used to frame future marketing strategies to boost overall revenue of organization. It include projected sales over next five years, current growth data and top global players etc.Showcasing this set of slides titled Global Healthcare Device Sale Trends Microsoft PDF. The topics addressed in these templates are Market Growth, Incremental Growth, Growth Current. All the content presented in this PPT design is completely editable. Download it and make adjustments in color, background, font etc. as per your unique business setting.

Comprehensive Guide To Build Marketing Roi Projection For Early Stage Startup Structure PDF
The following slide showcases return on investment ROI of new established business for five years. It covers information about company projected sales, cost of goods sold COGS, gross profit GP, operating expenses, etc. From laying roadmaps to briefing everything in detail, our templates are perfect for you. You can set the stage with your presentation slides. All you have to do is download these easy-to-edit and customizable templates. Comprehensive Guide To Build Marketing Roi Projection For Early Stage Startup Structure PDF will help you deliver an outstanding performance that everyone would remember and praise you for. Do download this presentation today.

Pharmaceutical Company Financial Summary Net Profit And Margin Structure PDF
The slide showcases the bottom line for healthcare group along with net profit margin for last five financial year. It also depict net profit share for FY22 from pharmacy, hospital and research business verticals. From laying roadmaps to briefing everything in detail, our templates are perfect for you. You can set the stage with your presentation slides. All you have to do is download these easy-to-edit and customizable templates. Pharmaceutical Company Financial Summary Net Profit And Margin Structure PDF will help you deliver an outstanding performance that everyone would remember and praise you for. Do download this presentation today.

Market Valuation Of The Selling Company Investment Banking And Deal Pitchbook Mockup PDF
The slide provides the market valuation of our company XYZ company by discounting the free cash flows of the company from next five years.The Market Valuation Of The Selling Company Investment Banking And Deal Pitchbook Mockup PDF is a compilation of the most recent design trends as a series of slides. It is suitable for any subject or industry presentation, containing attractive visuals and photo spots for businesses to clearly express their messages. This template contains a variety of slides for the user to input data, such as structures to contrast two elements, bullet points, and slides for written information. Slidegeeks is prepared to create an impression.

Buy Side M And A Service Overview Of The Target Companys Operations Download PDF
This slide gives an overview of the target companys operations. For the last five years, a business summary contains a firm introduction, missionand vision statement, financial highlights, and non-performing assets. From laying roadmaps to briefing everything in detail, our templates are perfect for you. You can set the stage with your presentation slides. All you have to do is download these easy-to-edit and customizable templates. Buy Side M And A Service Overview Of The Target Companys Operations Download PDF will help you deliver an outstanding performance that everyone would remember and praise you for. Do download this presentation today.
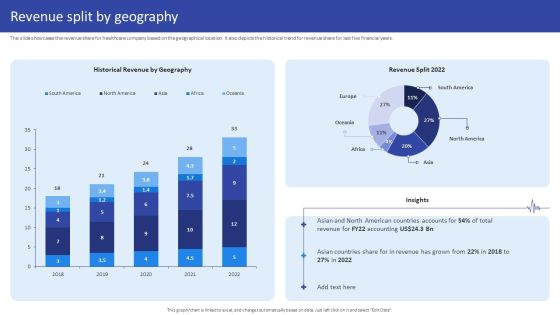
Hospital Medical Research Company Profile Revenue Split By Geography Portrait PDF
The slide showcases the revenue share for healthcare company based on the geographical location. It also depicts the historical trend for revenue share for last five financial years. Deliver and pitch your topic in the best possible manner with this Hospital Medical Research Company Profile Revenue Split By Geography Portrait PDF. Use them to share invaluable insights on Historical Revenue Geography, Revenue Split 2022, 2018 To 2022 and impress your audience. This template can be altered and modified as per your expectations. So, grab it now.

Profit Split By Geography Life Science And Healthcare Solutions Company Profile Graphics PDF
The slide showcases the profit share for healthcare company based on the geographical location. It also depicts the historical trend for profit share for last five financial years. If your project calls for a presentation, then Slidegeeks is your go-to partner because we have professionally designed, easy-to-edit templates that are perfect for any presentation. After downloading, you can easily edit Profit Split By Geography Life Science And Healthcare Solutions Company Profile Graphics PDF and make the changes accordingly. You can rearrange slides or fill them with different images. Check out all the handy templates

Companys Workforce Management System One Pager Documents
This slide indicates the organizations employee management system covering details such as the evaluation system and compensation structure. Also, it provides information about the trend of the company workforce in the past five years. Presenting you a fantastic Companys Workforce Management System One Pager Documents. This piece is crafted on hours of research and professional design efforts to ensure you have the best resource. It is completely editable and its design allow you to rehash its elements to suit your needs. Get this Companys Workforce Management System One Pager Documents A4 One-pager now.

Smart Grid Technology Market Size Of Smart Grid Technology Icons PDF
This slide talks about the levels of the smart grid maturity model, including default, initiating, enabling, integrating, optimizing and pioneering. The utilitys main participants discuss choosing which levels in each of the domains they want to drive the organization in the next five, ten, or fifteen years. Welcome to our selection of the Smart Grid Technology Market Size Of Smart Grid Technology Icons PDF. These are designed to help you showcase your creativity and bring your sphere to life. Planning and Innovation are essential for any business that is just starting out. This collection contains the designs that you need for your everyday presentations. All of our PowerPoints are 100 percent editable, so you can customize them to suit your needs. This multi purpose template can be used in various situations. Grab these presentation templates today.

Food Organization Financial Trends Company Overview Ppt Pictures Backgrounds PDF
The slide highlights the company overview illustrating its business details company name, chief executive officer, founders, incorporated year, headquarter, employee count, type, annual revenue, and net income. It also shows the top five brands, awards and achievements, and brand value. Boost your pitch with our creative Food Organization Financial Trends Company Overview Ppt Pictures Backgrounds PDF. Deliver an awe-inspiring pitch that will mesmerize everyone. Using these presentation templates you will surely catch everyones attention. You can browse the ppts collection on our website. We have researchers who are experts at creating the right content for the templates. So you dont have to invest time in any additional work. Just grab the template now and use them.
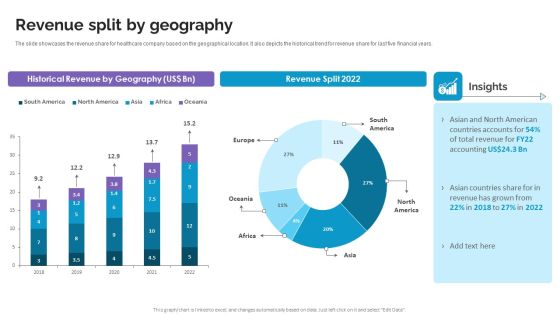
Revenue Split By Geography Life Science And Healthcare Solutions Company Profile Brochure PDF
The slide showcases the revenue share for healthcare company based on the geographical location. It also depicts the historical trend for revenue share for last five financial years. Are you in need of a template that can accommodate all of your creative concepts This one is crafted professionally and can be altered to fit any style. Use it with Google Slides or PowerPoint. Include striking photographs, symbols, depictions, and other visuals. Fill, move around, or remove text boxes as desired. Test out color palettes and font mixtures. Edit and save your work, or work with colleagues. Download Revenue Split By Geography Life Science And Healthcare Solutions Company Profile Brochure PDF and observe how to make your presentation outstanding. Give an impeccable presentation to your group and make your presentation unforgettable.

Arrows Graphical View Of Different Aspects Circlar Charts And Diagrams PowerPoint Templates
We present our arrows graphical view of different aspects circlar Charts and Diagrams PowerPoint templates.Use our Business PowerPoint Templates because like the famed William Tell, they put aside all emotions and concentrate on the target. Download our Flow Charts PowerPoint Templates because you can Amplify your views, ideas and thoughts from very basic aspects to the highly technical and complicated issus using this template as a tool. Present our Ring Charts PowerPoint Templates because this slide shows each path to the smallest detail. Present our Shapes PowerPoint Templates because it describes the benefits of healthy food habits and lifestyles in respect of vital organs of the human anatomy. Use our Process and Flows PowerPoint Templates because this diagram helps you to harness the opportunities, celebrate your performance till date and focus on greater growth and expansion in coming years.Use these PowerPoint slides for presentations relating to Arrows, Blank, Business, Chart, Circle, Circular, Circulation, Concept, Conceptual, Converging, Design, Diagram, Empty, Executive, Five, Icon, Illustration, Management, Pointing, Procedure, Process, Relationship, Resource, Sequence, Sequential, Strategy, Template. The prominent colors used in the PowerPoint template are Pink, Gray, White. Presenters tell us our arrows graphical view of different aspects circlar Charts and Diagrams PowerPoint templates help you meet deadlines which are an element of today's workplace. Just browse and pick the slides that appeal to your intuitive senses. We assure you our Circulation PowerPoint templates and PPT Slides are Perfect. Presenters tell us our arrows graphical view of different aspects circlar Charts and Diagrams PowerPoint templates are Nifty. Use our Circulation PowerPoint templates and PPT Slides are Perfect. We assure you our arrows graphical view of different aspects circlar Charts and Diagrams PowerPoint templates are Detailed. You can be sure our Business PowerPoint templates and PPT Slides are Perfect.
 Home
Home