5 Year Business Plan
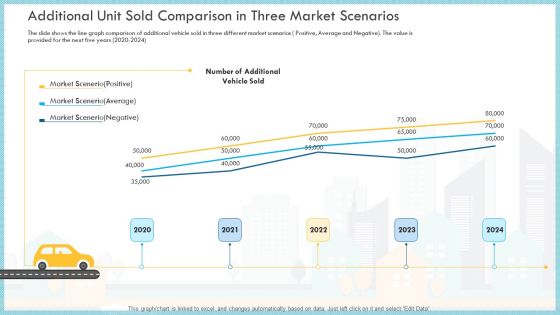
Additional Unit Sold Comparison In Three Market Scenarios Sold Themes PDF
The slide shows the line graph comparison of additional vehicle sold in three different market scenarios Positive, Average and Negative. The value is provided for the next five years 2020 to 2024 Deliver an awe inspiring pitch with this creative additional unit sold comparison in three market scenarios sold themes pdf bundle. Topics like market scenario positive, market scenario average, market scenario negative can be discussed with this completely editable template. It is available for immediate download depending on the needs and requirements of the user.
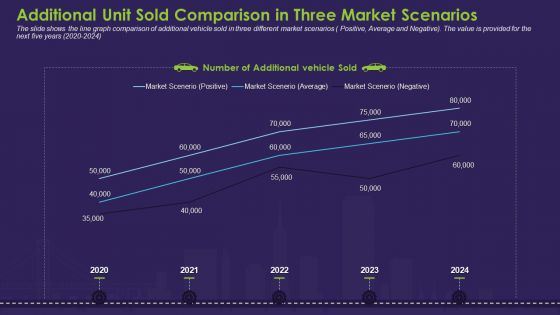
Additional Unit Sold Comparison In Three Market Scenarios Introduction PDF
The slide shows the line graph comparison of additional vehicle sold in three different market scenarios Positive, Average and Negative. The value is provided for the next five years 2020 to 2024.Deliver an awe-inspiring pitch with this creative additional unit sold comparison in three market scenarios introduction pdf. bundle. Topics like market scenario, positive, market scenario average, market scenario negative, 2020 to 2024 can be discussed with this completely editable template. It is available for immediate download depending on the needs and requirements of the user.
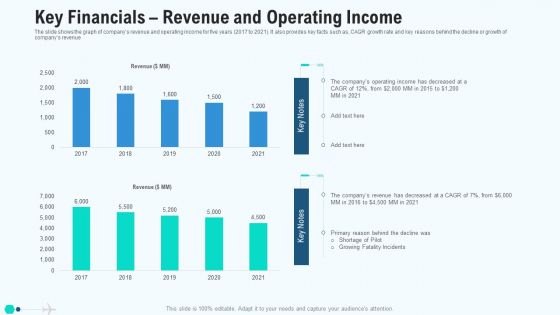
Key Financials Revenue And Operating Income Graphics PDF
The slide shows the graph of companys revenue and operating income for five years 2017 to 2021. It also provides key facts such as, CAGR growth rate and key reasons behind the decline or growth of companys revenue. Deliver an awe inspiring pitch with this creative key financials revenue and operating income graphics pdf bundle. Topics like key financials revenue and operating income can be discussed with this completely editable template. It is available for immediate download depending on the needs and requirements of the user.

Post Implementation Other Operation And Financial Kpis Summary PDF
The slide provides five years graphs 2022F to 2026F forecasted number of major KPIs key performance indicators, that might help to track the performance of ABC Railway. Covered KPIs include Revenue, Total Passengers, operating income, customer satisfaction rate etc.Deliver and pitch your topic in the best possible manner with this post implementation other operation and financial KPIs summary pdf. Use them to share invaluable insights on total passengers, operating income, revenue, 2022 to 2026 and impress your audience. This template can be altered and modified as per your expectations. So, grab it now.

Key Financials Revenue And Operating Income Topics PDF
The slide shows the graph of companys revenue and operating income for five years 2016 to 2020. It also provides key facts such as, CAGR growth rate and key reasons behind the decline or growth of companys revenue. Deliver and pitch your topic in the best possible manner with this key financials revenue and operating income topics pdf. Use them to share invaluable insights on revenue, operating income, key notes and impress your audience. This template can be altered and modified as per your expectations. So, grab it now.
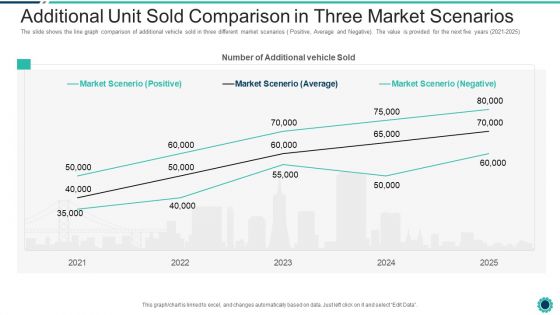
Declining Of A Motor Vehicle Company Additional Unit Sold Comparison In Three Market Scenarios Topics PDF
The slide shows the line graph comparison of additional vehicle sold in three different market scenarios Positive, Average and Negative. The value is provided for the next five years 2021 2025. Deliver an awe inspiring pitch with this creative declining of a motor vehicle company additional unit sold comparison in three market scenarios topics pdf bundle. Topics like market scenarios positive, average, negative can be discussed with this completely editable template. It is available for immediate download depending on the needs and requirements of the user.
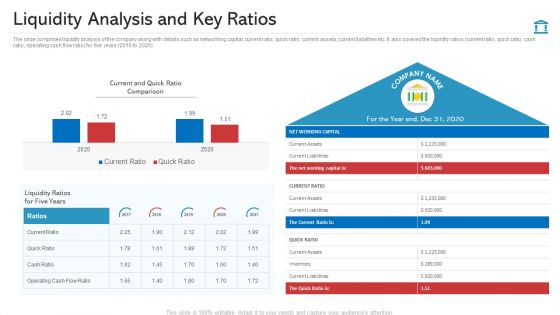
Liquidity Analysis And Key Ratios Structure PDF
The slide comprises liquidity analysis of the company along with details such as networking capital, current ratio, quick ratio, current assets, current liabilities etc. It also covered the liquidity ratios current ratio, quick ratio, cash ratio, operating cash flow ratio for five years 2016 to 2020 Deliver and pitch your topic in the best possible manner with this liquidity analysis and key ratios structure pdf. Use them to share invaluable insights on net working capital, current and quick ratio comparison, current liabilities and impress your audience. This template can be altered and modified as per your expectations. So, grab it now.

Post Implementation Other Operation And Financial Kpis Ppt Infographic Template PDF
The slide provides five years graphs 2020F-2024F forecasted number of major KPIs key performance indicators, that might help to track the performance of ABC Railway. Covered KPIs include Revenue, Total Passengers, operating income, customer satisfaction rate etc. Deliver an awe inspiring pitch with this creative post implementation other operation and financial kpis ppt infographic template pdf bundle. Topics like operating income, revenue, customer satisfaction can be discussed with this completely editable template. It is available for immediate download depending on the needs and requirements of the user.

Key Financials Revenue And Operating Income Ppt Ideas Show PDF
The slide shows the graph of companys revenue and operating income for five years 2016 to 2020. It also provides key facts such as, CAGR growth rate and key reasons behind the decline or growth of companys revenue. Deliver and pitch your topic in the best possible manner with this key financials revenue and operating income ppt ideas show pdf. Use them to share invaluable insights on revenue, operating income and impress your audience. This template can be altered and modified as per your expectations. So, grab it now.
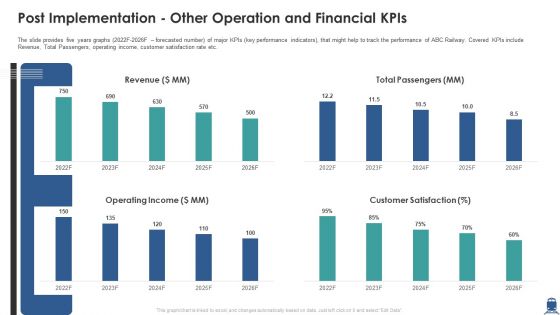
Post Implementation Other Operation And Financial Kpis Inspiration PDF
The slide provides five years graphs 2022F-2026F forecasted number of major KPIs key performance indicators, that might help to track the performance of ABC Railway. Covered KPIs include Revenue, Total Passengers, operating income, customer satisfaction rate etc. Deliver and pitch your topic in the best possible manner with this post implementation other operation and financial kpis inspiration pdf. Use them to share invaluable insights on revenue, operating income, customer satisfaction and impress your audience. This template can be altered and modified as per your expectations. So, grab it now.
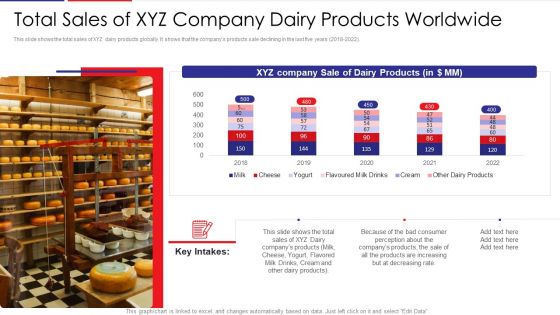
Examination Of Buyer Mindset Towards Dairy Products Total Sales Of XYZ Company Dairy Products Worldwide Template PDF
This slide shows the total sales of XYZ dairy products globally. It shows that the companys products sale declining in the last five years 2018-2022. Deliver an awe inspiring pitch with this creative examination of buyer mindset towards dairy products total sales of xyz company dairy products worldwide template pdf bundle. Topics like total sales of xyz company dairy products worldwide can be discussed with this completely editable template. It is available for immediate download depending on the needs and requirements of the user.
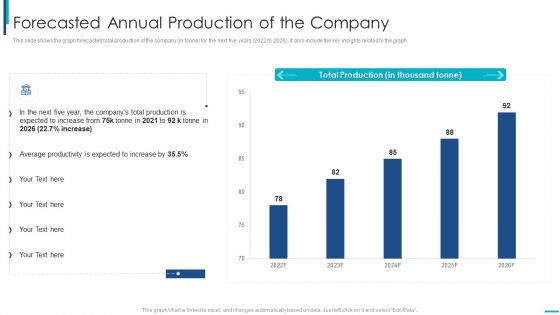
Skill Development Training To Strengthen Employee Performance Forecasted Annual Production Of The Company Brochure PDF
This slide shows the graph forecasted total production of the company in tonne for the next five years 2022 to 2026, It also include the key insights related to the graph. Deliver an awe inspiring pitch with this creative skill development training to strengthen employee performance forecasted annual production of the company brochure pdf bundle. Topics like forecasted annual production of the company can be discussed with this completely editable template. It is available for immediate download depending on the needs and requirements of the user.
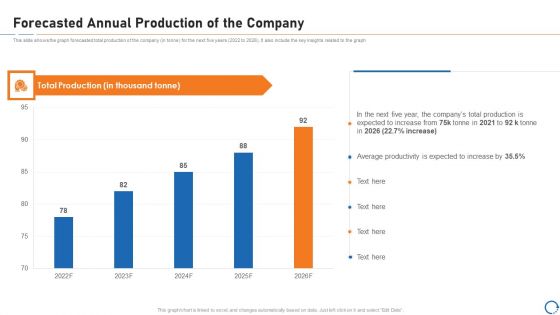
Upskill Training For Employee Performance Improvement Forecasted Annual Production Of The Company Formats PDF
This slide shows the graph forecasted total production of the company in tonne for the next five years 2022 to 2026, It also include the key insights related to the graph. Deliver an awe inspiring pitch with this creative upskill training for employee performance improvement forecasted annual production of the company formats pdf bundle. Topics like forecasted annual production of the company can be discussed with this completely editable template. It is available for immediate download depending on the needs and requirements of the user.

Upskill Training For Employee Performance Improvement Forecasted Employee Efficiency And Average Productivity Mockup PDF
This slide shows the forecasted data of average production per employee in tonne and employee efficiency in percentage for the next five years 2022 to 2026. Deliver and pitch your topic in the best possible manner with this upskill training for employee performance improvement forecasted employee efficiency and average productivity mockup pdf. Use them to share invaluable insights on forecasted employee efficiency and average productivity and impress your audience. This template can be altered and modified as per your expectations. So, grab it now.
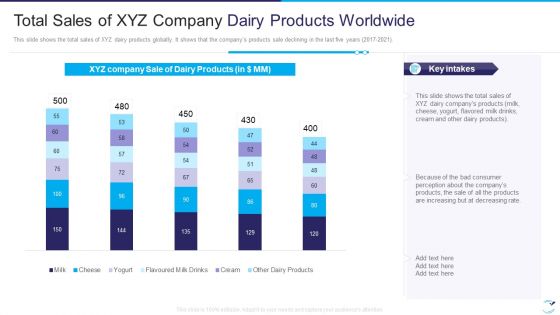
Factor Influencing User Experience Dairy Industry Total Sales Of XYZ Company Dairy Slides PDF
This slide shows the total sales of XYZ dairy products globally. It shows that the companys products sale declining in the last five years 2017-2021. Deliver and pitch your topic in the best possible manner with this factor influencing user experience dairy industry total sales of xyz company dairy slides pdf . Use them to share invaluable insights on total sales of xyz company dairy products worldwide and impress your audience. This template can be altered and modified as per your expectations. So, grab it now.

IT Services And Consulting Company Profile Net Profit And Margin Analysis Diagrams PDF
This slide represents the net profits and margin analysis of company for five years which shows strong position due to reduced operating costs, interest expenses, etc. that allow creditors to know about companys health.Deliver an awe inspiring pitch with this creative IT Services And Consulting Company Profile Net Profit And Margin Analysis Diagrams PDF bundle. Topics like Reduced Expenses, Reduced Operating Costs, Profit Highest can be discussed with this completely editable template. It is available for immediate download depending on the needs and requirements of the user.

IT Services And Consulting Company Profile Research And Development R And D Expenses Elements PDF
This slide shows the research and development expenses incurred by our company in last five years in various areas such as technological change, software testing, etc. to improve productivity and reduce additional costs.Deliver an awe inspiring pitch with this creative IT Services And Consulting Company Profile Research And Development R And D Expenses Elements PDF bundle. Topics like Focuses On Improving, Solutions To Thrive, Competitive Market can be discussed with this completely editable template. It is available for immediate download depending on the needs and requirements of the user.

Construction Services Company Profile Net Profit And Margin Analysis Template PDF
This slide represents the companys net profit and margin for five years which shows strong position due to reduced operating expenses, increased revenue, etc. that allow creditors to know about companys health.Deliver and pitch your topic in the best possible manner with this Construction Services Company Profile Net Profit And Margin Analysis Template PDF Use them to share invaluable insights on Profit Increased, Profit Margin, Operating Expenses and impress your audience. This template can be altered and modified as per your expectations. So, grab it now.
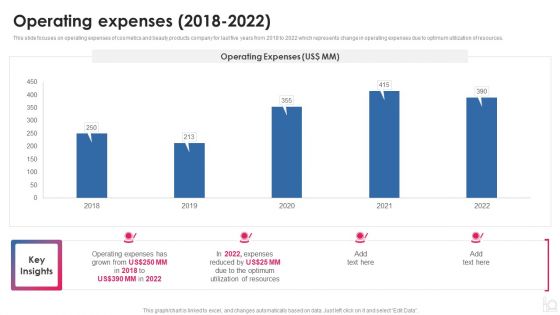
Makeup And Beauty Care Products Company Profile Operating Expenses 2018 To 2022 Elements PDF
This slide focuses on operating expenses of cosmetics and beauty products company for last five years from 2018 to 2022 which represents change in operating expenses due to optimum utilization of resources.Deliver and pitch your topic in the best possible manner with this Makeup And Beauty Care Products Company Profile Operating Expenses 2018 To 2022 Elements PDF Use them to share invaluable insights on Operating Expenses, Expenses Reduced, Utilization Resources and impress your audience. This template can be altered and modified as per your expectations. So, grab it now.
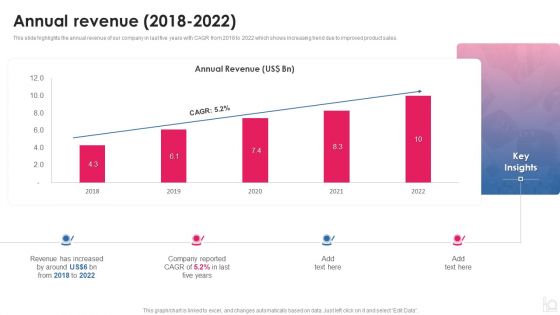
Makeup And Beauty Care Products Company Profile Annual Revenue 2018 To 2022 Sample PDF
This slide highlights the annual revenue of our company in last five years with CAGR from 2018 to 2022 which shows increasing trend due to improved product sales.Deliver and pitch your topic in the best possible manner with this Makeup And Beauty Care Products Company Profile Annual Revenue 2018 To 2022 Sample PDF Use them to share invaluable insights on Revenue Increased, Company Reported, Annual Revenue and impress your audience. This template can be altered and modified as per your expectations. So, grab it now.

Event Management Services Company Profile Financial Highlights Revenue Gross Profit And Net Profit Template PDF
This slide focuses on financial highlights of event management company which represents revenue, gross profit and net profit for last five years from 2018 to 2022.Deliver and pitch your topic in the best possible manner with this Event Management Services Company Profile Financial Highlights Revenue Gross Profit And Net Profit Template PDF Use them to share invaluable insights on Gross Profit, Key Insights, profit increased and impress your audience. This template can be altered and modified as per your expectations. So, grab it now.

Banking Solutions Company Overview Capital Adequacy Ratio Diagrams PDF
The slide highlights the capital adequacy ratio depicting for the time period of five years from 2018 to 2022. It depicts tier 1, tier 2 and common equity tier 1 ratios with key insights. Deliver an awe inspiring pitch with this creative Banking Solutions Company Overview Capital Adequacy Ratio Diagrams PDF bundle. Topics like Capital Adequacy Ratio, Minimum Requirement, Capital Adequacy Ratio can be discussed with this completely editable template. It is available for immediate download depending on the needs and requirements of the user.

Real Estate Construction And Engineering Company Profile Operating Profit And Margin Designs PDF
This slide illustrates a graph of operating profit in US and gross margin in percentage for engineering company illustrating key insights and changes in last five years from 2018 to 2022.Deliver and pitch your topic in the best possible manner with this Real Estate Construction And Engineering Company Profile Operating Profit And Margin Designs PDF. Use them to share invaluable insights on Operating Profit, Insights, Material Prices and impress your audience. This template can be altered and modified as per your expectations. So, grab it now.

Cosmetics And Skin Care Company Profile Operating Expenses 2018 To 2022 Template PDF
This slide focuses on operating expenses of cosmetics and beauty products company for last five years from 2018 to 2022 which represents change in operating expenses due to optimum utilization of resources. Deliver an awe inspiring pitch with this creative Cosmetics And Skin Care Company Profile Operating Expenses 2018 To 2022 Template PDF bundle. Topics like Operating Expenses, Optimum Utilization, 2018 TO 2022 can be discussed with this completely editable template. It is available for immediate download depending on the needs and requirements of the user.
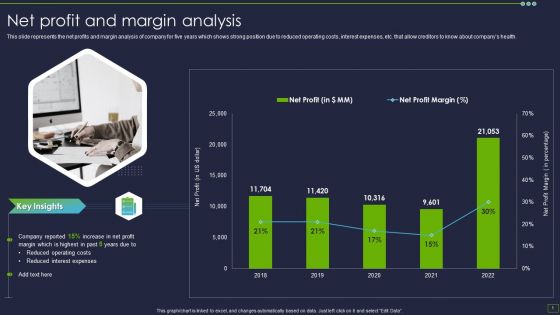
IT Consultancy Services Company Profile Net Profit And Margin Analysis Sample PDF
This slide represents the net profits and margin analysis of company for five years which shows strong position due to reduced operating costs, interest expenses, etc. that allow creditors to know about companys health.Deliver and pitch your topic in the best possible manner with this IT Consultancy Services Company Profile Net Profit And Margin Analysis Sample PDF. Use them to share invaluable insights on Key Insights, Company Reported, Reduced Operating and impress your audience. This template can be altered and modified as per your expectations. So, grab it now.

IT Consultancy Services Company Profile Research And Development Randd Expenses Diagrams PDF
This slide shows the research and development expenses incurred by our company in last five years in various areas such as technological change, software testing, etc. to improve productivity and reduce additional costs.Deliver an awe inspiring pitch with this creative IT Consultancy Services Company Profile Research And Development Randd Expenses Diagrams PDF bundle. Topics like Focuses Improving, Technological Solutions, Competitive Market can be discussed with this completely editable template. It is available for immediate download depending on the needs and requirements of the user.

Beauty And Skincare Products Company Profile Operating Expenses 2018 To 2022 Introduction PDF
This slide focuses on operating expenses of cosmetics and beauty products company for last five years from 2018 to 2022 which represents change in operating expenses due to optimum utilization of resources.Deliver and pitch your topic in the best possible manner with this Beauty And Skincare Products Company Profile Operating Expenses 2018 To 2022 Introduction PDF. Use them to share invaluable insights on Operating Expenses, Expenses Reduced, Utilization Resources and impress your audience. This template can be altered and modified as per your expectations. So, grab it now.
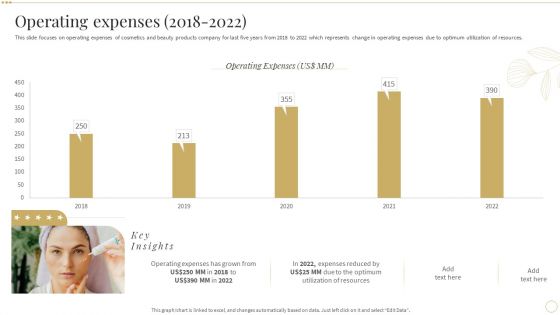
Operating Expenses 2018 2022 Skin Care And Beautifying Products Company Profile Professional PDF
This slide focuses on operating expenses of cosmetics and beauty products company for last five years from 2018 to 2022 which represents change in operating expenses due to optimum utilization of resources.Deliver and pitch your topic in the best possible manner with this Operating Expenses 2018 2022 Skin Care And Beautifying Products Company Profile Professional PDF. Use them to share invaluable insights on Operating Expenses, Expenses Reduced, Utilization Resources and impress your audience. This template can be altered and modified as per your expectations. So, grab it now.
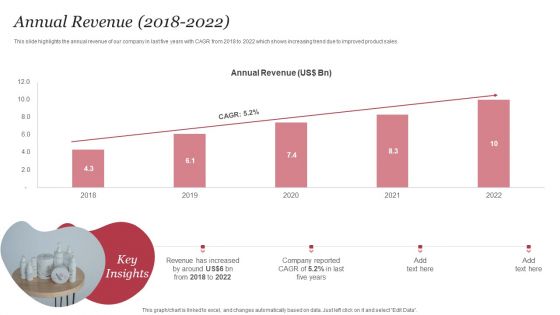
Personal Care Company Profile Annual Revenue 2018 To 2022 Graphics PDF
This slide highlights the annual revenue of our company in last five years with CAGR from 2018 to 2022 which shows increasing trend due to improved product sales. Deliver and pitch your topic in the best possible manner with this Personal Care Company Profile Annual Revenue 2018 To 2022 Graphics PDF. Use them to share invaluable insights on Annual Revenue, Key Insights, Annual Revenue, 2018 To 2022 and impress your audience. This template can be altered and modified as per your expectations. So, grab it now.
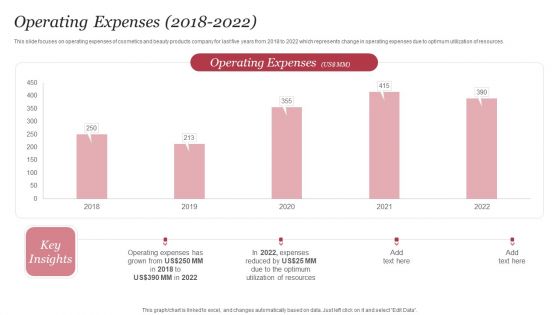
Personal Care Company Profile Operating Expenses 2018 To 2022 Guidelines PDF
This slide focuses on operating expenses of cosmetics and beauty products company for last five years from 2018 to 2022 which represents change in operating expenses due to optimum utilization of resources. Deliver and pitch your topic in the best possible manner with this Personal Care Company Profile Operating Expenses 2018 To 2022 Guidelines PDF. Use them to share invaluable insights on Operating Expenses, 2018 To 2022, Expenses Reduced and impress your audience. This template can be altered and modified as per your expectations. So, grab it now.
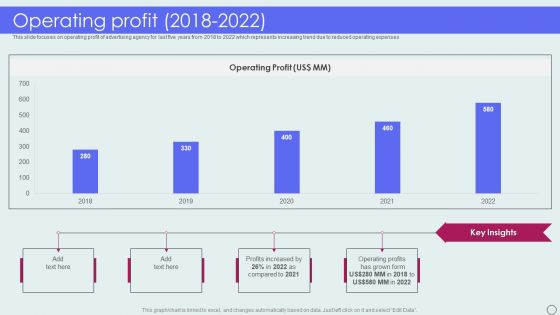
Advertising Solutions Company Details Operating Profit 2018 To 2022 Ppt PowerPoint Presentation Gallery Themes PDF
This slide focuses on operating profit of advertising agency for last five years from 2018 to 2022 which represents increasing trend due to reduced operating expenses. Deliver and pitch your topic in the best possible manner with this Advertising Solutions Company Details Operating Profit 2018 To 2022 Ppt PowerPoint Presentation Gallery Themes PDF. Use them to share invaluable insights on Operating Profit, 2018 To 2022, Profits Increased and impress your audience. This template can be altered and modified as per your expectations. So, grab it now.
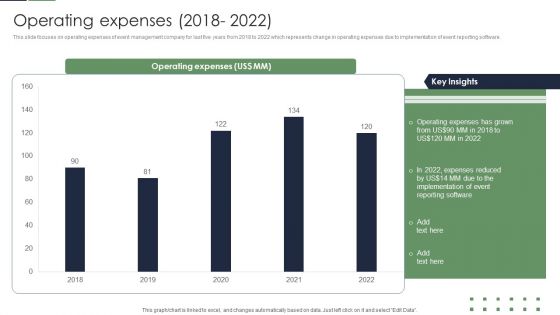
Event Planner Company Profile Operating Expenses 2018 To 2022 Professional PDF
This slide focuses on operating expenses of event management company for last five years from 2018 to 2022 which represents change in operating expenses due to implementation of event reporting software. Deliver and pitch your topic in the best possible manner with this Event Planner Company Profile Operating Expenses 2018 To 2022 Professional PDF. Use them to share invaluable insights on Operating Expenses, Implementation, Expenses Reduced and impress your audience. This template can be altered and modified as per your expectations. So, grab it now.
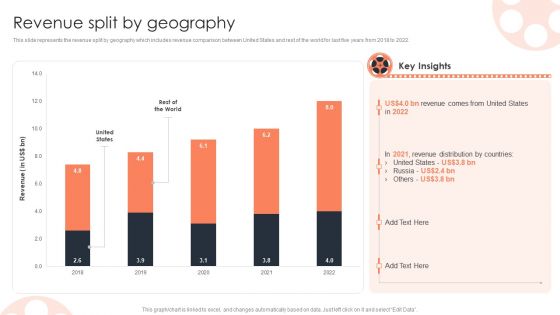
Revenue Split By Geography Film Media Company Profile Ppt PowerPoint Presentation Infographics Infographics PDF
This slide represents the financial highlights of our film production house which includes revenue and net profits for last five years from 2018 to 2022 that shows highest revenue in 2022.Deliver and pitch your topic in the best possible manner with this Revenue Split By Geography Film Media Company Profile Ppt PowerPoint Presentation Infographics Infographics PDF. Use them to share invaluable insights on United States, Revenue Distribution, Key Insights and impress your audience. This template can be altered and modified as per your expectations. So, grab it now.
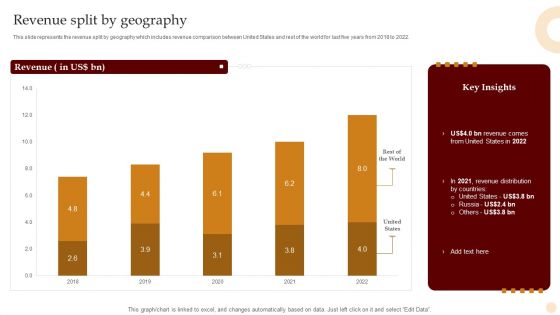
Motion Pictures Production Company Profile Revenue Split By Geography Brochure PDF
This slide represents the revenue split by geography which includes revenue comparison between United States and rest of the world for last five years from 2018 to 2022. Deliver and pitch your topic in the best possible manner with this Motion Pictures Production Company Profile Revenue Split By Geography Brochure PDF. Use them to share invaluable insights on Rest World, United States, 2018 To 2022 and impress your audience. This template can be altered and modified as per your expectations. So, grab it now.
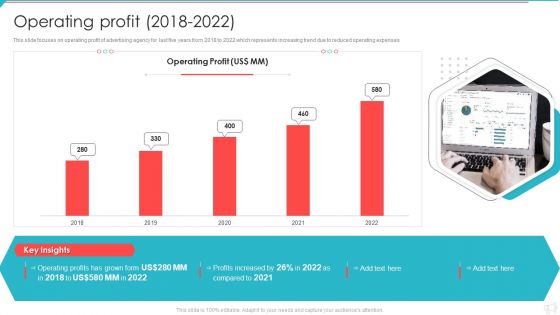
Advertisement And Marketing Agency Company Profile Operating Profit 2018 To 2022 Infographics PDF
This slide focuses on operating profit of advertising agency for last five years from 2018 to 2022 which represents increasing trend due to reduced operating expenses. Deliver and pitch your topic in the best possible manner with this Advertisement And Marketing Agency Company Profile Operating Profit 2018 To 2022 Infographics PDF. Use them to share invaluable insights on Operating Profit, Profits Increased, 2018 To 2022 and impress your audience. This template can be altered and modified as per your expectations. So, grab it now.
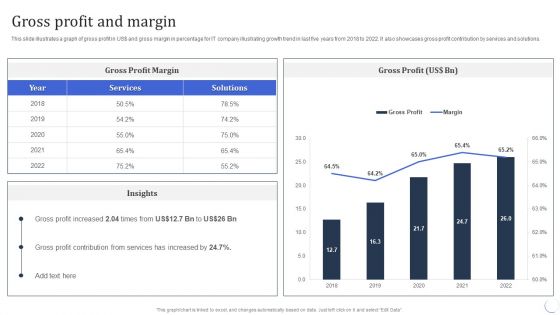
Infotech Solutions Research And Development Company Summary Gross Profit And Margin Ideas PDF
This slide illustrates a graph of gross profit in US dollar and gross margin in percentage for IT company illustrating growth trend in last five years from 2018 to 2022. It also showcases gross profit contribution by services and solutions. Deliver an awe inspiring pitch with this creative Infotech Solutions Research And Development Company Summary Gross Profit And Margin Ideas PDF bundle. Topics like Services, Gross Profit Margin can be discussed with this completely editable template. It is available for immediate download depending on the needs and requirements of the user.
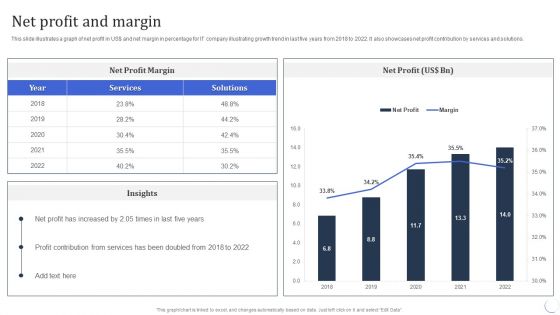
Infotech Solutions Research And Development Company Summary Net Profit And Margin Information PDF
This slide illustrates a graph of net profit in US dollar and net margin in percentage for IT company illustrating growth trend in last five years from 2018 to 2022. It also showcases net profit contribution by services and solutions. Deliver and pitch your topic in the best possible manner with this Infotech Solutions Research And Development Company Summary Net Profit And Margin Information PDF. Use them to share invaluable insights on Profit Contribution, Services, Net Profit and impress your audience. This template can be altered and modified as per your expectations. So, grab it now.
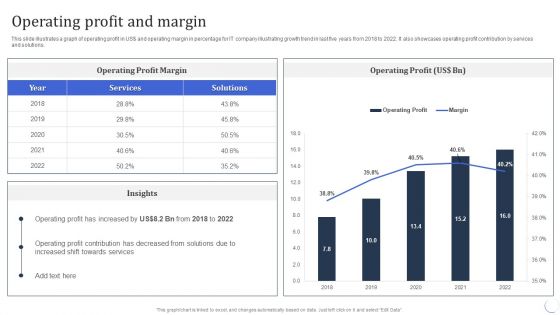
Infotech Solutions Research And Development Company Summary Operating Profit And Margin Download PDF
This slide illustrates a graph of operating profit in US dollar and operating margin in percentage for IT company illustrating growth trend in last five years from 2018 to 2022. It also showcases operating profit contribution by services and solutions. Deliver an awe inspiring pitch with this creative Infotech Solutions Research And Development Company Summary Operating Profit And Margin Download PDF bundle. Topics like Services, Operating Profit can be discussed with this completely editable template. It is available for immediate download depending on the needs and requirements of the user.

Gross Profit And Margin IT Software Development Company Profile Slides PDF
This slide illustrates a graph of gross profit in US doller and gross margin in percentage for IT company illustrating growth trend in last five years from 2018 to 2022. It also showcases gross profit contribution by services and solutions. Deliver and pitch your topic in the best possible manner with this Gross Profit And Margin IT Software Development Company Profile Slides PDF. Use them to share invaluable insights on Gross Profit, Margin and impress your audience. This template can be altered and modified as per your expectations. So, grab it now.
Net Profit And Margin IT Software Development Company Profile Icons PDF
This slide illustrates a graph of net profit in US doller and net margin in percentage for IT company illustrating growth trend in last five years from 2018 to 2022. It also showcases net profit contribution by services and solutions. Deliver an awe inspiring pitch with this creative Net Profit And Margin IT Software Development Company Profile Icons PDF bundle. Topics like Net Profit, Net Profit Margin can be discussed with this completely editable template. It is available for immediate download depending on the needs and requirements of the user.

Operating Profit And Margin IT Software Development Company Profile Guidelines PDF
This slide illustrates a graph of operating profit in US doller and operating margin in percentage for IT company illustrating growth trend in last five years from 2018 to 2022. It also showcases operating profit contribution by services and solutions. Deliver and pitch your topic in the best possible manner with this Operating Profit And Margin IT Software Development Company Profile Guidelines PDF. Use them to share invaluable insights on Operating Profit, Operating Profit Margin and impress your audience. This template can be altered and modified as per your expectations. So, grab it now.
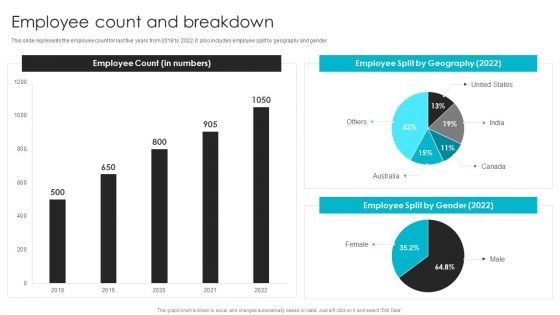
Web Design Company Overview Employee Count And Breakdown Topics PDF
This slide represents the employee count for last five years from 2018 to 2022. It also includes employee split by geography and gender. This Web Design Company Overview Employee Count And Breakdown Topics PDF from Slidegeeks makes it easy to present information on your topic with precision. It provides customization options, so you can make changes to the colors, design, graphics, or any other component to create a unique layout. It is also available for immediate download, so you can begin using it right away. Slidegeeks has done good research to ensure that you have everything you need to make your presentation stand out. Make a name out there for a brilliant performance.
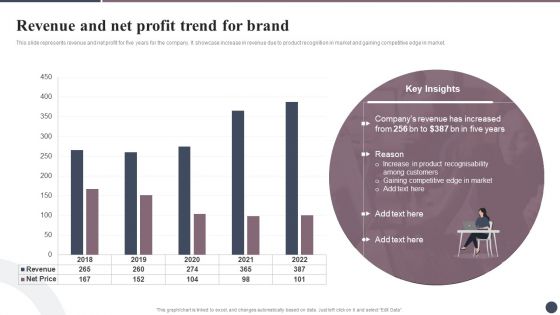
Expanding Target Audience With Cultural Branding Revenue And Net Profit Trend For Brand Clipart PDF
This slide represents revenue and net profit for five years for the company. It showcase increase in revenue due to product recognition in market and gaining competitive edge in market. Want to ace your presentation in front of a live audience Our Expanding Target Audience With Cultural Branding Revenue And Net Profit Trend For Brand Clipart PDF can help you do that by engaging all the users towards you.. Slidegeeks experts have put their efforts and expertise into creating these impeccable powerpoint presentations so that you can communicate your ideas clearly. Moreover, all the templates are customizable, and easy-to-edit and downloadable. Use these for both personal and commercial use.
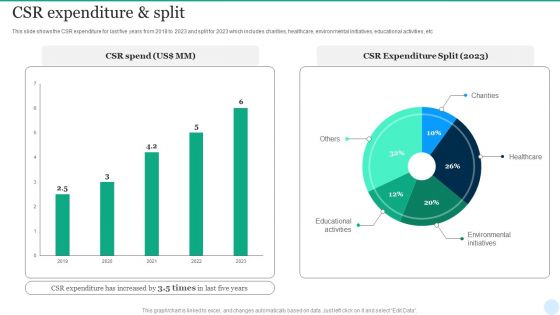
Web Interface Development Services Company Summary CSR Expenditure And Split Topics PDF
This slide shows the CSR expenditure for last five years from 2018 to 2023 and split for 2023 which includes charities, healthcare, environmental initiatives, educational activities, etc. From laying roadmaps to briefing everything in detail, our templates are perfect for you. You can set the stage with your presentation slides. All you have to do is download these easy-to-edit and customizable templates. Web Interface Development Services Company Summary CSR Expenditure And Split Topics PDF will help you deliver an outstanding performance that everyone would remember and praise you for. Do download this presentation today.
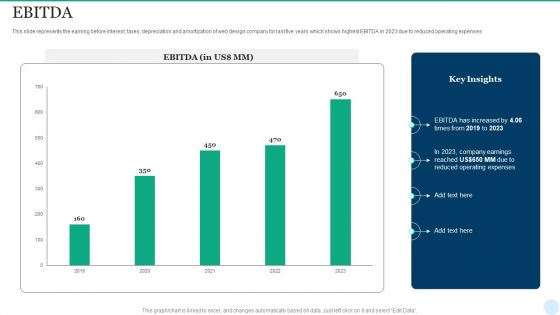
Web Interface Development Services Company Summary EBITDA Structure PDF
This slide represents the earning before interest, taxes, depreciation and amortization of web design company for last five years which shows highest EBITDA in 2023 due to reduced operating expenses. Present like a pro with Web Interface Development Services Company Summary EBITDA Structure PDF Create beautiful presentations together with your team, using our easy-to-use presentation slides. Share your ideas in real-time and make changes on the fly by downloading our templates. So whether youre in the office, on the go, or in a remote location, you can stay in sync with your team and present your ideas with confidence. With Slidegeeks presentation got a whole lot easier. Grab these presentations today.

Website Design And Branding Studio Company Profile EBIDTA Microsoft PDF
This slide represents the earning before interest, taxes, depreciation and amortization of web design company for last five years which shows highest EBITDA in 2022 due to reduced operating expenses. From laying roadmaps to briefing everything in detail, our templates are perfect for you. You can set the stage with your presentation slides. All you have to do is download these easy-to-edit and customizable templates. Website Design And Branding Studio Company Profile EBIDTA Microsoft PDF will help you deliver an outstanding performance that everyone would remember and praise you for. Do download this presentation today.
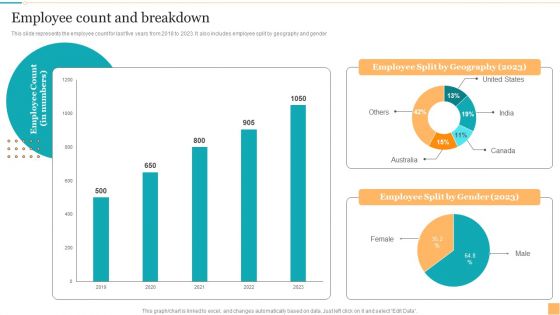
Website Design And Branding Studio Company Profile Employee Count And Breakdown Structure PDF
This slide represents the employee count for last five years from 2018 to 2023. It also includes employee split by geography and gender. Present like a pro with Website Design And Branding Studio Company Profile Employee Count And Breakdown Structure PDF Create beautiful presentations together with your team, using our easy-to-use presentation slides. Share your ideas in real-time and make changes on the fly by downloading our templates. So whether youre in the office, on the go, or in a remote location, you can stay in sync with your team and present your ideas with confidence. With Slidegeeks presentation got a whole lot easier. Grab these presentations today.
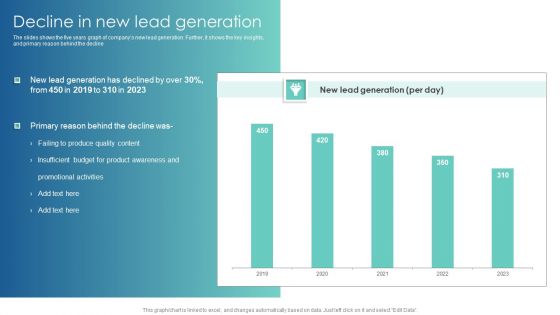
Decline In New Lead Generation Customer Acquisition Through Advertising Designs PDF
The slides shows the five years graph of companys new lead generation. Further, it shows the key insights, and primary reason behind the decline. Slidegeeks is one of the best resources for PowerPoint templates. You can download easily and regulate Decline In New Lead Generation Customer Acquisition Through Advertising Designs PDF for your personal presentations from our wonderful collection. A few clicks is all it takes to discover and get the most relevant and appropriate templates. Use our Templates to add a unique zing and appeal to your presentation and meetings. All the slides are easy to edit and you can use them even for advertisement purposes.
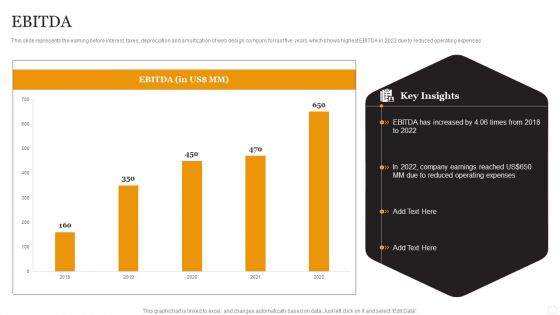
Website Designing Solutions Company Profile EBITDA Structure PDF
This slide represents the earning before interest, taxes, depreciation and amortization of web design company for last five years which shows highest EBITDA in 2022 due to reduced operating expenses. If your project calls for a presentation, then Slidegeeks is your go-to partner because we have professionally designed, easy-to-edit templates that are perfect for any presentation. After downloading, you can easily edit Website Designing Solutions Company Profile EBITDA Structure PDF and make the changes accordingly. You can rearrange slides or fill them with different images. Check out all the handy templates
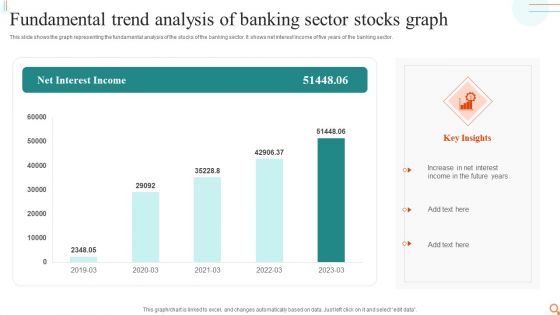
Fundamental Trend Analysis Of Banking Sector Stocks Graph Mockup PDF
This slide shows the graph representing the fundamental analysis of the stocks of the banking sector. It shows net interest income of five years of the banking sector.Pitch your topic with ease and precision using this Fundamental Trend Analysis Of Banking Sector Stocks Graph Mockup PDF. This layout presents information on Increase Interest, Income Future, Interest Income. It is also available for immediate download and adjustment. So, changes can be made in the color, design, graphics or any other component to create a unique layout.

Engineering Services Company Report Gross Profit And Margin Ppt PowerPoint Presentation File Show PDF
This slide illustrates a graph of gross profit in US dollar and gross margin in percentage for engineering company illustrating growth trend in last five years from 2018 to 2022. From laying roadmaps to briefing everything in detail, our templates are perfect for you. You can set the stage with your presentation slides. All you have to do is download these easy-to-edit and customizable templates. Engineering Services Company Report Gross Profit And Margin Ppt PowerPoint Presentation File Show PDF will help you deliver an outstanding performance that everyone would remember and praise you for. Do download this presentation today.
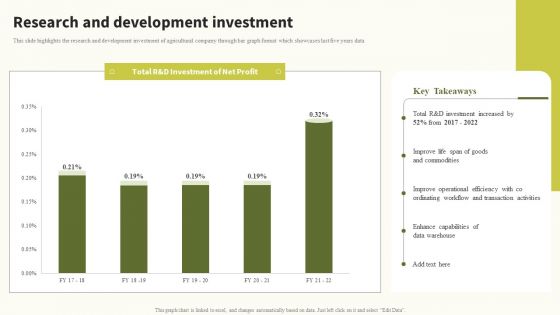
Research And Development Investment Global Food Products Company Profile Information PDF
This slide highlights the research and development investment of agricultural company through bar graph format which showcases last five years data. From laying roadmaps to briefing everything in detail, our templates are perfect for you. You can set the stage with your presentation slides. All you have to do is download these easy-to-edit and customizable templates. Research And Development Investment Global Food Products Company Profile Information PDF will help you deliver an outstanding performance that everyone would remember and praise you for. Do download this presentation today.
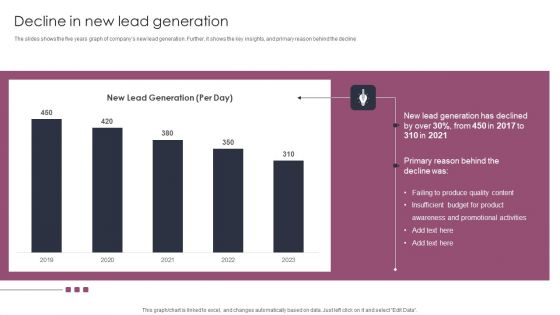
Decline In New Lead Generation Stages To Develop Demand Generation Tactics Topics PDF
The slides shows the five years graph of companys new lead generation. Further, it shows the key insights, and primary reason behind the decline. Present like a pro with Decline In New Lead Generation Stages To Develop Demand Generation Tactics Topics PDF Create beautiful presentations together with your team, using our easy-to-use presentation slides. Share your ideas in real-time and make changes on the fly by downloading our templates. So whether you are in the office, on the go, or in a remote location, you can stay in sync with your team and present your ideas with confidence. With Slidegeeks presentation got a whole lot easier. Grab these presentations today.
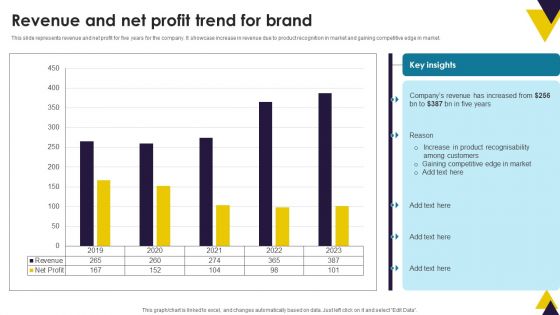
Developing Brand Identity Culture Through Branding Revenue And Net Profit Trend For Brand Brochure PDF
This slide represents revenue and net profit for five years for the company. It showcase increase in revenue due to product recognition in market and gaining competitive edge in market. If your project calls for a presentation, then Slidegeeks is your go to partner because we have professionally designed, easy to edit templates that are perfect for any presentation. After downloading, you can easily edit Developing Brand Identity Culture Through Branding Revenue And Net Profit Trend For Brand Brochure PDF and make the changes accordingly. You can rearrange slides or fill them with different images. Check out all the handy templates

Grow Capital Through Equity Debt Brief Introduction With Revenue Split Background PDF
The slide provides the brief introduction about the company introducing IPO. key points included are business overview, mission, vision, five years financials revenue, operating net margin and revenue split by business operations.Retrieve professionally designed Grow Capital Through Equity Debt Brief Introduction With Revenue Split Background PDF to effectively convey your message and captivate your listeners. Save time by selecting pre-made slideshows that are appropriate for various topics, from business to educational purposes. These themes come in many different styles, from creative to corporate, and all of them are easily adjustable and can be edited quickly. Access them as PowerPoint templates or as Google Slides themes. You do not have to go on a hunt for the perfect presentation because Slidegeeks got you covered from everywhere.
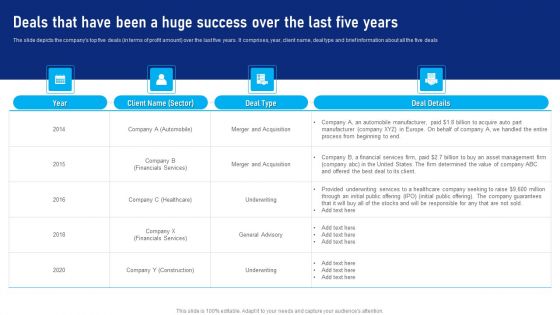
Buy Side Advisory Services In M And A Deals That Have Been A Huge Success Introduction PDF
The slide depicts the companys top five deals in terms of profit amount over the last five years. It comprises, year, client name, deal type and brief information about all the five deals. Are you searching for a Buy Side Advisory Services In M And A Deals That Have Been A Huge Success Introduction PDF that is uncluttered, straightforward, and original Its easy to edit, and you can change the colors to suit your personal or business branding. For a presentation that expresses how much effort you ve put in, this template is ideal With all of its features, including tables, diagrams, statistics, and lists, its perfect for a business plan presentation. Make your ideas more appealing with these professional slides. Download Buy Side Advisory Services In M And A Deals That Have Been A Huge Success Introduction PDF from Slidegeeks today.
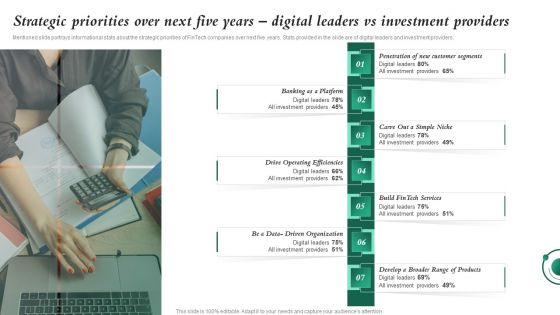
Strategic Priorities Over Next Five Investment In Latest Technology To Ensure Brochure PDF
Mentioned slide portrays informational stats about the strategic priorities of FinTech companies over next five years. Stats provided in the slide are of digital leaders and investment providers.Are you in need of a template that can accommodate all of your creative concepts This one is crafted professionally and can be altered to fit any style. Use it with Google Slides or PowerPoint. Include striking photographs, symbols, depictions, and other visuals. Fill, move around, or remove text boxes as desired. Test out color palettes and font mixtures. Edit and save your work, or work with colleagues. Download Strategic Priorities Over Next Five Investment In Latest Technology To Ensure Brochure PDF and observe how to make your presentation outstanding. Give an impeccable presentation to your group and make your presentation unforgettable.

Equity Debt And Convertible Bond Investment Banking Pitch Book Brief Introduction With Revenue Split Structure PDF
The slide provides the brief introduction about the company introducing IPO. key points included are business overview, mission, vision, five years financials revenue, operating and net margin and revenue split by business operations, Presenting this PowerPoint presentation, titled Equity Debt And Convertible Bond Investment Banking Pitch Book Brief Introduction With Revenue Split Structure PDF, with topics curated by our researchers after extensive research. This editable presentation is available for immediate download and provides attractive features when used. Download now and captivate your audience. Presenting this Equity Debt And Convertible Bond Investment Banking Pitch Book Brief Introduction With Revenue Split Structure PDF. Our researchers have carefully researched and created these slides with all aspects taken into consideration. This is a completely customizable Equity Debt And Convertible Bond Investment Banking Pitch Book Brief Introduction With Revenue Split Structure PDF that is available for immediate downloading. Download now and make an impact on your audience. Highlight the attractive features available with our PPTs.

Gross Profit And Margin Engineering Company Financial Analysis Report Rules PDF
This slide illustrates a graph of gross profit in US dollar and gross margin in percentage for engineering company illustrating growth trend in last five years from 2019 to 2023. Retrieve professionally designed Gross Profit And Margin Engineering Company Financial Analysis Report Rules PDF to effectively convey your message and captivate your listeners. Save time by selecting pre-made slideshows that are appropriate for various topics, from business to educational purposes. These themes come in many different styles, from creative to corporate, and all of them are easily adjustable and can be edited quickly. Access them as PowerPoint templates or as Google Slides themes. You do not have to go on a hunt for the perfect presentation because Slidegeeks got you covered from everywhere.
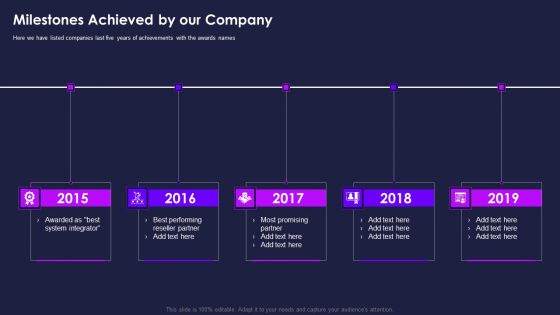
Certification Information Technology Professionals Milestones Achieved By Our Company Mockup PDF
Here we have listed companies last five years of achievements with the awards names This is a certification information technology professionals milestones achieved by our company mockup pdf template with various stages. Focus and dispense information on six stages using this creative set, that comes with editable features. It contains large content boxes to add your information on topics like performing, partner, integrator, promising. You can also showcase facts, figures, and other relevant content using this PPT layout. Grab it now.

 Home
Home