5 Step Infographic

Factors Affecting Work Performance Communication And Cooperation Ppt Powerpoint Presentation Infographics Introduction
This is a factors affecting work performance communication and cooperation ppt powerpoint presentation infographics introduction. This is a four stage process. The stages in this process are business outcomes, business results, business output.
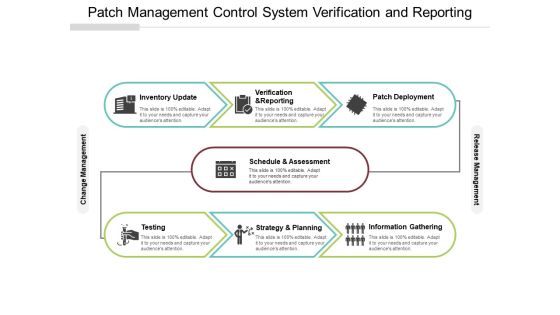
Patch Management Control System Verification And Reporting Ppt PowerPoint Presentation Infographics Backgrounds
This is a patch management control system verification and reporting ppt powerpoint presentation infographics backgrounds. This is a seven stage process. The stages in this process are patch management process, patch management procedure, patch management approach.

Downward Arrow On Bar Graph For Financial Loss Ppt PowerPoint Presentation Infographics Sample
This is a downward arrow on bar graph for financial loss ppt powerpoint presentation infographics sample. This is a three stage process. The stages in this process are business failure, unsuccessful business, business non success.

Implementing Clm Negotiate Approve Track And Renew Ppt PowerPoint Presentation Infographics Objects
This is a implementing clm negotiate approve track and renew ppt powerpoint presentation infographics objects. This is a eight stage process. The stages in this process are contract management, contract negotiation, deal making.

Sprint Planning In Agile Project Management Ppt PowerPoint Presentation Infographics Sample
This is a sprint planning in agile project management ppt powerpoint presentation infographics sample. This is a six stage process. The stages in this process are agile cycle, sprint cycle, scrum cycle.

Internal Customer Satisfaction Responsibilities And Negotiated Priorities Ppt PowerPoint Presentation Infographics Aids
This is a internal customer satisfaction responsibilities and negotiated priorities ppt powerpoint presentation infographics aids. This is a four stage process. The stages in this process are internal customer services, internal customer satisfaction, internal customer management.
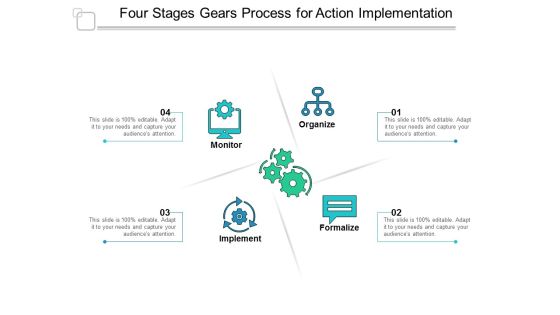
Four Stages Gears Process For Action Implementation Ppt Powerpoint Presentation Infographics Skills
This is a four stages gears process for action implementation ppt powerpoint presentation infographics skills. This is a four stage process. The stages in this process are cycle diagram, circular process, cyclical process.
Seven Stages Stage Cyclic Process With Business Planning Icons Ppt Powerpoint Presentation Infographics Microsoft
This is a seven stages stage cyclic process with business planning icons ppt powerpoint presentation infographics microsoft. This is a seven stage process. The stages in this process are cycle diagram, circular process, cyclical process.
Six Stages Project Planning Cycle With Icons Ppt Powerpoint Presentation Infographics Objects
This is a six stages project planning cycle with icons ppt powerpoint presentation infographics objects. This is a six stage process. The stages in this process are cycle diagram, circular process, cyclical process.
Five Key Questions With Icons Ppt PowerPoint Presentation Infographics Inspiration PDF
Pitch your topic with ease and precision using this five key questions with icons ppt powerpoint presentation infographics inspiration pdf. This layout presents information on five key questions with icons. It is also available for immediate download and adjustment. So, changes can be made in the color, design, graphics or any other component to create a unique layout.
Five Star Ranking With Crown Vector Icon Ppt PowerPoint Presentation File Infographics PDF
Showcasing this set of slides titled five star ranking with crown vector icon ppt powerpoint presentation file infographics pdf. The topics addressed in these templates are five star ranking with crown vector icon. All the content presented in this PPT design is completely editable. Download it and make adjustments in color, background, font etc. as per your unique business setting.
Five Years Timeline For Business Target Achievement Ppt PowerPoint Presentation Icon Infographics PDF
Presenting this set of slides with name five years timeline for business target achievement ppt powerpoint presentation icon infographics pdf. This is a four stage process. The stages in this process are product marketing, operations, 2018 to 2022. This is a completely editable PowerPoint presentation and is available for immediate download. Download now and impress your audience.

Chart Showing Business Five Year Key Performance Indicators Ppt PowerPoint Presentation File Infographics PDF
Presenting this set of slides with name chart showing business five year key performance indicators ppt powerpoint presentation file infographics pdf. The topics discussed in these slides are liabilities, equity, assets. This is a completely editable PowerPoint presentation and is available for immediate download. Download now and impress your audience.
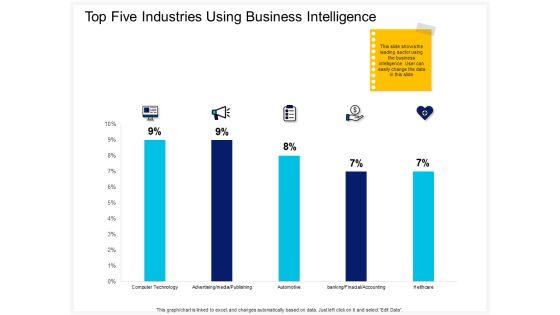
Enterprise Problem Solving And Intellect Top Five Industries Using Business Intelligence Infographics PDF
Presenting this set of slides with name enterprise problem solving and intellect top five industries using business intelligence infographics pdf. The topics discussed in these slides are healthcare, banking, financial, accounting, automotive, advertising, media, publishing, computers and technology. This is a completely editable PowerPoint presentation and is available for immediate download. Download now and impress your audience.

Corporate Intelligence Business Analysis Top Five Industries Using Business Intelligence Infographics PDF
Deliver an awe-inspiring pitch with this creative corporate intelligence business analysis top five industries using business intelligence infographics pdf bundle. Topics like computers and technology, advertising or media or publishing, automotive, healthcare can be discussed with this completely editable template. It is available for immediate download depending on the needs and requirements of the user.

Five Stages Of Metadata Plan With Statistical Analysis Ppt PowerPoint Presentation File Infographics PDF
Presenting five stages of metadata plan with statistical analysis ppt powerpoint presentation file infographics pdf to dispense important information. This template comprises four stages. It also presents valuable insights into the topics including statistical analysis, metadata analysis, develop. This is a completely customizable PowerPoint theme that can be put to use immediately. So, download it and address the topic impactfully.

Mckinsey 7S Model Seven Elements Ppt PowerPoint Presentation Infographics Designs Download
This is a mckinsey 7s model seven elements ppt powerpoint presentation infographics designs download. This is a six stage process. The stages in this process are strategy, structure, systems, staff, style, skills, shared values.
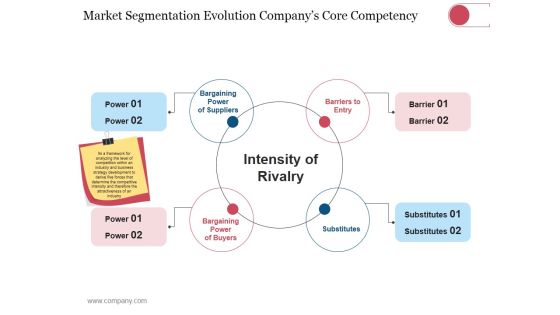
Market Segmentation Evolution Companys Core Competency Template 1 Ppt PowerPoint Presentation Infographics Styles
This is a market segmentation evolution companys core competency template 1 ppt powerpoint presentation infographics styles. This is a four stage process. The stages in this process are bargaining power of suppliers, barriers to entry, bargaining power of buyers, substitutes.
Four Stages Business Process Planning And Controlling Ppt PowerPoint Presentation Infographics Icons
This is a four stages business process planning and controlling ppt powerpoint presentation infographics icons. This is a four stage process. The stages in this process are product lifecycle, management cycle, project cycle.

Internal Sources Of New Product Ideas Ppt PowerPoint Presentation Infographics Inspiration
This is a internal sources of new product ideas ppt powerpoint presentation infographics inspiration. This is a six stage process. The stages in this process are management, employee suggestions, stockholders, sales force, innovation group meetings.

Business Culture Management Stress Training Employability Skills Communication Ppt PowerPoint Presentation Infographics Example
This is a business culture management stress training employability skills communication ppt powerpoint presentation infographics example. This is a seven stage process. The stages in this process are business culture, management stress training, employability skills communication.

Emotional Intelligence Marketing Mix Employees Appraisal Operation Research Ppt PowerPoint Presentation Infographics Layouts
This is a emotional intelligence marketing mix employees appraisal operation research ppt powerpoint presentation infographics layouts. This is a four stage process. The stages in this process are emotional intelligence, marketing mix, employees appraisal, operation research.
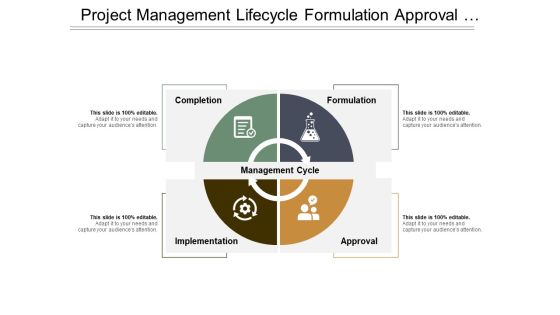
Project Management Lifecycle Formulation Approval Implementation Ppt PowerPoint Presentation Infographics Template
This is a project management lifecycle formulation approval implementation ppt powerpoint presentation infographics template. This is a four stage process. The stages in this process are project management, project management process, project management cycle.
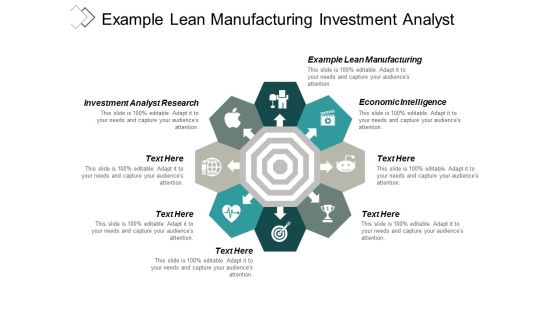
Example Lean Manufacturing Investment Analyst Research Economic Intelligence Ppt PowerPoint Presentation Infographics Demonstration
This is a example lean manufacturing investment analyst research economic intelligence ppt powerpoint presentation infographics demonstration. This is a eight stage process. The stages in this process are example lean manufacturing, investment analyst research, economic intelligence.
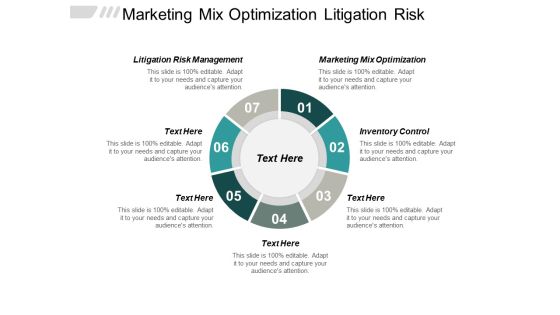
Marketing Mix Optimization Litigation Risk Management Inventory Control Ppt PowerPoint Presentation Infographics Show
This is a marketing mix optimization litigation risk management inventory control ppt powerpoint presentation infographics show. This is a seven stage process. The stages in this process are marketing mix optimization, litigation risk management, inventory control.
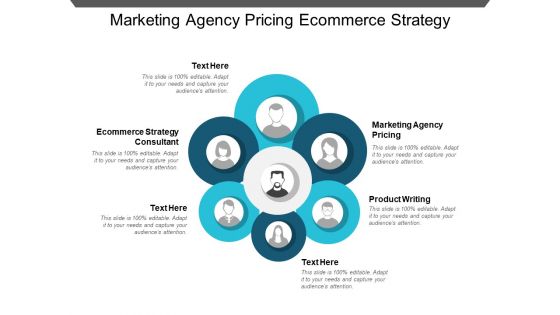
Marketing Agency Pricing Ecommerce Strategy Consultant Product Writing Ppt PowerPoint Presentation Infographics Model
This is a marketing agency pricing ecommerce strategy consultant product writing ppt powerpoint presentation infographics model. This is a six stage process. The stages in this process are marketing agency pricing, ecommerce strategy consultant, product writing.

8 Segments Pie Chart For Data Representation Ppt PowerPoint Presentation Infographics Design Templates
This is a 8 segments pie chart for data representation ppt powerpoint presentation infographics design templates. This is a eight stage process. The stages in this process are 6 piece pie chart, 6 segment pie chart, 6 parts pie chart.

Choose The Right Product Strategy Marketing Ppt Powerpoint Presentation Infographics Guidelines
This is a choose the right product strategy marketing ppt powerpoint presentation infographics guidelines. This is a six stage process. The stages in this process are product strategy, strategic theme, business, management, strategy.
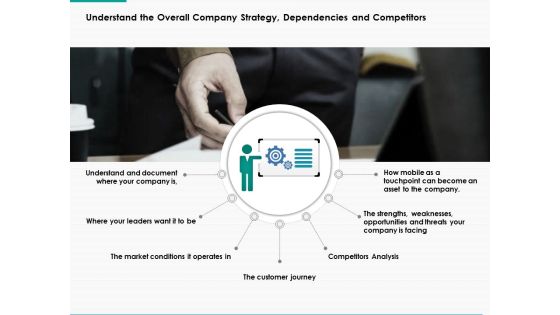
Understand The Overall Company Strategy Dependencies And Competitors Ppt Powerpoint Presentation Infographics Example File
This is a understand the overall company strategy dependencies and competitors ppt powerpoint presentation infographics example file. This is a seven stage process. The stages in this process are business, management, planning, strategy, marketing.

Important Functions Of Marketing Pricing Promotion And Financing Ppt Powerpoint Presentation Infographics Introduction
This is a important functions of marketing pricing promotion and financing ppt powerpoint presentation infographics introduction. This is a seven stage process. The stages in this process are core functions, main functions, key functions.

Risk Identification Communication Ppt Powerpoint Presentation Inspiration Designs Ppt Powerpoint Presentation Infographics Slide Portrait
This is a risk identification communication ppt powerpoint presentation inspiration designs ppt powerpoint presentation infographics slide portrait. This is a six stage process. The stages in this process are identify risks, communication, cost, resources, environmental.

Business Compliance And Operations Planning Strategy Performance Ppt Powerpoint Presentation Infographics Portrait
This is a business compliance and operations planning strategy performance ppt powerpoint presentation infographics portrait. This is a four stage process. The stages in this process are governance model, governance flow, governance structures.

Leadership Role Lean Transformation Process Ppt PowerPoint Presentation Infographics Slide Cpb
This is a leadership role lean transformation process ppt powerpoint presentation infographics slide cpb. This is a two stage process. The stages in this process are leadership role lean transformation process.
Product Road Mapping Process Ppt PowerPoint Presentation Infographics Slide Portrait Cpb
This is a product road mapping process ppt powerpoint presentation infographics slide portrait cpb. This is a six stage process. The stages in this process are product road mapping process.

Information Process Business Management Ppt PowerPoint Presentation Infographics Graphic Images Cpb
This is a information process business management ppt powerpoint presentation infographics graphic images cpb. This is a six stage process. The stages in this process are information process business management.

Pay Per Click Conversion Rate Ppt PowerPoint Presentation Infographics Deck Cpb
This is a pay per click conversion rate ppt powerpoint presentation infographics deck cpb. This is a six stage process. The stages in this process are pay per click conversion rate.

Concentric Sphere Chart Infographics For Determining Business Value Ppt Professional Template PDF
Persuade your audience using this concentric sphere chart infographics for determining business value ppt professional template pdf. This PPT design covers four stages, thus making it a great tool to use. It also caters to a variety of topics including concentric sphere chart infographics for determining business value. Download this PPT design now to present a convincing pitch that not only emphasizes the topic but also showcases your presentation skills.

6 Stage Procedure Flow Infographics Time And Self Management Ppt PowerPoint Presentation Gallery Background Images PDF
Persuade your audience using this 6 stage procedure flow infographics time and self management ppt powerpoint presentation gallery background images pdf. This PPT design covers six stages, thus making it a great tool to use. It also caters to a variety of topics including 6 stage procedure flow infographics time and self management. Download this PPT design now to present a convincing pitch that not only emphasizes the topic but also showcases your presentation skills.

3 Circle Diagram Infographics Of Secure Content Sharing Ppt PowerPoint Presentation File Professional PDF
Persuade your audience using this 3 circle diagram infographics of secure content sharing ppt powerpoint presentation file professional pdf. This PPT design covers three stages, thus making it a great tool to use. It also caters to a variety of topics including 3 circle diagram infographics of secure content sharing. Download this PPT design now to present a convincing pitch that not only emphasizes the topic but also showcases your presentation skills.

3 Arrows In A Sphere Infographics For Retail Demand Forecasting Ppt PowerPoint Presentation Gallery Visuals PDF
Persuade your audience using this 3 arrows in a sphere infographics for retail demand forecasting ppt powerpoint presentation gallery visuals pdf. This PPT design covers three stages, thus making it a great tool to use. It also caters to a variety of topics including 3 arrows in a sphere infographics for retail demand forecasting. Download this PPT design now to present a convincing pitch that not only emphasizes the topic but also showcases your presentation skills.
Developing New Sales And Marketing Strategic Approach Circular Process Ppt PowerPoint Presentation Infographics Outfit PDF
Presenting this set of slides with name developing new sales and marketing strategic approach circular process ppt powerpoint presentation infographics outfit pdf. This is a six stage process. The stages in this process are circular process. This is a completely editable PowerPoint presentation and is available for immediate download. Download now and impress your audience.
Digital Transformation Strategy Roadmap Circular Ppt PowerPoint Presentation Infographics Introduction PDF
Presenting this set of slides with name digital transformation strategy roadmap circular ppt powerpoint presentation infographics introduction pdf. This is a six stage process. The stages in this process are circular. This is a completely editable PowerPoint presentation and is available for immediate download. Download now and impress your audience.

Guide Map Employee Experience Workplace Circular Diagram Ppt Infographics Graphics Template PDF
Presenting this set of slides with name guide map employee experience workplace circular diagram ppt infographics graphics template pdf. This is a seven stage process. The stages in this process are circular diagram. This is a completely editable PowerPoint presentation and is available for immediate download. Download now and impress your audience.
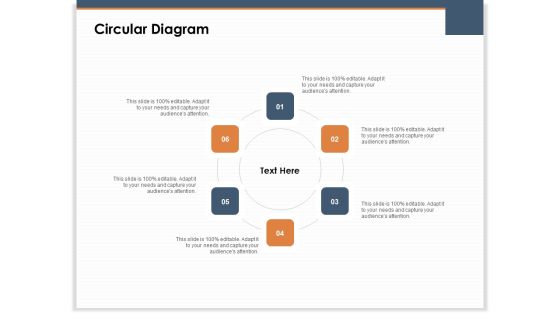
Main Revenues Progress Levers For Each Firm And Sector Circular Diagram Infographics PDF
Presenting this set of slides with name main revenues progress levers for each firm and sector circular diagram infographics pdf. This is a six stage process. The stages in this process are circular diagram. This is a completely editable PowerPoint presentation and is available for immediate download. Download now and impress your audience.

Circular Layout For Business Process Evaluation Ppt PowerPoint Presentation Model Infographics PDF
Presenting circular layout for business process evaluation ppt powerpoint presentation model infographics pdf to dispense important information. This template comprises one stages. It also presents valuable insights into the topics including circular layout for business process evaluation. This is a completely customizable PowerPoint theme that can be put to use immediately. So, download it and address the topic impactfully.

Lead Generation Initiatives Through Chatbots Circular Diagram Ppt Infographics Design Inspiration PDF
Presenting lead generation initiatives through chatbots circular diagram ppt infographics design inspiration pdf to provide visual cues and insights. Share and navigate important information on six stages that need your due attention. This template can be used to pitch topics like circular diagram. In addtion, this PPT design contains high resolution images, graphics, etc, that are easily editable and available for immediate download.

Design Of Interlinked Circular Infographics Ppt PowerPoint Presentation Portfolio Slide Portrait
Presenting this set of slides with name design of interlinked circular infographics ppt powerpoint presentation portfolio slide portrait. This is a four process. The stages in this process are marketing, process, 4 scenario. This is a completely editable PowerPoint presentation and is available for immediate download. Download now and impress your audience.
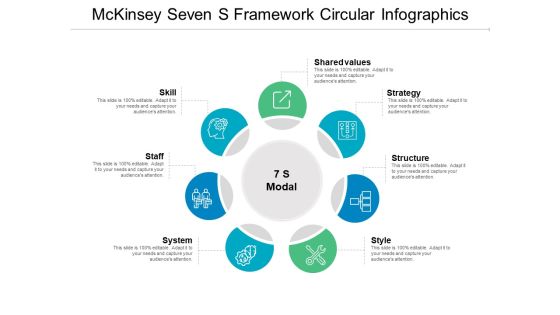
Mckinsey Seven S Framework Circular Infographics Ppt PowerPoint Presentation Layouts Portrait PDF
Presenting this set of slides with name mckinsey seven s framework circular infographics ppt powerpoint presentation layouts portrait pdf. This is a seven stage process. The stages in this process are skill, shared values, strategy, structure, style, system, staff. This is a completely editable PowerPoint presentation and is available for immediate download. Download now and impress your audience.

Circular Layout For Talent Management Model Ppt PowerPoint Presentation File Infographics PDF
Presenting circular layout for talent management model ppt powerpoint presentation file infographics pdf to dispense important information. This template comprises six stages. It also presents valuable insights into the topics including transitioning, develop talent, retain talent. This is a completely customizable PowerPoint theme that can be put to use immediately. So, download it and address the topic impactfully.

12 Stages For Creating Marketing Development Strategy In Circular Layout Ppt Infographics Outline PDF
Presenting 12 stages for creating marketing development strategy in circular layout ppt infographics outline pdf to dispense important information. This template comprises twelve stages. It also presents valuable insights into the topics including marketing, development, strategy. This is a completely customizable PowerPoint theme that can be put to use immediately. So, download it and address the topic impactfully.

6 Stage Procedure Flow Infographics For Network Effect Strategy Ppt PowerPoint Presentation File Graphics Download PDF
Presenting 6 stage procedure flow infographics for network effect strategy ppt powerpoint presentation file graphics download pdf to dispense important information. This template comprises six stages. It also presents valuable insights into the topics including 6 stage procedure flow infographics for network effect strategy. This is a completely customizable PowerPoint theme that can be put to use immediately. So, download it and address the topic impactfully.

Circular Layout For Business Facts And Alternatives Ppt PowerPoint Presentation File Infographics PDF
Presenting this set of slides with name circular layout for business facts and alternatives ppt powerpoint presentation file infographics pdf. This is a eight stage process. The stages in this process are circular layout for business facts and alternatives. This is a completely editable PowerPoint presentation and is available for immediate download. Download now and impress your audience.
Plant In Circular Arrows Sustainability Vector Icon Ppt PowerPoint Presentation File Infographics PDF
Showcasing this set of slides titled plant in circular arrows sustainability vector icon ppt powerpoint presentation file infographics pdf. The topics addressed in these templates are plant in circular arrows sustainability vector icon. All the content presented in this PPT design is completely editable. Download it and make adjustments in color, background, font etc. as per your unique business setting.
Save Water With Circular Arrow Vector Icon Ppt PowerPoint Presentation Infographics Skills PDF
Showcasing this set of slides titled save water with circular arrow vector icon ppt powerpoint presentation infographics skills pdf. The topics addressed in these templates are save water with circular arrow vector icon. All the content presented in this PPT design is completely editable. Download it and make adjustments in color, background, font etc. as per your unique business setting.

Circular Infographics Layout For Client Information Ppt PowerPoint Presentation Pictures Graphics Tutorials
Presenting this set of slides with name circular infographics layout for client information ppt powerpoint presentation pictures graphics tutorials. This is a seven stage process. The stages in this process are contact management, management applications, personal data. This is a completely editable PowerPoint presentation and is available for immediate download. Download now and impress your audience.
Eight Stages Circular Infographics Of International Trade Promotion Ppt PowerPoint Presentation Icon Images
Presenting this set of slides with name eight stages circular infographics of international trade promotion ppt powerpoint presentation icon images. This is a eight stage process. The stages in this process are global competitiveness basics, diversifying sources of income, manageable risk, demanding customers. This is a completely editable PowerPoint presentation and is available for immediate download. Download now and impress your audience.

Areas Of Management Circular Diagram Ppt PowerPoint Presentation Infographics Graphics Download PDF
Presenting this set of slides with name areas of management circular diagram ppt powerpoint presentation infographics graphics download pdf. This is a four stage process. The stages in this process are management, planning, operations, marketing, finance. This is a completely editable PowerPoint presentation and is available for immediate download. Download now and impress your audience.

Circular Roadway Layout To Define And Evaluate Process Ppt PowerPoint Presentation Infographics Example Introduction PDF
Presenting circular roadway layout to define and evaluate process ppt powerpoint presentation infographics example introduction pdf to dispense important information. This template comprises four stages. It also presents valuable insights into the topics including define process, measure process, evaluate process, analyse process. This is a completely customizable PowerPoint theme that can be put to use immediately. So, download it and address the topic impactfully.
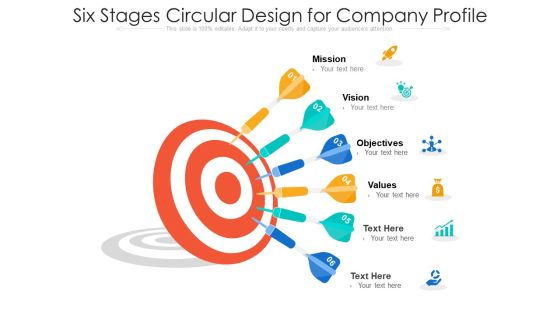
Six Stages Circular Design For Company Profile Ppt PowerPoint Presentation File Infographics PDF
Presenting six stages circular design for company profile ppt powerpoint presentation file infographics pdf to dispense important information. This template comprises six stages. It also presents valuable insights into the topics including mission, vision, objectives. This is a completely customizable PowerPoint theme that can be put to use immediately. So, download it and address the topic impactfully.

Interconnected Circular Layout With Target Achievement Ppt Infographics Graphics Example PDF
Showcasing this set of slides titled interconnected circular layout with target achievement ppt infographics graphics example pdf. The topics addressed in these templates are target achievement, global expansion, deployment, segmentation, revenue growth. All the content presented in this PPT design is completely editable. Download it and make adjustments in color, background, font etc. as per your unique business setting.

 Home
Home