5 Point Agenda

Flowchart To Implement Effective Customer Support Process Ppt Icon Slideshow PDF
This slide covers flowchart to implement effective customer service procedure. It involves five departments such as development, tester, technical support, sales and customer. Presenting Flowchart To Implement Effective Customer Support Process Ppt Icon Slideshow PDF to dispense important information. This template comprises one stages. It also presents valuable insights into the topics including Development, Tester, Technical support, Sales. This is a completely customizable PowerPoint theme that can be put to use immediately. So, download it and address the topic impactfully.
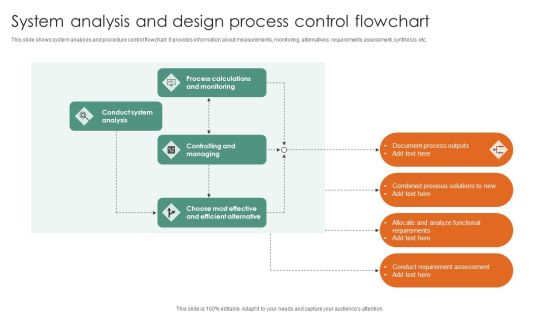
System Analysis And Design Process Control Flowchart Ppt Show Samples PDF
This slide shows system analyses and procedure control flowchart. It provides information about measurements, monitoring, alternatives, requirements assessment, synthesis, etc. Presenting System Analysis And Design Process Control Flowchart Ppt Show Samples PDF to dispense important information. This template comprises five stages. It also presents valuable insights into the topics including Process Calculations, Conduct System Analysis, Controlling And Managing. This is a completely customizable PowerPoint theme that can be put to use immediately. So, download it and address the topic impactfully.
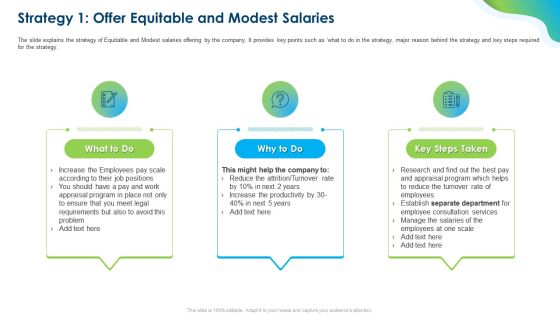
Growing Churn Rate In IT Organization Strategy 1 Offer Equitable And Modest Salaries Themes PDF
Presenting growing churn rate in it organization solutions related to the attrition rate demonstration pdf to provide visual cues and insights. Share and navigate important information on five stages that need your due attention. This template can be used to pitch topics like offer equitable and fair pay, recognized program, train front line executives, administrators and supervisors. In addtion, this PPT design contains high resolution images, graphics, etc, that are easily editable and available for immediate download.
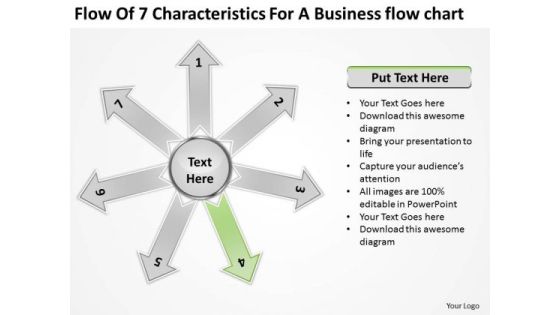
For A E Business PowerPoint Presentation Chart Circular Flow Diagram Templates
We present our for a e business powerpoint presentation chart Circular Flow Diagram templates.Download our Arrows PowerPoint Templates because it shows subtle changes that are taking place. Download and present our Circle Charts PowerPoint Templates because Our PowerPoint Templates and Slides will definately Enhance the stature of your presentation. Adorn the beauty of your thoughts with their colourful backgrounds. Use our Process and Flows PowerPoint Templates because this diagram helps you to show goal also clearly etched in your mind. Use our Business PowerPoint Templates because you have had a great year or so business wise. It is time to celebrate the efforts of your team. Download and present our Shapes PowerPoint Templates because it enlightens your team and colleagues on the critical factors involved.Use these PowerPoint slides for presentations relating to Abstract, Around, Arrows, Background, Blue, Center, Chart, Circle, Circular, Concept, Connection, Cycle, Distribution, Empty, Five, Gold, Graph, Illustration, Objects, Pieces, Process, Round, Segment, Shape, Space, System, Technology. The prominent colors used in the PowerPoint template are Green, Gray, White. Professionals tell us our for a e business powerpoint presentation chart Circular Flow Diagram templates are No-nonsense. You can be sure our Arrows PowerPoint templates and PPT Slides are Fancy. Customers tell us our for a e business powerpoint presentation chart Circular Flow Diagram templates are Gorgeous. Professionals tell us our Blue PowerPoint templates and PPT Slides are Versatile. People tell us our for a e business powerpoint presentation chart Circular Flow Diagram templates are Cheerful. People tell us our Background PowerPoint templates and PPT Slides will impress their bosses and teams.

Buy Side Merger And Acquisition Advisory Analysis Of The Target Companys Market Value Slides PDF
The slide depicts the market valuation of target company by discounting the free cash flows of the company from next five years. If you are looking for a format to display your unique thoughts, then the professionally designed Buy Side Merger And Acquisition Advisory Analysis Of The Target Companys Market Value Slides PDF is the one for you. You can use it as a Google Slides template or a PowerPoint template. Incorporate impressive visuals, symbols, images, and other charts. Modify or reorganize the text boxes as you desire. Experiment with shade schemes and font pairings. Alter, share or cooperate with other people on your work. Download Buy Side Merger And Acquisition Advisory Analysis Of The Target Companys Market Value Slides PDF and find out how to give a successful presentation. Present a perfect display to your team and make your presentation unforgettable.

Comprehensive Guide For Implementing Waterfall Management Technique To Manage Projects Ppt PowerPoint Presentation Complete Deck
Starting a presentation on business is a decision to make. As you think about it, you realize that everything is a decision. Our Comprehensive Guide For Implementing Waterfall Management Technique To Manage Projects Ppt PowerPoint Presentation Complete Deck will make all your business tasks and decisions a bit easier, with its emphasis on planning. The fourty five slide complete deck allows you to present the daily challenges of business in your own way to your team, key stakeholders, and external vendors etc. With each slide being 100 percent editable and customizable, you may decide to fiddle around with the design or the content ready nature to arrive at your own, presentation on a topic of your choosing. Download now.

Arrows For PowerPoint 3d Curved Process Templates Backgrounds Slides
We present our arrows for powerpoint 3d curved process templates backgrounds slides.Download our Arrows PowerPoint Templates because You should Bet on your luck with our PowerPoint Templates and Slides. Be assured that you will hit the jackpot. Use our Business PowerPoint Templates because You have a driving passion to excel in your field. Our PowerPoint Templates and Slides will prove ideal vehicles for your ideas. Download and present our Flow Charts PowerPoint Templates because Our PowerPoint Templates and Slides provide you with a vast range of viable options. Select the appropriate ones and just fill in your text. Use our Process and Flows PowerPoint Templates because Our PowerPoint Templates and Slides will weave a web of your great ideas. They are gauranteed to attract even the most critical of your colleagues. Download and present our Shapes PowerPoint Templates because You can Score a slam dunk with our PowerPoint Templates and Slides. Watch your audience hang onto your every word.Use these PowerPoint slides for presentations relating to Analyzing, arrow, banking, business, concepts, data, diagram, finance, improvement, investment, isolated, line graph, mesh, progress, render, report, solution, stock market, success, five-dimensional shape, white, background. The prominent colors used in the PowerPoint template are Yellow, Gray, Black. People tell us our arrows for powerpoint 3d curved process templates backgrounds slides are second to none. Presenters tell us our data PowerPoint templates and PPT Slides provide you with a vast range of viable options. Select the appropriate ones and just fill in your text. Customers tell us our arrows for powerpoint 3d curved process templates backgrounds slides will help them to explain complicated concepts. Customers tell us our improvement PowerPoint templates and PPT Slides help you meet deadlines which are an element of today's workplace. Just browse and pick the slides that appeal to your intuitive senses. Professionals tell us our arrows for powerpoint 3d curved process templates backgrounds slides are specially created by a professional team with vast experience. They diligently strive to come up with the right vehicle for your brilliant Ideas. Use our banking PowerPoint templates and PPT Slides are aesthetically designed to attract attention. We guarantee that they will grab all the eyeballs you need.

Marketing Success Metrics Ways To Analyze Enterprises Marketing Performance Ppt PowerPoint Presentation Complete Deck With Slides
This Marketing Success Metrics Ways To Analyze Enterprises Marketing Performance Ppt PowerPoint Presentation Complete Deck With Slides is designed to help you retain your audiences attention. This content-ready PowerPoint Template enables you to take your audience on a journey and share information in a way that is easier to recall. It helps you highlight the crucial parts of your work so that the audience does not get saddled with information download. This sixty five slide PPT Deck comes prepared with the graphs and charts you could need to showcase your information through visuals. You only need to enter your own data in them. Download this editable PowerPoint Theme and walk into that meeting with confidence.

Online PR Techniques To Boost Brands Online Visibility Ppt PowerPoint Presentation Complete Deck With Slides
This Online PR Techniques To Boost Brands Online Visibility Ppt PowerPoint Presentation Complete Deck With Slides is designed to help you retain your audiences attention. This content ready PowerPoint Template enables you to take your audience on a journey and share information in a way that is easier to recall. It helps you highlight the crucial parts of your work so that the audience does not get saddled with information download. This sixty five slide PPT Deck comes prepared with the graphs and charts you could need to showcase your information through visuals. You only need to enter your own data in them. Download this editable PowerPoint Theme and walk into that meeting with confidence.
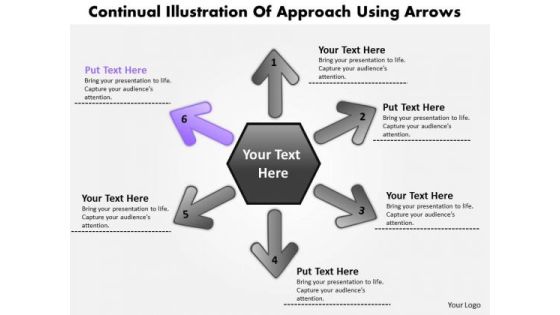
Illustration Of 6 Approach Using Arrows Circular Flow Chart PowerPoint Slides
We present our illustration of 6 approach using arrows Circular Flow Chart PowerPoint Slides.Download and present our Arrows PowerPoint Templates because you can Be the cynosure of all eyes with our template depicting . Download and present our Hexagon PowerPoint Templates because you have a handle on all the targets, a master of the game, the experienced and consummate juggler. Use our Process and Flows PowerPoint Templates because it demonstrates to your audience how the best and most refined ideas pass through. Download and present our Business PowerPoint Templates because you have had your share of being a goldfish in a small bowl.you are ready to launch out and spread your wings. Download our Shapes PowerPoint Templates because you have configured your targets, identified your goals as per priority and importance.Use these PowerPoint slides for presentations relating to Abstract, Around, Arrows, Background, Blue, Center, Chart, Circle, Circular, Concept, Connection, Copy, Copyspace, Curve, Cycle, Distribution, Empty, Five, Gold, Graph, Illustration, Objects, Pieces, Process, Round, Segment, Shape, Space, System, Technology, Vector. The prominent colors used in the PowerPoint template are Purple, Gray, Black. Professionals tell us our illustration of 6 approach using arrows Circular Flow Chart PowerPoint Slides are Whimsical. You can be sure our Chart PowerPoint templates and PPT Slides are Versatile. Customers tell us our illustration of 6 approach using arrows Circular Flow Chart PowerPoint Slides are Liberated. Professionals tell us our Blue PowerPoint templates and PPT Slides are Bright. People tell us our illustration of 6 approach using arrows Circular Flow Chart PowerPoint Slides are Liberated. People tell us our Blue PowerPoint templates and PPT Slides are Spiffy.
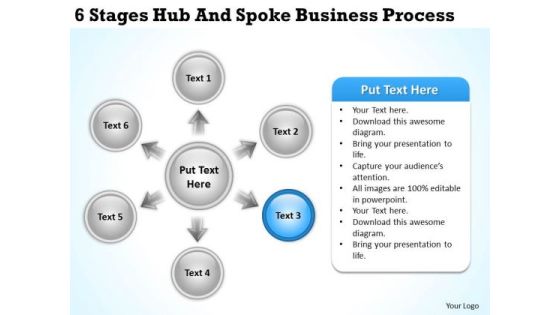
Diagram Business Process New PowerPoint Presentation Templates
We present our Diagram Business Process New Powerpoint Presentation Templates.Download our Arrows PowerPoint Templates because Our PowerPoint Templates and Slides will let your team Walk through your plans. See their energy levels rise as you show them the way. Present our Business PowerPoint Templates because Your success is our commitment. Our PowerPoint Templates and Slides will ensure you reach your goal. Use our Circle Charts PowerPoint Templates because Our PowerPoint Templates and Slides will definately Enhance the stature of your presentation. Adorn the beauty of your thoughts with their colourful backgrounds. Use our Shapes PowerPoint Templates because You can Zap them with our PowerPoint Templates and Slides. See them reel under the impact. Use our Process and Flows PowerPoint Templates because Our PowerPoint Templates and Slides will let you Clearly mark the path for others to follow.Use these PowerPoint slides for presentations relating to Abstract, Arrow, Blue, Business, Button, Chart, Circle, Company, Cross, Data, Design, Diagram, Direction, Document, Financial, Five, Function, Green, Management, Market, Marketing, Model, Multicolored, Multiple, Navigation, Network, Options, Orange, Plan, Presentation, Process, Red, Results, Shiny, Sphere, Statistics, Structure, Template, Three, Vector, Website, Wheel. The prominent colors used in the PowerPoint template are Blue, Black, Gray.
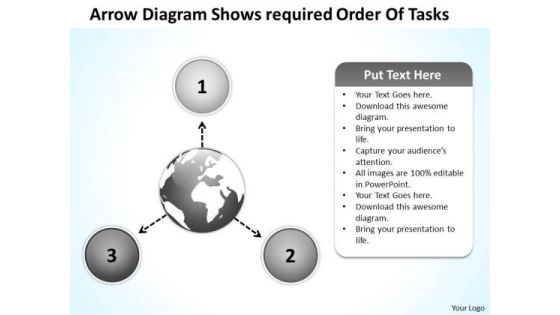
Arrow Diagram Shows Required Order Of Tasks Circular Flow Layout Process PowerPoint Slides
We present our arrow diagram shows required order of tasks Circular Flow Layout Process PowerPoint Slides.Use our Business PowerPoint Templates because it helps you to explain your plans in all earnest to your colleagues and raise the bar for all. Download our Marketing PowerPoint Templates because you have the ability to judge Which out of late have been proving to be a hassle. Download and present our Arrows PowerPoint Templates because you have played a stellar role and have a few ideas. Download and present our Circle Charts PowerPoint Templates because you can Educate your listeners on the means to keep it ticking over. Download and present our Flow Charts PowerPoint Templates because activities which in themselves have many inherent business oppurtunities.Use these PowerPoint slides for presentations relating to Arrow, Blue, Business, Button, Chart, Circle, Company, Cross, Data, Design, Diagram, Direction, Document, Five, Function, Market, Marketing, Model, Multicolored, Multiple, Navigation, Network, Options, Presentation, Process, Results, Shiny, Sphere, Structure, Template, Three, Vector, Website, Wheel. The prominent colors used in the PowerPoint template are Black, Gray, White. Presenters tell us our arrow diagram shows required order of tasks Circular Flow Layout Process PowerPoint Slides are Bright. We assure you our Circle PowerPoint templates and PPT Slides are Stunning. Presenters tell us our arrow diagram shows required order of tasks Circular Flow Layout Process PowerPoint Slides will save the presenter time. Use our Company PowerPoint templates and PPT Slides are Fun. We assure you our arrow diagram shows required order of tasks Circular Flow Layout Process PowerPoint Slides are readymade to fit into any presentation structure. You can be sure our Data PowerPoint templates and PPT Slides are Festive.

Determining Current And Future Qualification Demand Of Employees Slides PDF
Following slide shows informational stats on employees current and future qualification demand. Here the graph shows that there will be a huge increase in the demand for employees having qualification in data science after five years. This Determining Current And Future Qualification Demand Of Employees Slides PDF from Slidegeeks makes it easy to present information on your topic with precision. It provides customization options, so you can make changes to the colors, design, graphics, or any other component to create a unique layout. It is also available for immediate download, so you can begin using it right away. Slidegeeks has done good research to ensure that you have everything you need to make your presentation stand out. Make a name out there for a brilliant performance.
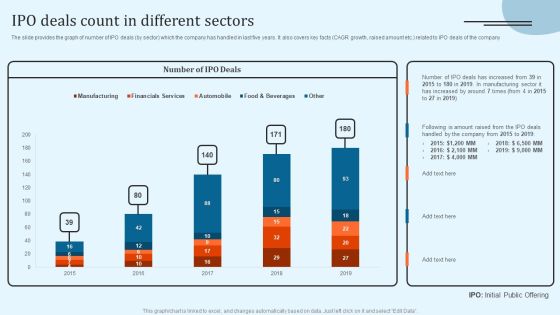
Equity Debt And Convertible Bond Investment Banking Pitch Book IPO Deals Count In Different Sectors Formats PDF
The slide provides the graph of number of IPO deals by sector which the company has handled in last five years. It also covers key facts CAGR growth, raised amount etc. related to IPO deals of the company. Take your projects to the next level with our ultimate collection of Equity Debt And Convertible Bond Investment Banking Pitch Book IPO Deals Count In Different Sectors Formats PDF. Slidegeeks has designed a range of layouts that are perfect for representing task or activity duration, keeping track of all your deadlines at a glance. Tailor these designs to your exact needs and give them a truly corporate look with your own brand colors they will make your projects stand out from the rest.
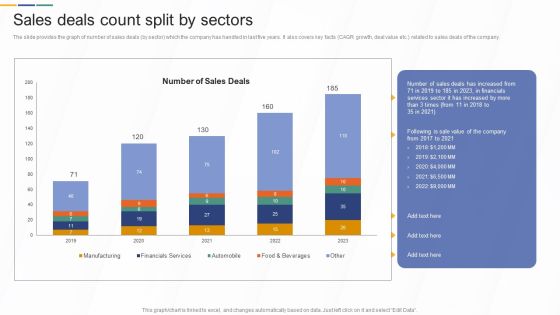
Sales Deals Count Split By Sectors Investment Banking And Deal Pitchbook Guidelines PDF
The slide provides the graph of number of sales deals by sector which the company has handled in last five years. It also covers key facts CAGR growth, deal value etc. related to sales deals of the company.Get a simple yet stunning designed Sales Deals Count Split By Sectors Investment Banking And Deal Pitchbook Guidelines PDF. It is the best one to establish the tone in your meetings. It is an excellent way to make your presentations highly effective. So, download this PPT today from Slidegeeks and see the positive impacts. Our easy-to-edit Sales Deals Count Split By Sectors Investment Banking And Deal Pitchbook Guidelines PDF can be your go-to option for all upcoming conferences and meetings. So, what are you waiting for Grab this template today.

Digital Application Software Development Business Profile CSR Spend Clipart PDF
The slide describes the spending on corporate social responsibility for last five years. It shows CSR spend split based on category people, environment and category and CSRspend by location. Do you have an important presentation coming up Are you looking for something that will make your presentation stand out from the rest Look no further than Digital Application Software Development Business Profile CSR Spend Clipart PDF. With our professional designs, you can trust that your presentation will pop and make delivering it a smooth process. And with Slidegeeks, you can trust that your presentation will be unique and memorable. So why wait Grab Digital Application Software Development Business Profile CSR Spend Clipart PDF today and make your presentation stand out from the rest.

Digital Application Software Development Business Profile Gross Profit And Margin Pictures PDF
This slide illustrates a graph of gross profit in US dollar and gross margin in percentage for software company illustrating growth trend in last five years from 2018 to 2022. It also showcases gross profit contribution by services and solutions. Formulating a presentation can take up a lot of effort and time, so the content and message should always be the primary focus. The visuals of the PowerPoint can enhance the presenters message, so our Digital Application Software Development Business Profile Gross Profit And Margin Pictures PDF was created to help save time. Instead of worrying about the design, the presenter can concentrate on the message while our designers work on creating the ideal templates for whatever situation is needed. Slidegeeks has experts for everything from amazing designs to valuable content, we have put everything into Digital Application Software Development Business Profile Gross Profit And Margin Pictures PDF.
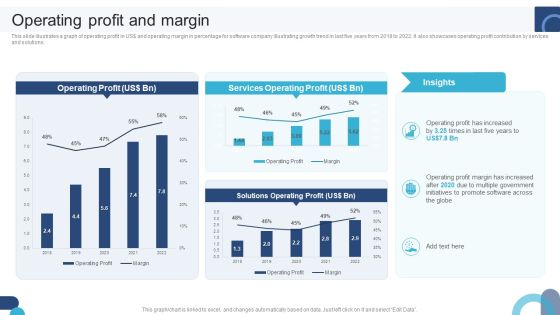
Digital Application Software Development Business Profile Operating Profit And Margin Professional PDF
This slide illustrates a graph of operating profit in US dollar and operating margin in percentage for software company illustrating growth trend in last five years from 2018 to 2022. It also showcases operating profit contribution by services and solutions. Explore a selection of the finest Digital Application Software Development Business Profile Operating Profit And Margin Professional PDF here. With a plethora of professionally designed and pre-made slide templates, you can quickly and easily find the right one for your upcoming presentation. You can use our Digital Application Software Development Business Profile Operating Profit And Margin Professional PDF to effectively convey your message to a wider audience. Slidegeeks has done a lot of research before preparing these presentation templates. The content can be personalized and the slides are highly editable. Grab templates today from Slidegeeks.
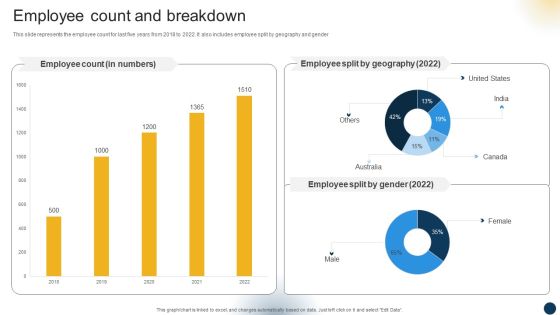
Organizational Advisory Solutions Business Profile Employee Count And Breakdown Rules PDF
This slide represents the employee count for last five years from 2018 to 2022. It also includes employee split by geography and gender. Do you know about Slidesgeeks Organizational Advisory Solutions Business Profile Employee Count And Breakdown Rules PDF These are perfect for delivering any kind od presentation. Using it, create PowerPoint presentations that communicate your ideas and engage audiences. Save time and effort by using our pre designed presentation templates that are perfect for a wide range of topic. Our vast selection of designs covers a range of styles, from creative to business, and are all highly customizable and easy to edit. Download as a PowerPoint template or use them as Google Slides themes.
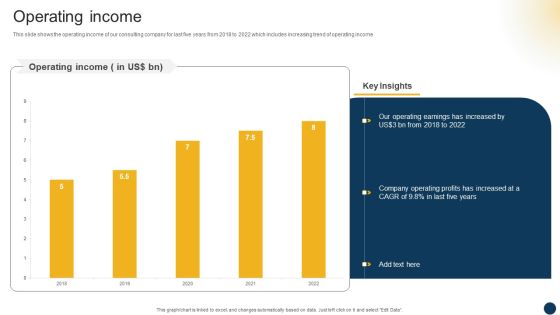
Organizational Advisory Solutions Business Profile Operating Income Summary PDF
This slide shows the operating income of our consulting company for last five years from 2018 to 2022 which includes increasing trend of operating income. This Organizational Advisory Solutions Business Profile Operating Income Summary PDF from Slidegeeks makes it easy to present information on your topic with precision. It provides customization options, so you can make changes to the colors, design, graphics, or any other component to create a unique layout. It is also available for immediate download, so you can begin using it right away. Slidegeeks has done good research to ensure that you have everything you need to make your presentation stand out. Make a name out there for a brilliant performance.
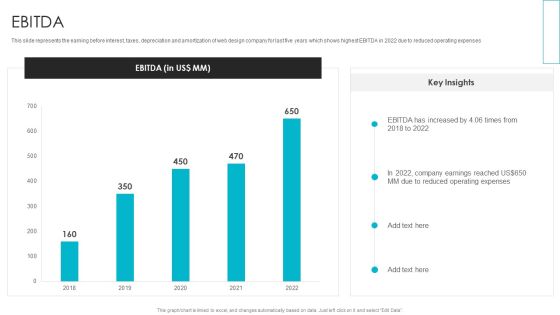
Web Design Company Overview EBITDA Infographics PDF
This slide represents the earning before interest, taxes, depreciation and amortization of web design company for last five years which shows highest EBITDA in 2022 due to reduced operating expenses. Here you can discover an assortment of the finest PowerPoint and Google Slides templates. With these templates, Web Design Company Overview EBITDA Infographics PDF can create presentations for a variety of purposes while simultaneously providing your audience with an eye catching visual experience. Download Web Design Company Overview EBITDA Infographics PDF to deliver an impeccable presentation. These templates will make your job of preparing presentations much quicker, yet still, maintain a high level of quality. Slidegeeks has experienced researchers who prepare these templates and write high quality content for you. Later on, you can personalize the content by editing the Web Design Company Overview EBITDA Infographics PDF.
Web Interface Development Services Company Summary Employee Count And Breakdown Icons PDF
This slide represents the employee count for last five years from 2019 to 2023. It also includes employee split by geography and gender Slidegeeks is here to make your presentations a breeze with Web Interface Development Services Company Summary Employee Count And Breakdown Icons PDF With our easy-to-use and customizable templates, you can focus on delivering your ideas rather than worrying about formatting. With a variety of designs to choose from, youre sure to find one that suits your needs. And with animations and unique photos, illustrations, and fonts, you can make your presentation pop. So whether youre giving a sales pitch or presenting to the board, make sure to check out Slidegeeks first.

Web Interface Development Services Company Summary Operating Profits From 2019 To 2023 Microsoft PDF
This slide covers the operating profit of web design company for last five years from 2019 to 2023 which shows changes in operating profits year after year. Formulating a presentation can take up a lot of effort and time, so the content and message should always be the primary focus. The visuals of the PowerPoint can enhance the presenters message, so our Web Interface Development Services Company Summary Operating Profits From 2019 To 2023 Microsoft PDF was created to help save time. Instead of worrying about the design, the presenter can concentrate on the message while our designers work on creating the ideal templates for whatever situation is needed. Slidegeeks has experts for everything from amazing designs to valuable content, we have put everything into Web Interface Development Services Company Summary Operating Profits From 2019 To 2023 Microsoft PDF.

Website Design And Branding Studio Company Profile CSR Expenditure And Split Template PDF
This slide shows the CSR expenditure for last five years from 2018 to 2023 and split for 2023 which includes charities, healthcare, environmental initiatives, educational activities, etc. Get a simple yet stunning designed Website Design And Branding Studio Company Profile CSR Expenditure And Split Template PDF. It is the best one to establish the tone in your meetings. It is an excellent way to make your presentations highly effective. So, download this PPT today from Slidegeeks and see the positive impacts. Our easy-to-edit Website Design And Branding Studio Company Profile CSR Expenditure And Split Template PDF can be your go-to option for all upcoming conferences and meetings. So, what are you waiting for Grab this template today.

Website Design And Branding Studio Company Profile Operating Profits From 2018 To 2023 Graphics PDF
This slide covers the operating profit of web design company for last five years from 2018 to 2023 which shows changes in operating profits year after year. Formulating a presentation can take up a lot of effort and time, so the content and message should always be the primary focus. The visuals of the PowerPoint can enhance the presenters message, so our Website Design And Branding Studio Company Profile Operating Profits From 2018 To 2023 Graphics PDF was created to help save time. Instead of worrying about the design, the presenter can concentrate on the message while our designers work on creating the ideal templates for whatever situation is needed. Slidegeeks has experts for everything from amazing designs to valuable content, we have put everything into Website Design And Branding Studio Company Profile Operating Profits From 2018 To 2023 Graphics PDF.
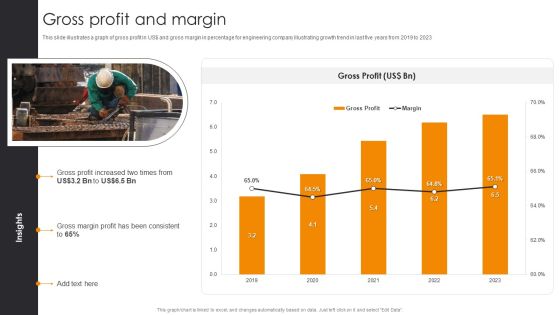
Gross Profit And Margin Engineering Company Financial Analysis Report Rules PDF
This slide illustrates a graph of gross profit in US dollar and gross margin in percentage for engineering company illustrating growth trend in last five years from 2019 to 2023. Retrieve professionally designed Gross Profit And Margin Engineering Company Financial Analysis Report Rules PDF to effectively convey your message and captivate your listeners. Save time by selecting pre-made slideshows that are appropriate for various topics, from business to educational purposes. These themes come in many different styles, from creative to corporate, and all of them are easily adjustable and can be edited quickly. Access them as PowerPoint templates or as Google Slides themes. You do not have to go on a hunt for the perfect presentation because Slidegeeks got you covered from everywhere.

Operating Profit And Margin Engineering Company Financial Analysis Report Portrait PDF
This slide illustrates a graph of operating profit in US dollar and gross margin in percentage for engineering company illustrating key insights and changes in last five years from 2019 to 2023. Here you can discover an assortment of the finest PowerPoint and Google Slides templates. With these templates, you can create presentations for a variety of purposes while simultaneously providing your audience with an eye-catching visual experience. Download Operating Profit And Margin Engineering Company Financial Analysis Report Portrait PDF to deliver an impeccable presentation. These templates will make your job of preparing presentations much quicker, yet still, maintain a high level of quality. Slidegeeks has experienced researchers who prepare these templates and write high-quality content for you. Later on, you can personalize the content by editing the Operating Profit And Margin Engineering Company Financial Analysis Report Portrait PDF.

IT Firm Financial Statement Gross Profit And Margin Summary PDF
This slide illustrates a graph of gross profit in US dollar and gross margin in percentage for IT company illustrating growth trend in last five years from 2019 to 2023. It also showcases gross profit contribution by services and solutions. Boost your pitch with our creative IT Firm Financial Statement Gross Profit And Margin Summary PDF. Deliver an awe inspiring pitch that will mesmerize everyone. Using these presentation templates you will surely catch everyones attention. You can browse the ppts collection on our website. We have researchers who are experts at creating the right content for the templates. So you do not have to invest time in any additional work. Just grab the template now and use them.
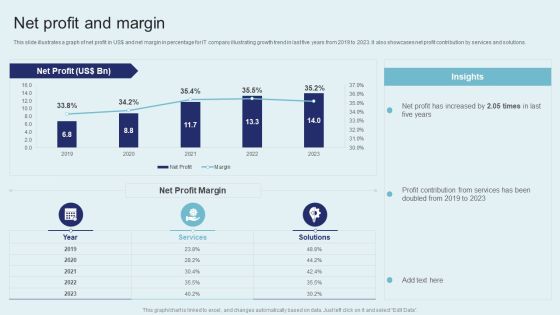
IT Firm Financial Statement Net Profit And Margin Slides PDF
This slide illustrates a graph of net profit in US dollar and net margin in percentage for IT company illustrating growth trend in last five years from 2019 to 2023. It also showcases net profit contribution by services and solutions. Do you have to make sure that everyone on your team knows about any specific topic I yes, then you should give IT Firm Financial Statement Net Profit And Margin Slides PDF a try. Our experts have put a lot of knowledge and effort into creating this impeccable IT Firm Financial Statement Net Profit And Margin Slides PDF. You can use this template for your upcoming presentations, as the slides are perfect to represent even the tiniest detail. You can download these templates from the Slidegeeks website and these are easy to edit. So grab these today.

IT Firm Financial Statement Operating Profit And Margin Formats PDF
This slide illustrates a graph of operating profit in US dollar and operating margin in percentage for IT company IT Firm Fina growth trend in last five years from 2019 to 2023. It also showcases operating profit contribution by services and solutions. Get a simple yet stunning designed IT Firm Financial Statement Operating Profit And Margin Formats PDF. It is the best one to establish the tone in your meetings. It is an excellent way to make your presentations highly effective. So, download this PPT today from Slidegeeks and see the positive impacts. Our easy to edit IT Firm Financial Statement Operating Profit And Margin Formats PDF can be your go to option for all upcoming conferences and meetings. So, what are you waiting for Grab this template today.

Sell Side M And A Pitchbook With Deal Overview Sales Deals Count Split By Sectors Portrait PDF
The slide provides the graph of number of sales deals by sector which the company has handled in last five years. It also covers key facts CAGR growth, deal value etc. related to sales deals of the company. Retrieve professionally designed Sell Side M And A Pitchbook With Deal Overview Sales Deals Count Split By Sectors Portrait PDF to effectively convey your message and captivate your listeners. Save time by selecting pre made slideshows that are appropriate for various topics, from business to educational purposes. These themes come in many different styles, from creative to corporate, and all of them are easily adjustable and can be edited quickly. Access them as PowerPoint templates or as Google Slides themes. You do not have to go on a hunt for the perfect presentation because Slidegeeks got you covered from everywhere.
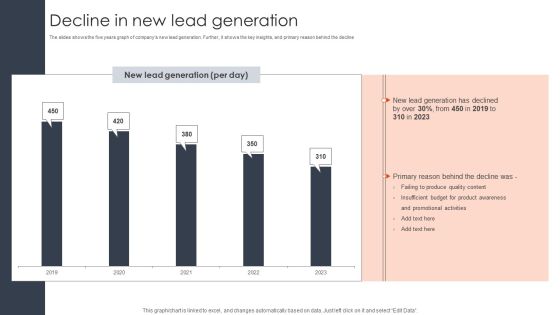
Decline In New Lead Generation Client Acquisition Techniques To Boost Sales Portrait PDF
The slides shows the five years graph of companys new lead generation. Further, it shows the key insights, and primary reason behind the decline. Get a simple yet stunning designed Decline In New Lead Generation Client Acquisition Techniques To Boost Sales Portrait PDF. It is the best one to establish the tone in your meetings. It is an excellent way to make your presentations highly effective. So, download this PPT today from Slidegeeks and see the positive impacts. Our easy-to-edit Decline In New Lead Generation Client Acquisition Techniques To Boost Sales Portrait PDF can be your go-to option for all upcoming conferences and meetings. So, what are you waiting for Grab this template today.

Website Designing Solutions Company Profile CSR Expenditure And Split Introduction PDF
This slide shows the CSR expenditure for last five years from 2018 to 2022 and split for 2022 which includes charities, healthcare, environmental initiatives, educational activities, etc. Find highly impressive Website Designing Solutions Company Profile CSR Expenditure And Split Introduction PDF on Slidegeeks to deliver a meaningful presentation. You can save an ample amount of time using these presentation templates. No need to worry to prepare everything from scratch because Slidegeeks experts have already done a huge research and work for you. You need to download Website Designing Solutions Company Profile CSR Expenditure And Split Introduction PDF for your upcoming presentation. All the presentation templates are 100 percent editable and you can change the color and personalize the content accordingly. Download now
Website Designing Solutions Company Profile Operating Profits From 2018 To 2022 Icons PDF
This slide covers the operating profit of web design company for last five years from 2018 to 2022 which shows changes in operating profits year after year. Explore a selection of the finest Website Designing Solutions Company Profile Operating Profits From 2018 To 2022 Icons PDF here. With a plethora of professionally designed and pre-made slide templates, you can quickly and easily find the right one for your upcoming presentation. You can use our Website Designing Solutions Company Profile Operating Profits From 2018 To 2022 Icons PDF to effectively convey your message to a wider audience. Slidegeeks has done a lot of research before preparing these presentation templates. The content can be personalized and the slides are highly editable. Grab templates today from Slidegeeks.

Engineering Services Company Report Net Profit And Margin Ppt PowerPoint Presentation File Aids PDF
This slide illustrates a graph of net profit in US dollar and gross margin in percentage for engineering company illustrating growth in last five years from 2018 to 2022. Present like a pro with Engineering Services Company Report Net Profit And Margin Ppt PowerPoint Presentation File Aids PDF Create beautiful presentations together with your team, using our easy-to-use presentation slides. Share your ideas in real-time and make changes on the fly by downloading our templates. So whether youre in the office, on the go, or in a remote location, you can stay in sync with your team and present your ideas with confidence. With Slidegeeks presentation got a whole lot easier. Grab these presentations today.
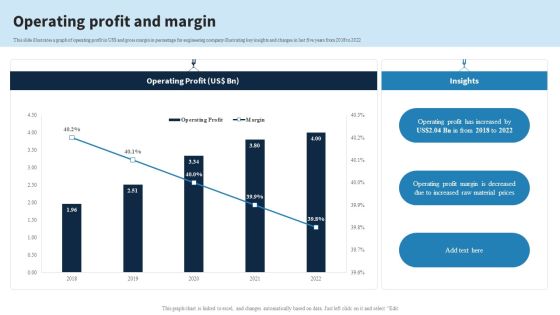
Engineering Services Company Report Operating Profit And Margin Ppt PowerPoint Presentation Gallery Show PDF
This slide illustrates a graph of operating profit in US dollar and gross margin in percentage for engineering company illustrating key insights and changes in last five years from 2018 to 2022. Do you have an important presentation coming up Are you looking for something that will make your presentation stand out from the rest Look no further than Engineering Services Company Report Operating Profit And Margin Ppt PowerPoint Presentation Gallery Show PDF. With our professional designs, you can trust that your presentation will pop and make delivering it a smooth process. And with Slidegeeks, you can trust that your presentation will be unique and memorable. So why wait Grab Engineering Services Company Report Operating Profit And Margin Ppt PowerPoint Presentation Gallery Show PDF today and make your presentation stand out from the rest.
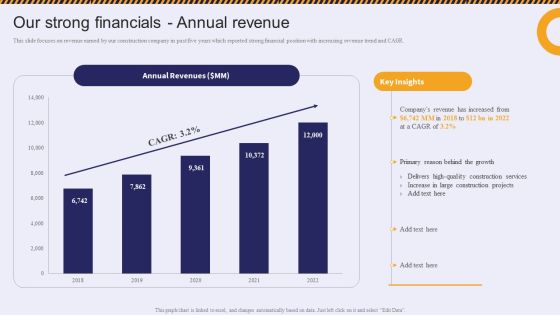
Our Strong Financials Annual Revenue Residential And Commercial Building Construction Topics PDF
This slide focuses on revenue earned by our construction company in past five years which reported strong financial position with increasing revenue trend and CAGR.This Our Strong Financials Annual Revenue Residential And Commercial Building Construction Topics PDF from Slidegeeks makes it easy to present information on your topic with precision. It provides customization options, so you can make changes to the colors, design, graphics, or any other component to create a unique layout. It is also available for immediate download, so you can begin using it right away. Slidegeeks has done good research to ensure that you have everything you need to make your presentation stand out. Make a name out there for a brilliant performance.
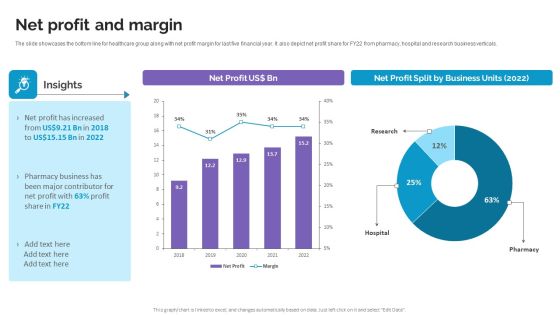
Net Profit And Margin Life Science And Healthcare Solutions Company Profile Inspiration PDF
The slide showcases the bottom line for healthcare group along with net profit margin for last five financial year. It also depict net profit share for FY22 from pharmacy, hospital and research business verticals. Get a simple yet stunning designed Net Profit And Margin Life Science And Healthcare Solutions Company Profile Inspiration PDF. It is the best one to establish the tone in your meetings. It is an excellent way to make your presentations highly effective. So, download this PPT today from Slidegeeks and see the positive impacts. Our easy-to-edit Net Profit And Margin Life Science And Healthcare Solutions Company Profile Inspiration PDF can be your go-to option for all upcoming conferences and meetings. So, what are you waiting for Grab this template today.
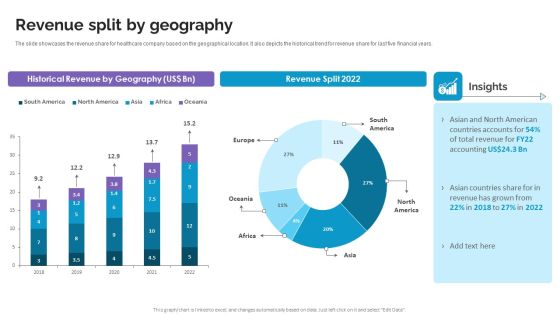
Revenue Split By Geography Life Science And Healthcare Solutions Company Profile Brochure PDF
The slide showcases the revenue share for healthcare company based on the geographical location. It also depicts the historical trend for revenue share for last five financial years. Are you in need of a template that can accommodate all of your creative concepts This one is crafted professionally and can be altered to fit any style. Use it with Google Slides or PowerPoint. Include striking photographs, symbols, depictions, and other visuals. Fill, move around, or remove text boxes as desired. Test out color palettes and font mixtures. Edit and save your work, or work with colleagues. Download Revenue Split By Geography Life Science And Healthcare Solutions Company Profile Brochure PDF and observe how to make your presentation outstanding. Give an impeccable presentation to your group and make your presentation unforgettable.
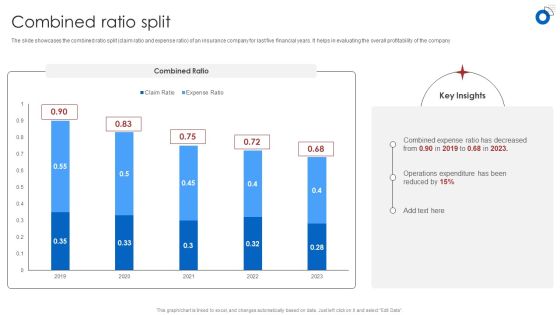
Insurance Business Financial Analysis Combined Ratio Split Ppt Slides Clipart Images PDF
The slide showcases the combined ratio split claim ratio and expense ratio of an insurance company for last five financial years. It helps in evaluating the overall profitability of the company. Are you in need of a template that can accommodate all of your creative concepts This one is crafted professionally and can be altered to fit any style. Use it with Google Slides or PowerPoint. Include striking photographs, symbols, depictions, and other visuals. Fill, move around, or remove text boxes as desired. Test out color palettes and font mixtures. Edit and save your work, or work with colleagues. Download Insurance Business Financial Analysis Combined Ratio Split Ppt Slides Clipart Images PDF and observe how to make your presentation outstanding. Give an impeccable presentation to your group and make your presentation unforgettable.

Insurance Business Financial Analysis Historical Revenue Ppt Styles Graphics PDF
The slide showcases company revenue for last five years along with yearly on year growth. It also depicts CAGR and key insights for revenue analysis. Crafting an eye-catching presentation has never been more straightforward. Let your presentation shine with this tasteful yet straightforward Insurance Business Financial Analysis Historical Revenue Ppt Styles Graphics PDF template. It offers a minimalistic and classy look that is great for making a statement. The colors have been employed intelligently to add a bit of playfulness while still remaining professional. Construct the ideal Insurance Business Financial Analysis Historical Revenue Ppt Styles Graphics PDF that effortlessly grabs the attention of your audience Begin now and be certain to wow your customers.
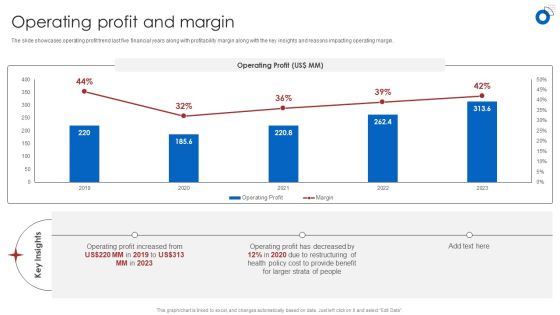
Insurance Business Financial Analysis Operating Profit And Margin Ppt Styles Structure PDF
The slide showcases operating profit trend last five financial years along with profitability margin along with the key insights and reasons impacting operating margin. Formulating a presentation can take up a lot of effort and time, so the content and message should always be the primary focus. The visuals of the PowerPoint can enhance the presenters message, so our Insurance Business Financial Analysis Operating Profit And Margin Ppt Styles Structure PDF was created to help save time. Instead of worrying about the design, the presenter can concentrate on the message while our designers work on creating the ideal templates for whatever situation is needed. Slidegeeks has experts for everything from amazing designs to valuable content, we have put everything into Insurance Business Financial Analysis Operating Profit And Margin Ppt Styles Structure PDF.
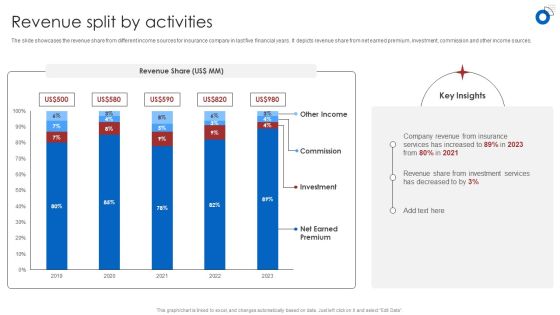
Insurance Business Financial Analysis Revenue Split By Activities Ppt Infographic Template Design Inspiration PDF
The slide showcases the revenue share from different income sources for insurance company in last five financial years. It depicts revenue share from net earned premium, investment, commission and other income sources. Coming up with a presentation necessitates that the majority of the effort goes into the content and the message you intend to convey. The visuals of a PowerPoint presentation can only be effective if it supplements and supports the story that is being told. Keeping this in mind our experts created Insurance Business Financial Analysis Revenue Split By Activities Ppt Infographic Template Design Inspiration PDF to reduce the time that goes into designing the presentation. This way, you can concentrate on the message while our designers take care of providing you with the right template for the situation.

Insurance Business Financial Analysis Sources Of Revenue Ppt Model Ideas PDF
The slide showcases the revenue earned by the insurance company from different income sources. It depicts revenue earned from net earned premium, investment, commission and other income sources for last five financial years. This modern and well-arranged Insurance Business Financial Analysis Sources Of Revenue Ppt Model Ideas PDF provides lots of creative possibilities. It is very simple to customize and edit with the Powerpoint Software. Just drag and drop your pictures into the shapes. All facets of this template can be edited with Powerpoint, no extra software is necessary. Add your own material, put your images in the places assigned for them, adjust the colors, and then you can show your slides to the world, with an animated slide included.
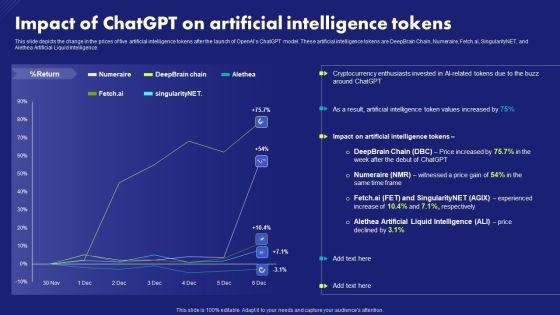
Impact Of Chatgpt On Artificial Intelligence Tokens Chat Generative Pre Trained Transformer Guidelines PDF
This slide depicts the change in the prices of five artificial intelligence tokens after the launch of OpenAIs ChatGPT model. These artificial intelligence tokens are DeepBrain Chain, Numeraire, Fetch.ai, SingularityNET, and Alethea Artificial Liquid Intelligence. This modern and well-arranged Impact Of Chatgpt On Artificial Intelligence Tokens Chat Generative Pre Trained Transformer Guidelines PDF provides lots of creative possibilities. It is very simple to customize and edit with the Powerpoint Software. Just drag and drop your pictures into the shapes. All facets of this template can be edited with Powerpoint no extra software is necessary. Add your own material, put your images in the places assigned for them, adjust the colors, and then you can show your slides to the world, with an animated slide included.

Buy Side Merger And Acquisition Advisory Mergers And Acquisitions By Sector Inspiration PDF
The slide illustrates the graph of number of merger and acquisition deals by sector that the company has completed in last five years. It also covers key facts CAGR growth, deal value etc. related to merger and acquisition deals of the company. This Buy Side Merger And Acquisition Advisory Mergers And Acquisitions By Sector Inspiration PDF from Slidegeeks makes it easy to present information on your topic with precision. It provides customization options, so you can make changes to the colors, design, graphics, or any other component to create a unique layout. It is also available for immediate download, so you can begin using it right away. Slidegeeks has done good research to ensure that you have everything you need to make your presentation stand out. Make a name out there for a brilliant performance.

Target Consumers And Market Valuation Overview Sales Deals Count Split By Sectors Rules PDF
The slide provides the graph of number of sales deals by sector which the company has handled in last five years. It also covers key facts CAGR growth, deal value etc. related to sales deals of the company. Retrieve professionally designed Target Consumers And Market Valuation Overview Sales Deals Count Split By Sectors Rules PDF to effectively convey your message and captivate your listeners. Save time by selecting pre made slideshows that are appropriate for various topics, from business to educational purposes. These themes come in many different styles, from creative to corporate, and all of them are easily adjustable and can be edited quickly. Access them as PowerPoint templates or as Google Slides themes. You do not have to go on a hunt for the perfect presentation because Slidegeeks got you covered from everywhere.
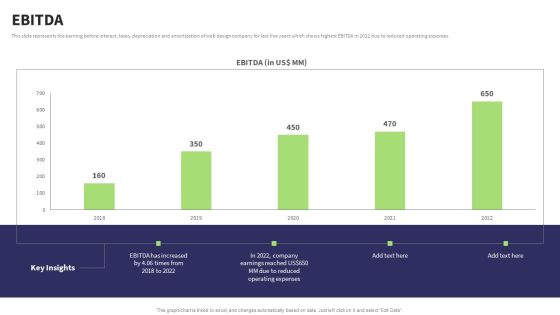
Website Design And Development Services Company Profile EBITDA Sample PDF
This slide represents the earning before interest, taxes, depreciation and amortization of web design company for last five years which shows highest EBITDA in 2022 due to reduced operating expenses. Here you can discover an assortment of the finest PowerPoint and Google Slides templates. With these templates, you can create presentations for a variety of purposes while simultaneously providing your audience with an eye catching visual experience. Download Website Design And Development Services Company Profile EBITDA Sample PDF to deliver an impeccable presentation. These templates will make your job of preparing presentations much quicker, yet still, maintain a high level of quality. Slidegeeks has experienced researchers who prepare these templates and write high quality content for you. Later on, you can personalize the content by editing the Website Design And Development Services Company Profile EBITDA Sample PDF.
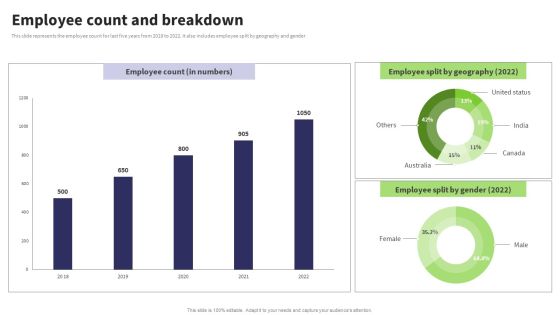
Website Design And Development Services Company Profile Employee Count And Breakdown Clipart PDF
This slide represents the employee count for last five years from 2018 to 2022. It also includes employee split by geography and gender. This Website Design And Development Services Company Profile Employee Count And Breakdown Clipart PDF from Slidegeeks makes it easy to present information on your topic with precision. It provides customization options, so you can make changes to the colors, design, graphics, or any other component to create a unique layout. It is also available for immediate download, so you can begin using it right away. Slidegeeks has done good research to ensure that you have everything you need to make your presentation stand out. Make a name out there for a brilliant performance.
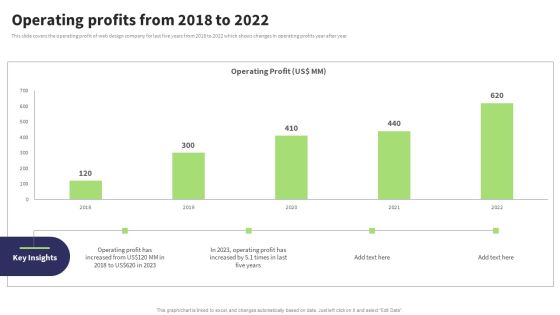
Website Design And Development Services Company Profile Operating Profits From 2018 To 2022 Information PDF
This slide covers the operating profit of web design company for last five years from 2018 to 2022 which shows changes in operating profits year after year. Do you know about Slidesgeeks Website Design And Development Services Company Profile Operating Profits From 2018 To 2022 Information PDF These are perfect for delivering any kind od presentation. Using it, create PowerPoint presentations that communicate your ideas and engage audiences. Save time and effort by using our pre designed presentation templates that are perfect for a wide range of topic. Our vast selection of designs covers a range of styles, from creative to business, and are all highly customizable and easy to edit. Download as a PowerPoint template or use them as Google Slides themes.
Metrics For Tracking Effectiveness Of Safety Measures In The Organization Ppt PowerPoint Presentation File Diagrams PDF
The following slide showcases five safety metrics to monitor the effectiveness of current safety measures. Key KPIs inluded here are reported incidents, accident free days, cases of near misses, audit acore, BBS score etc. Want to ace your presentation in front of a live audience Our Metrics For Tracking Effectiveness Of Safety Measures In The Organization Ppt PowerPoint Presentation File Diagrams PDF can help you do that by engaging all the users towards you. Slidegeeks experts have put their efforts and expertise into creating these impeccable powerpoint presentations so that you can communicate your ideas clearly. Moreover, all the templates are customizable, and easy to edit and downloadable. Use these for both personal and commercial use.
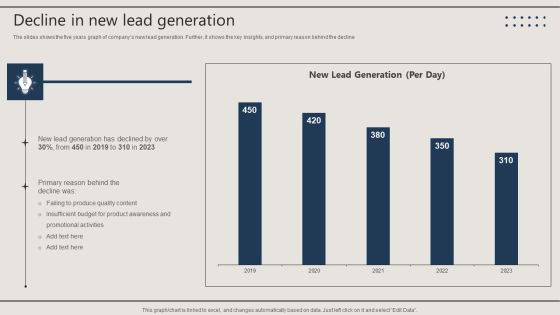
Promotion Techniques Used By B2B Firms Decline In New Lead Generation Guidelines PDF
The slides shows the five years graph of companys new lead generation. Further, it shows the key insights, and primary reason behind the decline. Get a simple yet stunning designed Promotion Techniques Used By B2B Firms Decline In New Lead Generation Guidelines PDF. It is the best one to establish the tone in your meetings. It is an excellent way to make your presentations highly effective. So, download this PPT today from Slidegeeks and see the positive impacts. Our easy to edit Promotion Techniques Used By B2B Firms Decline In New Lead Generation Guidelines PDF can be your go to option for all upcoming conferences and meetings. So, what are you waiting for Grab this template today.
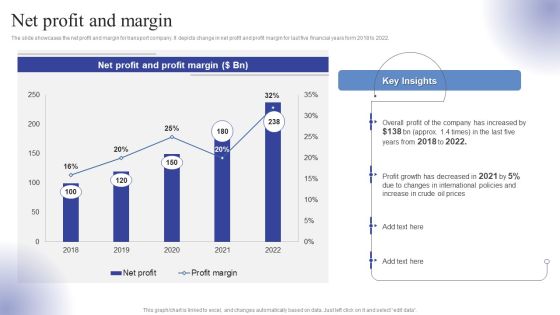
Logistics Transport Company Financial Report Net Profit And Margin Ppt Layouts Graphics Tutorials PDF
The slide showcases the net profit and margin for transport company. It depicts change in net profit and profit margin for last five financial years form 2018 to 2022. Slidegeeks is here to make your presentations a breeze with Logistics Transport Company Financial Report Net Profit And Margin Ppt Layouts Graphics Tutorials PDF With our easy-to-use and customizable templates, you can focus on delivering your ideas rather than worrying about formatting. With a variety of designs to choose from, you are sure to find one that suits your needs. And with animations and unique photos, illustrations, and fonts, you can make your presentation pop. So whether you are giving a sales pitch or presenting to the board, make sure to check out Slidegeeks first
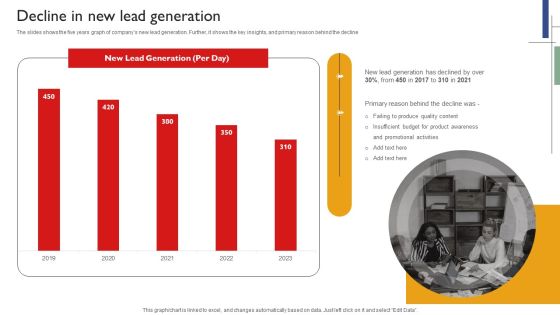
Techniques To Enhance Brand Awareness Decline In New Lead Generation Portrait PDF
The slides shows the five years graph of companys new lead generation. Further, it shows the key insights, and primary reason behind the decline Crafting an eye catching presentation has never been more straightforward. Let your presentation shine with this tasteful yet straightforward Techniques To Enhance Brand Awareness Decline In New Lead Generation Portrait PDF template. It offers a minimalistic and classy look that is great for making a statement. The colors have been employed intelligently to add a bit of playfulness while still remaining professional. Construct the ideal Techniques To Enhance Brand Awareness Decline In New Lead Generation Portrait PDF that effortlessly grabs the attention of your audience. Begin now and be certain to wow your customers.

Coffee Cafe Company Profile Coffee Yearly Gross Profit With Margin Mockup PDF
Following slide provides insights into Starbucks business gross profits from previous five years. It includes yearly gross profit, and key takeaways. Do you have an important presentation coming up Are you looking for something that will make your presentation stand out from the rest Look no further than Coffee Cafe Company Profile Coffee Yearly Gross Profit With Margin Mockup PDF. With our professional designs, you can trust that your presentation will pop and make delivering it a smooth process. And with Slidegeeks, you can trust that your presentation will be unique and memorable. So why wait Grab Coffee Cafe Company Profile Coffee Yearly Gross Profit With Margin Mockup PDF today and make your presentation stand out from the rest.

Profit And Loss Account Statement Summary Of Revenue Cost And Expenses Portrait PDF
The slides provide a glimpse of the projected profit and loss statement to visualize the platforms financial performance for the next five years. The key components are total revenue from operations, gross profit, EBITDA, etc. Do you have to make sure that everyone on your team knows about any specific topic I yes, then you should give Profit And Loss Account Statement Summary Of Revenue Cost And Expenses Portrait PDF a try. Our experts have put a lot of knowledge and effort into creating this impeccable Profit And Loss Account Statement Summary Of Revenue Cost And Expenses Portrait PDF. You can use this template for your upcoming presentations, as the slides are perfect to represent even the tiniest detail. You can download these templates from the Slidegeeks website and these are easy to edit. So grab these today.
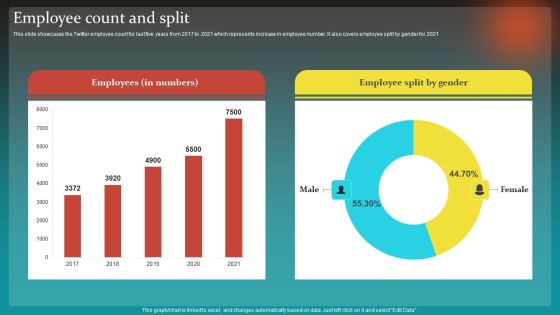
Social Network Business Summary Employee Count And Split Download PDF
This slide showcases the Twitter employee count for last five years from 2017 to 2021 which represents increase in employee number. It also covers employee split by gender for 2021 Do you know about Slidesgeeks Social Network Business Summary Employee Count And Split Download PDF. These are perfect for delivering any kind od presentation. Using it, create PowerPoint presentations that communicate your ideas and engage audiences. Save time and effort by using our pre designed presentation templates that are perfect for a wide range of topic. Our vast selection of designs covers a range of styles, from creative to business, and are all highly customizable and easy to edit. Download as a PowerPoint template or use them as Google Slides themes.
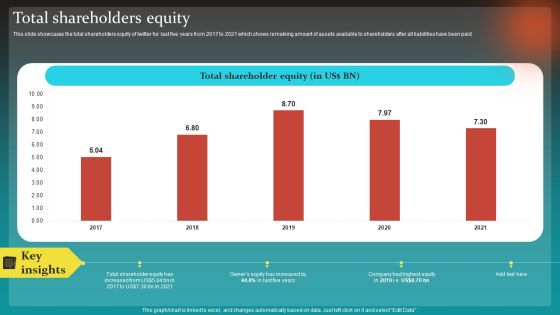
Social Network Business Summary Total Shareholders Equity Infographics PDF
This slide showcases the total shareholders equity of twitter for last five years from 2017 to 2021 which shows remaining amount of assets available to shareholders after all liabilities have been paid Do you have to make sure that everyone on your team knows about any specific topic I yes, then you should give Social Network Business Summary Total Shareholders Equity Infographics PDF a try. Our experts have put a lot of knowledge and effort into creating this impeccable Social Network Business Summary Total Shareholders Equity Infographics PDF. You can use this template for your upcoming presentations, as the slides are perfect to represent even the tiniest detail. You can download these templates from the Slidegeeks website and these are easy to edit. So grab these today.

Social Media Advertising Through Twitter Performance Analysis Dashboard For Twitter Marketing Introduction PDF
This slide represents the dashboard to analysis the performance of twitter advertising campaign. It provides information regarding total followers gained and lost, impressions, engagement rate. It also covers details of top five used and best performing hashtags performance. Are you in need of a template that can accommodate all of your creative concepts This one is crafted professionally and can be altered to fit any style. Use it with Google Slides or PowerPoint. Include striking photographs, symbols, depictions, and other visuals. Fill, move around, or remove text boxes as desired. Test out color palettes and font mixtures. Edit and save your work, or work with colleagues. Download Social Media Advertising Through Twitter Performance Analysis Dashboard For Twitter Marketing Introduction PDF and observe how to make your presentation outstanding. Give an impeccable presentation to your group and make your presentation unforgettable.

Revenue And Net Profit Trend For Brand Ideas PDF
This slide represents revenue and net profit for five years for the company. It showcase increase in revenue due to product recognition in market and gaining competitive edge in market. Formulating a presentation can take up a lot of effort and time, so the content and message should always be the primary focus. The visuals of the PowerPoint can enhance the presenters message, so our Revenue And Net Profit Trend For Brand Ideas PDF was created to help save time. Instead of worrying about the design, the presenter can concentrate on the message while our designers work on creating the ideal templates for whatever situation is needed. Slidegeeks has experts for everything from amazing designs to valuable content, we have put everything into Revenue And Net Profit Trend For Brand Ideas PDF.

 Home
Home