2

Real Estate Market Snapshot Ppt PowerPoint Presentation Outline Visuals
This is a real estate market snapshot ppt powerpoint presentation outline visuals. This is a two stage process. The stages in this process are homes sold, average home price, january.
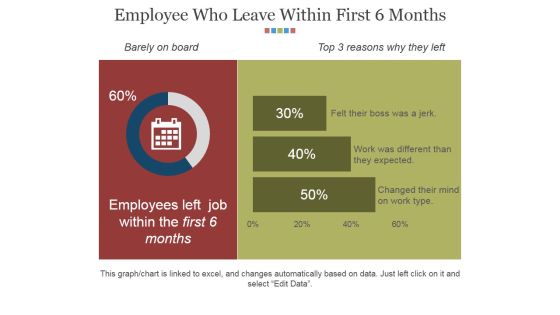
Employee Who Leave Within First 6 Months Ppt PowerPoint Presentation Gallery Grid
This is a employee who leave within first 6 months ppt powerpoint presentation gallery grid. This is a two stage process. The stages in this process are business, finance, marketing, strategy, analysis.
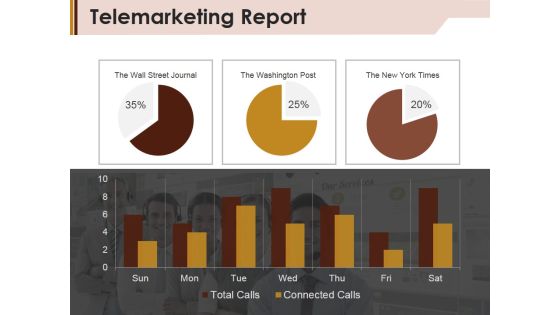
Telemarketing Report Template 1 Ppt PowerPoint Presentation Summary Example
This is a telemarketing report template 1 ppt powerpoint presentation summary example. This is a two stage process. The stages in this process are the wall street journal, the washington post, total calls, connected calls.

Revenue Split By Quarter And Geography Template 1 Ppt PowerPoint Presentation Infographics Graphics Template
This is a revenue split by quarter and geography template 1 ppt powerpoint presentation infographics graphics template. This is a two stage process. The stages in this process are domestic, exports, comments.

Summary Financials Wc Analysis Roce Roe Ppt PowerPoint Presentation Inspiration Templates
This is a summary financials wc analysis roce roe ppt powerpoint presentation inspiration templates. This is a two stage process. The stages in this process are working capital analysis, roce and roe, growth, finance.
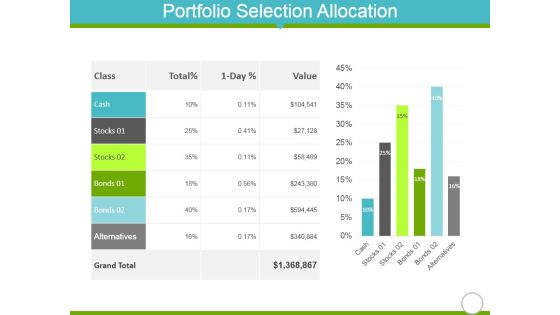
Portfolio Selection Allocation Template 1 Ppt PowerPoint Presentation Show Guidelines
This is a portfolio selection allocation template 1 ppt powerpoint presentation show guidelines. This is a two stage process. The stages in this process are cash, stocks, bonds, alternatives, values.

Addressable Market In Sector 1 Ppt PowerPoint Presentation Ideas Icons
This is a addressable market in sector 1 ppt powerpoint presentation ideas icons. This is a two stage process. The stages in this process are fossil fuels, nuclear, bioenergy, biofuels.
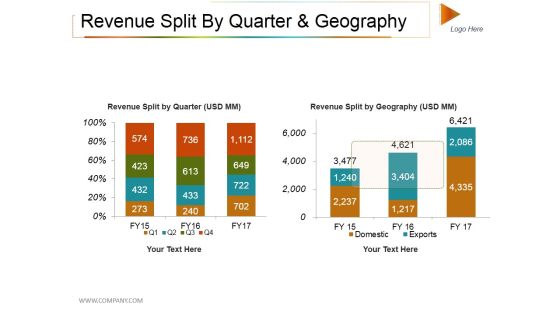
Revenue Split By Quarter And Geography Ppt PowerPoint Presentation Professional Slide Download
This is a revenue split by quarter and geography ppt powerpoint presentation professional slide download. This is a two stage process. The stages in this process are domestic, exports, revenue split by quarter, revenue split by geography.

Organic Visits And Backlinks Ppt PowerPoint Presentation Infographic Template Model
This is a organic visits and backlinks ppt powerpoint presentation infographic template model. This is a two stage process. The stages in this process are rank, domain authority, backlinks, google, search.

Capital Allocation Ppt PowerPoint Presentation Layouts Introduction
This is a capital allocation ppt powerpoint presentation layouts introduction. This is a two stage process. The stages in this process are capital expenditure, working capital, shareholder distribution, debt repayment.

Finance Dashboard Ppt PowerPoint Presentation Model Graphics Example
This is a finance dashboard ppt powerpoint presentation model graphics example. This is a two stage process. The stages in this process are sales, operating expenses, operating income, net income.

Clustered Column Ppt PowerPoint Presentation File Slide
This is a clustered column ppt powerpoint presentation file slide. This is a two stage process. The stages in this process are product, financial year, sales in percentage, bar graph.

Clustered Column Ppt PowerPoint Presentation Slides Smartart
This is a clustered column ppt powerpoint presentation slides smartart. This is a two stage process. The stages in this process are product, sales in percentage, financial year, bar graph.

Clustered Column Template 1 Ppt PowerPoint Presentation Outline File Formats
This is a clustered column template 1 ppt powerpoint presentation outline file formats. This is a two stage process. The stages in this process are product, bar graph, success, growth, finance.

Clustered Column Ppt PowerPoint Presentation File Graphics
This is a clustered column ppt powerpoint presentation file graphics. This is a two stage process. The stages in this process are product, financial year, sales in percentage, graph, growth.
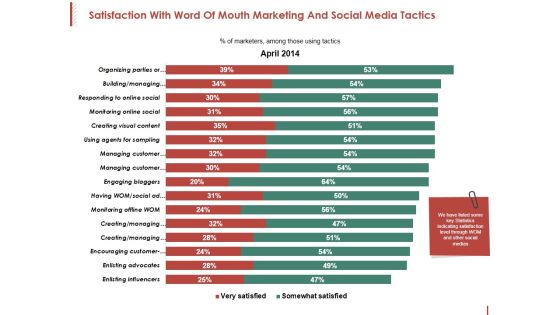
Satisfaction With Word Of Mouth Marketing And Social Media Tactics Ppt PowerPoint Presentation Professional Outline
This is a satisfaction with word of mouth marketing and social media tactics ppt powerpoint presentation professional outline. This is a two stage process. The stages in this process are managing customer, creating, engaging bloggers, enlisting advocates, enlisting influencers.
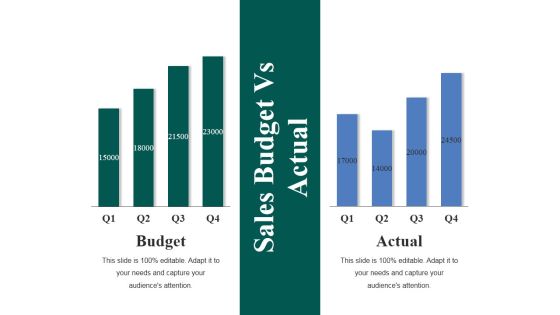
Sales Budget Vs Actual Ppt PowerPoint Presentation Show Master Slide
This is a sales budget vs actual ppt powerpoint presentation show master slide. This is a two stage process. The stages in this process are business, finance, management, analysis, budget, actual.

Activity Ratios Template 1 Ppt PowerPoint Presentation Outline Icons
This is a activity ratios template 1 ppt powerpoint presentation outline icons. This is a two stage process. The stages in this process are inventory turnover, receivables turnover, year, inventory ratio, category.

Activity Ratios Template 1 Ppt PowerPoint Presentation Icon File Formats
This is a activity ratios template 1 ppt powerpoint presentation icon file formats. This is a two stage process. The stages in this process are finance, analysis, compere, business, marketing.

Profitability Ratios Template 1 Ppt PowerPoint Presentation Infographic Template Images
This is a profitability ratios template 1 ppt powerpoint presentation infographic template images. This is a two stage process. The stages in this process are finance, analysis, compere, strategy, business.
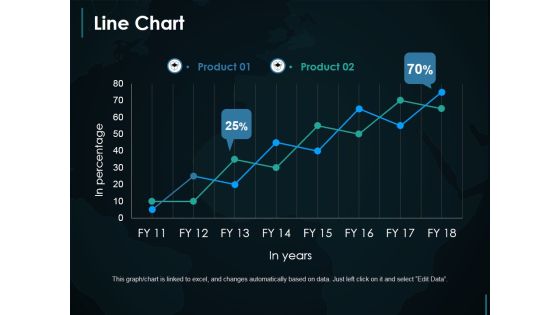
Line Chart Ppt PowerPoint Presentation Infographic Template Demonstration
This is a line chart ppt powerpoint presentation infographic template demonstration. This is a two stage process. The stages in this process are line chart, growth, finance, marketing, strategy.
Internal Rate Of Return Valuation Summary Ppt PowerPoint Presentation Icon Visual Aids
This is a internal rate of return valuation summary ppt powerpoint presentation icon visual aids. This is a two stage process. The stages in this process are business, marketing, analysis, strategy, compare.

Column Chart Ppt PowerPoint Presentation Infographic Template Example File
This is a column chart ppt powerpoint presentation infographic template example file. This is a two stage process. The stages in this process are growth, finance, business, marketing, analysis.

Clustered Column Ppt PowerPoint Presentation Gallery Structure
This is a clustered column ppt powerpoint presentation gallery structure. This is a two stage process. The stages in this process are product, sales in percentage, financial year, bar graph, finance.
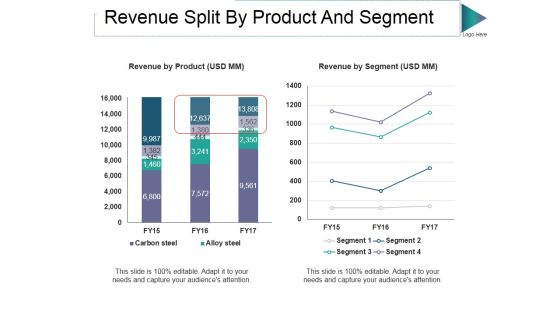
Revenue Split By Product And Segment Ppt PowerPoint Presentation Outline Graphic Images
This is a revenue split by product and segment ppt powerpoint presentation outline graphic images. This is a two stage process. The stages in this process are revenue by product, revenue by segment, segment, alloy steel, carbon steel.

Revenue Split By Quarter And Geography Ppt PowerPoint Presentation Layouts Master Slide
This is a revenue split by quarter and geography ppt powerpoint presentation layouts master slide. This is a two stage process. The stages in this process are revenue split by geography, revenue split by quarter, domestic, exports, column.
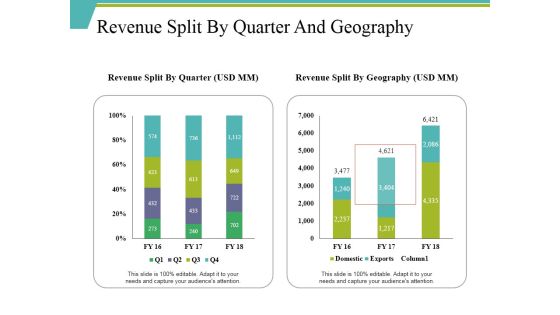
Revenue Split By Quarter And Geography Ppt PowerPoint Presentation Ideas Designs
This is a revenue split by quarter and geography ppt powerpoint presentation ideas designs. This is a two stage process. The stages in this process are revenue split by quarter, revenue split by geography, domestic, exports, column.
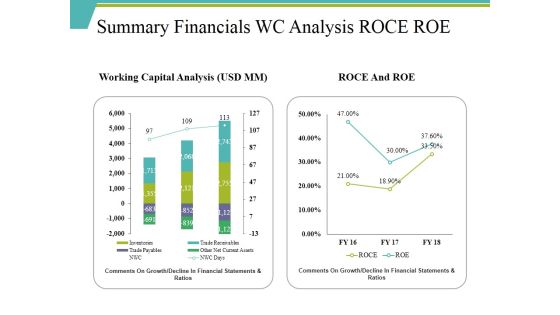
Summary Financials Wc Analysis Roce Roe Ppt PowerPoint Presentation File Slide
This is a summary financials wc analysis roce roe ppt powerpoint presentation file slide. This is a two stage process. The stages in this process are roce and roe, working capital analysis, inventories, trade payables, trade receivables.

Solvency Ratios Ppt PowerPoint Presentation Professional
This is a solvency ratios ppt powerpoint presentation professional. This is a two stage process. The stages in this process are debt equity ratio, time interest earned ratio, total liabilities, total equity, interest expense.
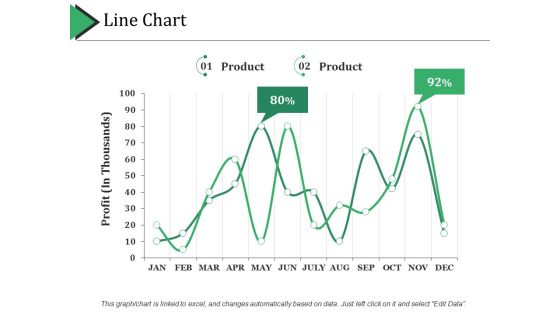
Line Chart Ppt PowerPoint Presentation Portfolio Graphics Pictures
This is a line chart ppt powerpoint presentation portfolio graphics pictures. This is a two stage process. The stages in this process are line chart, finance, growth, strategy, business.

Summary Financials Wc Analysis Roce Roe Ppt PowerPoint Presentation Professional Portfolio
This is a summary financials wc analysis roce roe ppt powerpoint presentation professional portfolio. This is a two stage process. The stages in this process are working capital analysis, roce and roe, inventories.
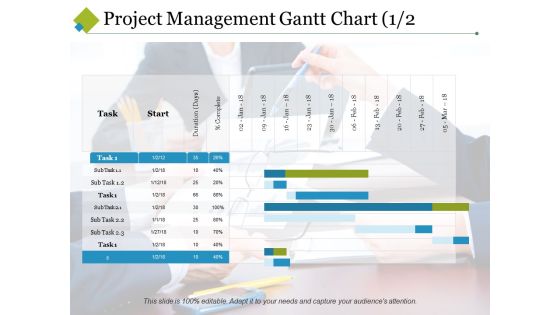
Project Management Gantt Chart Template 1 Ppt PowerPoint Presentation Visual Aids Summary
This is a project management gantt chart template 1 ppt powerpoint presentation visual aids summary. This is a two stage process. The stages in this process are start, task, sub task, duration, complete.

Clustered Column Ppt PowerPoint Presentation Infographic Template Backgrounds
This is a clustered column ppt powerpoint presentation infographic template backgrounds. This is a two stage process. The stages in this process are sales in percentage, financial year, product.

Clustered Column Ppt PowerPoint Presentation Icon Objects
This is a clustered column ppt powerpoint presentation icon objects. This is a two stage process. The stages in this process are clustered column, product, growth, finance, bar graph.
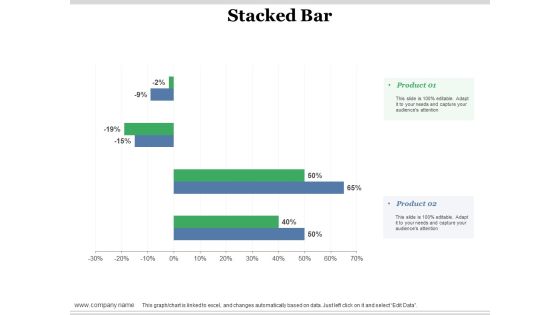
Stacked Bar Ppt PowerPoint Presentation Slides Layout Ideas
This is a stacked bar ppt powerpoint presentation slides layout ideas. This is a two stage process. The stages in this process are stacked bar, product, percentage, finance, business.

Centric Organization Customer Orientation Ppt PowerPoint Presentation Summary Clipart Images
This is a centric organization customer orientation ppt powerpoint presentation summary clipart images. This is a two stage process. The stages in this process are customer orientation, solution mindset, advice orientation, business processes.

Globe With Location Pointer Ppt PowerPoint Presentation Design Templates
This is a globe with location pointer ppt powerpoint presentation design templates. This is a two stage process. The stages in this process are navigation, gps tracking, location tracking.

Comparison Currency Ppt PowerPoint Presentation File Background Images
This is a comparison currency ppt powerpoint presentation file background images. This is a two stage process. The stages in this process are comparison, finance, marketing, management, investment, analysis.

Search Engine Optimization Metrics Diagram Ppt Presentation
This is a search engine optimization metrics diagram ppt presentation. This is a two stage process. The stages in this process are understanding seo metrics, people visitor this site, visitor, unique visitors, page views, pages visit, avg visit duration, renewing visitor, new visitor.

Web Trends Analyzer Diagram Ppt Powerpoint Images
This is a web trends analyzer diagram ppt powerpoint images. This is a two stage process. The stages in this process are reports, driving traffic to solutions, campaigns, heat maps, campaign reports, content, default, events, hoot suite, optimize, unlock referrer, search, referring sites, social, onsite, 32 ok total visits, 100 percent 32 okc oversion rate.

Financial Dashboard Ppt Powerpoint Presentation Templates
This is a financial dashboard ppt powerpoint presentation templates. This is a two stage process. The stages in this process are revenue overview, total revenue, federal revenue, budget total, budget actual, expenditure overview, year to date ytd expenditures, country service, education service, general service, total expenditures.

Balance Scale With Like And Dislike Icons Powerpoint Template
Concept of customer feedback has been displayed in this power point template diagram. This PPT diagram contains graphic of balance scale with like and dislike icons. Use this PPT diagram for business and management related presentations.

Population Census Male Female Ratio Powerpoint Template
This business slide contains graphics of pie charts with male female icons. This template helps to display male female population census. Present your views using this innovative slide and be assured of leaving a lasting impression.
Ways To Save Money Ppt PowerPoint Presentation Pictures Graphics Download
This is a megaphone for business promotion ppt powerpoint presentation visual aids infographics. This is a stage process. The stages in this process are support, assistance, hand holding.

Top B2B Lead Generating Channel Key Guidelines PDF
Deliver an awe inspiring pitch with this creative top b2b lead generating channel key guidelines pdf bundle. Topics like top b2b lead generating channel 2 or 2 can be discussed with this completely editable template. It is available for immediate download depending on the needs and requirements of the user.
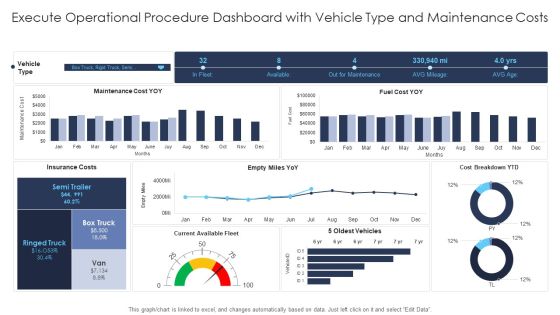
Execute Operational Procedure Dashboard With Vehicle Type And Maintenance Costs Introduction PDF
Deliver and pitch your topic in the best possible manner with this execute operational procedure dashboard with vehicle type and maintenance costs introduction pdf. Use them to share invaluable insights on execute operational procedure dashboard with raci chart and action timeline 2 or 2 and impress your audience. This template can be altered and modified as per your expectations. So, grab it now.

Currency Trading Options Diagram Ppt Presentation
This is a currency trading options diagram ppt presentation. This is a two stage process. The stages in this process are broker, bank, currency, forex, trading.
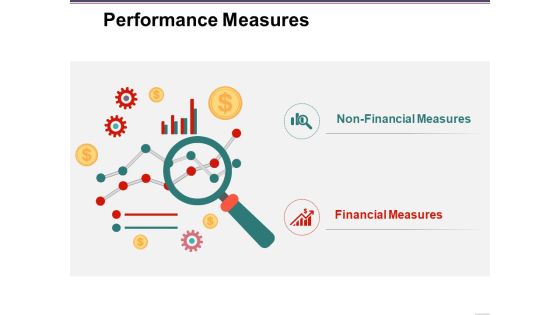
Performance Measures Ppt PowerPoint Presentation Layouts Clipart Images
This is a performance measures ppt powerpoint presentation layouts clipart images. This is a two stage process. The stages in this process are non financial measures, financial measures, business, icons, marketing.
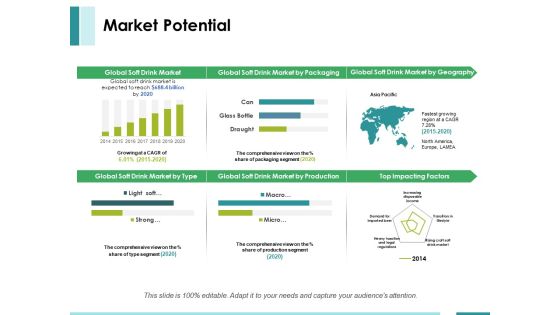
Market Potential Ppt PowerPoint Presentation Pictures Infographics
This is a market potential ppt powerpoint presentation pictures infographics. This is a two stage process. The stages in this process are top impacting factors, asia pacific, global soft drink market by type, global soft drink market.

Linear Periodization Volume And Time Ppt PowerPoint Presentation Summary Topics
This is a linear periodization volume and time ppt powerpoint presentation summary topics. This is a two stage process. The stages in this process are linear periodization, linear growth, linear progression.

Chart With Magnifying Glass For Business Research Ppt PowerPoint Presentation Inspiration Shapes
This is a chart with magnifying glass for business research ppt powerpoint presentation inspiration shapes. This is a two stage process. The stages in this process are metrics icon, kpis icon, statistics icon.
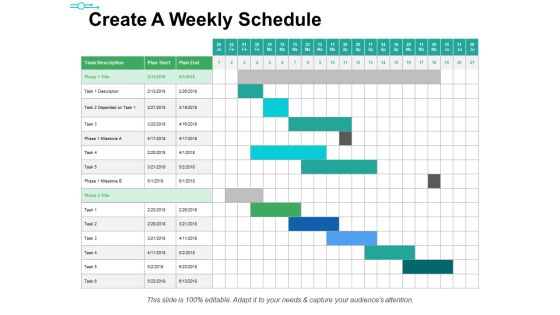
Create A Weekly Schedule Ppt PowerPoint Presentation Portfolio Infographics
This is a create a weekly schedule ppt powerpoint presentation portfolio infographics. This is a two stage process. The stages in this process are task description, plan start, plan end, schedule.

Cost Analysis Ppt PowerPoint Presentation Ideas Templates
This is a cost analysis ppt powerpoint presentation ideas templates. This is a two stage process. The stages in this process are cost analysis, insurance, maintenance, salaries, manufacturing equipment.

Effective Negotiation Strategies And Tactics Ppt Powerpoint Presentation Themes
This is a effective negotiation strategies and tactics ppt powerpoint presentation themes. This is a two stage process. The stages in this process are contract management, contract negotiation, deal making.
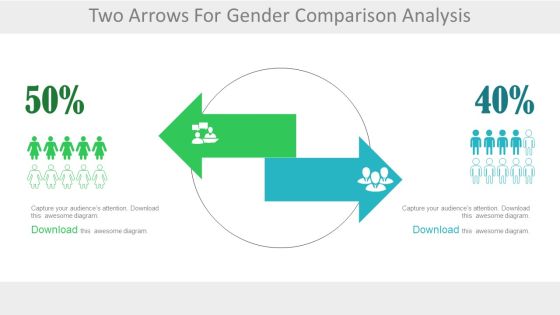
Two Arrows For Male Female Ratio Analysis Powerpoint Slides
Use this professionally created PowerPoint template to create the perfect slide to educate your audience about comparisons between choices and opinions of different genders. The slide can be used to denote the sex ratio or the changes occurring in the same. The 2 colored arrows can be used to refer to the 2 genders or even 2 teams or groups. This slide can be effectively used in corporate or business presentations to demonstrate the conversion of probable customers to sale. Other concepts like brain drain or brand preference or people making different choices can also be demonstrated using this template. A human resource manager can use this slide to demonstrate the transfer of employees to other locations or companies.
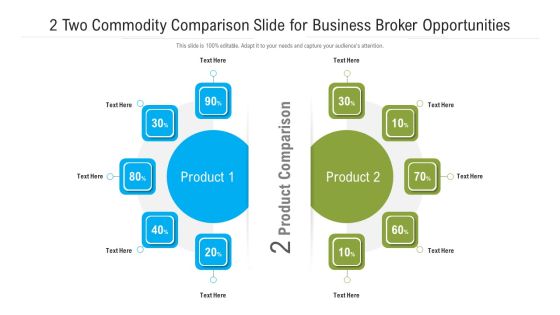
Two Commodity Comparison Slide For Business Broker Opportunities Mockup PDF
Persuade your audience using this two commodity comparison slide for business broker opportunities mockup pdf. This PPT design covers two stages, thus making it a great tool to use. It also caters to a variety of topics including 2 two commodity comparison slide for business broker opportunities. Download this PPT design now to present a convincing pitch that not only emphasizes the topic but also showcases your presentation skills.
Risk Assessment Template 1 Ppt PowerPoint Presentation File Icons
This is a risk assessment template 2 ppt powerpoint presentation infographic template vector. This is a five stage process. The stages in this process are insignificant, minor, moderate, catastrophic, extreme risk.

Introducing Inbound Marketing For Organization Promotion Conversational Marketing An Introduction Diagrams PDF
Conversational marketing is an approach to marketing that lets businesses engage visitors with real time, one-to-one interaction. It can be achieved in 2 ways- Live Chat and Chatbots. This is a introducing inbound marketing for organization promotion conversational marketing an introduction diagrams pdf template with various stages. Focus and dispense information on two stages using this creative set, that comes with editable features. It contains large content boxes to add your information on topics like live chat, chatbots. You can also showcase facts, figures, and other relevant content using this PPT layout. Grab it now.

Classified Data Memo Record With Strategic Goals Target Market Demographics For Barwash 99 Structure PDF
The slide provides information about the target market demographics for Barwash 99 that is primarily divided into 2 categories that are students and young professionals aged between 20 and 32 years. Presenting classified data memo record with strategic goals target market demographics for barwash 99 structure pdf to provide visual cues and insights. Share and navigate important information on two stages that need your due attention. This template can be used to pitch topics like students, young professionals. In addtion, this PPT design contains high resolution images, graphics, etc, that are easily editable and available for immediate download.

CIM With Operation And Account Statements Target Market Demographics For Barwash 99 Summary PDF
The slide provides information about the target market demographics for Barwash 99 that is primarily divided into 2 categories that are students and young professionals aged between 20 and 32 years. This is a cim with operation and account statements target market demographics for barwash 99 summary pdf template with various stages. Focus and dispense information on two stages using this creative set, that comes with editable features. It contains large content boxes to add your information on topics like target market. You can also showcase facts, figures, and other relevant content using this PPT layout. Grab it now.

 Home
Home