AI PPT Maker
Templates
PPT Bundles
Design Services
Business PPTs
Business Plan
Management
Strategy
Introduction PPT
Roadmap
Self Introduction
Timelines
Process
Marketing
Agenda
Technology
Medical
Startup Business Plan
Cyber Security
Dashboards
SWOT
Proposals
Education
Pitch Deck
Digital Marketing
KPIs
Project Management
Product Management
Artificial Intelligence
Target Market
Communication
Supply Chain
Google Slides
Research Services
 One Pagers
All Categories
-
Home
- Customer Favorites
- 2 Steps
2 Steps
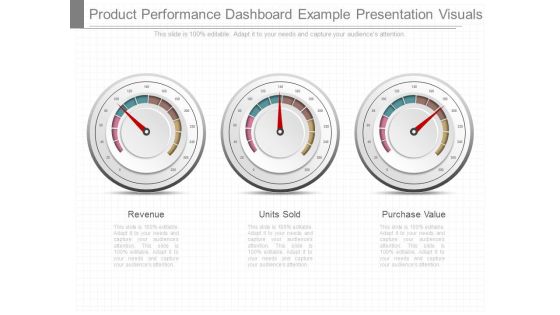
Product Performance Dashboard Example Presentation Visuals
This is a product performance dashboard example presentation visuals. This is a three stage process. The stages in this process are revenue, units sold, purchase value.

Project Kpi Sample Dashboard Diagram Powerpoint Images
This is a project kpi sample dashboard diagram powerpoint images. This is a four stage process. The stages in this process are costs thousands, employee names, burndown, project status.

Project Management Kpi Dashboard Diagram Powerpoint Images
This is a project management kpi dashboard diagram powerpoint images. This is a four stage process. The stages in this process are project budget, project goals, project task management, project schedule.

Project Management Status Dashboard Diagram Powerpoint Ideas
This is a project management status dashboard diagram powerpoint ideas. This is a six stage process. The stages in this process are tabular reports, project s status, task status, visual reports, completed tasks, task in progress.
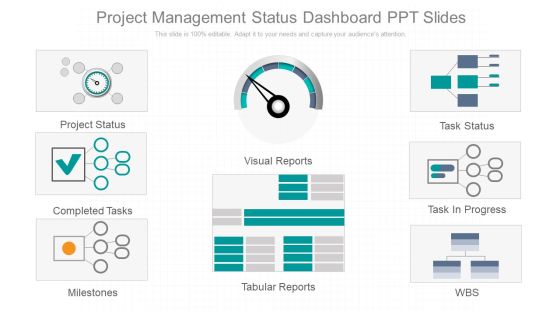
Project Management Status Dashboard Ppt Slides
This is a project management status dashboard ppt slides. This is a eight stage process. The stages in this process are project status, completed tasks, milestones, visual reports, tabular reports, task status, task in progress, wbs.

Project Status Visual Dashboard Indicator Ppt Images Gallery
This is a project status visual dashboard indicator ppt images gallery. This is a four stage process. The stages in this process are business, marketing, dashboard, measure, presentation.
Project Tracking Dashboard Template Ppt Sample
This is a project tracking dashboard template ppt sample. This is a five stage process. The stages in this process are requirements, analytics, needs, performance, analysis.

Average Days Sales Outstanding Analysis Ppt Example
This is a average days sales outstanding analysis ppt example. This is a four stage process. The stages in this process are target for week, inventory, sales vs quotes, sales vs quotes.

Best Looking Dashboards Diagram Example File
This is a best looking dashboards diagram example file. This is a three stage process. The stages in this process are business, marketing, finance, presentation, management.

Bi Dashboard Design For Solutions Ppt Powerpoint Slides
This is a bi dashboard design for solutions ppt powerpoint slides. This is a four stage process. The stages in this process are total understand, total brands, total revenue, total sales.

Bi Dashboard Gallery Diagram Powerpoint Presentation
This is a bi dashboard gallery diagram powerpoint presentation. This is a four stage process. The stages in this process are business intelligence, month.

Build Dashboard For Business Diagram Powerpoint Show
This is a build dashboard for business diagram powerpoint show. This is a four stage process. The stages in this process are average internal pv examination lead time, average entry variance, average internal audit lead time, amount contribution.

Business Analysis Kpi Diagram Powerpoint Slides
This is a business analysis kpi diagram powerpoint slides. This is a one stage process. The stages in this process are performance level.

Business Company Dashboards Ppt Powerpoint Slide Show
This is a business company dashboards ppt powerpoint slide show. This is a four stage process. The stages in this process are presentation, finance, management, business, strategy, success.

Business Dashboard Diagram Ppt Powerpoint Slides
This is a business dashboard diagram ppt powerpoint slides. This is a three stage process. The stages in this process are low, medium, high.

Business Departments Performance Metrics Ppt Slides
This is a business departments performance metrics ppt slides. This is a seven stage process. The stages in this process are engineering, construction, maintenance, operations, safety, finance, environment.

Business Intelligence Dashboard Design Ppt Powerpoint Topics
This is a business intelligence dashboard design ppt powerpoint topics. This is a four stage process. The stages in this process are sales analysis, sales forecasting, global distribution, sales by region, latin america, north america, eastern europe, western europe.

Business Kpi Dashboard Design Presentation Diagrams
This is a business kpi dashboard design presentation diagrams. This is a four stage process. The stages in this process are idea, plan, strategy, solution analysis.

Business Kpi Dashboard Diagram Powerpoint Templates
This is a business kpi dashboard diagram powerpoint templates. This is a six stage process. The stages in this process are analytics, cost per sales, reporting, kpis, dashboard, visualization.

Business Kpi Dashboard Example Powerpoint Presentation
This is a business kpi dashboard example powerpoint presentation. This is a four stage process. The stages in this process are marketing, sales, operations, customer.
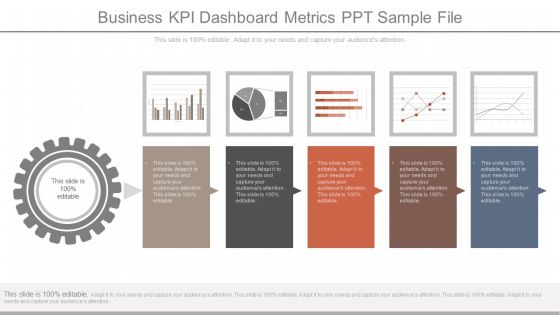
Business Kpi Dashboard Metrics Ppt Sample File
This is a business kpi dashboard metrics ppt sample file. This is a five stage process. The stages in this process are business, finance, management, success, marketing, presentation.

Business Management Dashboard Design Ppt Slides Show
This is a business management dashboard design ppt slides show. This is a four stage process. The stages in this process are crm system, property system, asset system, finance system.

Business Object Crystal Report Ppt Powerpoint Show
This is a business object crystal report ppt powerpoint show. This is a three stage process. The stages in this process are actual vs budget, monthly sales, monthly sales forecasting, country, total sales, percent of total, usa, germany, england, switzerland, italy, others.

Business Performance Dashboard Analysis Diagram Powerpoint Slides
This is a business performance dashboard analysis diagram powerpoint slides. This is a three stage process. The stages in this process are measure, business, management, presentation, process.

Business Process Metrics Ppt Sample Presentations
This is a business process metrics ppt sample presentations. This is a five stage process. The stages in this process are communication study, goal process, success, strategic system, sales review.

Capital Markets Dashboard Ppt Powerpoint Slide Background
This is a capital markets dashboard ppt powerpoint slide background. This is a three stage process. The stages in this process are weekly sales, product inventory, key performance indicators.

Competitive Intelligence Dashboard Diagram Ppt Slides
This is a competitive intelligence dashboard diagram ppt slides. This is a four stage process. The stages in this process are monthly sales, inventory turns, customer complaints, company, subject area.

Cool Dashboards For Product Showcase Ppt Powerpoint Slides
This is a cool dashboards for product showcase ppt powerpoint slides. This is a three stage process. The stages in this process are product showcase, product information, products variety.

Customer Retention Kpi Measures Ppt Example
This is a customer retention kpi measures ppt example. This is a four stage process. The stages in this process are retained, new, converted, attrition.
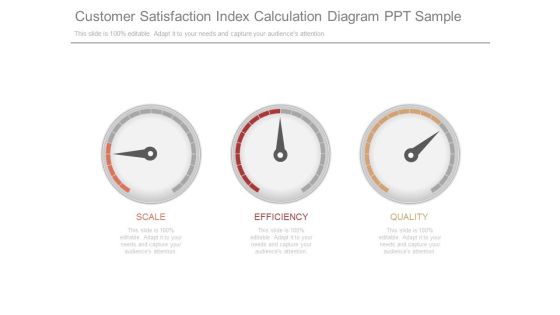
Customer Satisfaction Index Calculation Diagram Ppt Sample
This is a customer satisfaction index calculation diagram ppt sample. This is a three stage process. The stages in this process are scale, efficiency, quality.

Customer Service Key Performance Indicators Ppt Example
This is a customer service key performance indicators ppt example. This is a three stage process. The stages in this process are overall satisfaction with service, satisfaction with value for money, overall satisfaction with relationship.

Daily Executive Dashboards For Web Ppt Presentation Ideas
This is a daily executive dashboards for web ppt presentation ideas. This is a six stage process. The stages in this process are homepage, login, purchase ticket, email confirmation, ecommerce website, revenue per minute.

Dashboard Design And Development For Travel Diagram Background
This is a dashboard design and development for travel diagram background. This is a five stage process. The stages in this process are number of trips, sales, delayed flights, regional load, flight expense.

Dashboard Design Sample Ppt Powerpoint Slide Ideas
This is a dashboard design sample ppt powerpoint slide ideas. This is a four stage process. The stages in this process are your current setup, message board, quick stats, progress towards goals, total posts, comments, social reactions, new users, hourly visits, bounce rate.

Dashboard Design Tools Ppt Presentation Slides
This is a dashboard design tools ppt presentation slides. This is a three stage process. The stages in this process are performance, speed, energy.

Dashboard For Six Sigma Ppt Powerpoint Templates
This is a dashboard for six sigma ppt powerpoint templates. This is a four stage process. The stages in this process are program savings, project count, project cycle time, six sigma training.

Dashboard Performance Indicators Ppt Powerpoint Images
This is a dashboard performance indicators ppt powerpoint images. This is a four stage process. The stages in this process are daily activities, average consumption, covered distance, clock.

Dashboard Program Ppt Presentation Powerpoint
This is a dashboard program ppt presentation powerpoint. This is a six stage process. The stages in this process are tasks, progress, matrix, resource, utilization, time, safety, progress, sales rate.

Dashboard Project Plan Presentation Powerpoint Example
This is a dashboard project plan presentation powerpoint example. This is a four stage process. The stages in this process are build, test, design, analysis.

Dashboard System Ppt Powerpoint Ideas
This is a dashboard system ppt powerpoint ideas. This is a four stage process. The stages in this process are description.

Dashboard Visualization Ppt Presentation Powerpoint
This is a dashboard visualization ppt presentation powerpoint. This is a three stage process. The stages in this process are design, category.

Dashboards And Scorecards Comparison Diagram Ppt Slides
This is a dashboards and scorecards comparison diagram ppt slides. This is a three stage process. The stages in this process are dashboard, balanced scorecard, differences, performance management, periodically monthly, gps shows how will arrive, is used for, is update, in automobile it is, performance monitoring, in real time, automobile dashboard shows how your car is operating.

Data Dashboard Diagram Presentation Powerpoint Example
This is a data dashboard diagram presentation powerpoint example. This is a seven stage process. The stages in this process are root cause, incident trends and their status, contributing cause, incident by category and severity, incident by category, incident by facilities, incident severity by.

Digital Marketing Dashboard Powerpoint Slide Images
This is a digital marketing dashboard powerpoint slide images. This is a five stage process. The stages in this process are lead generation, website, email, advertising, social media.
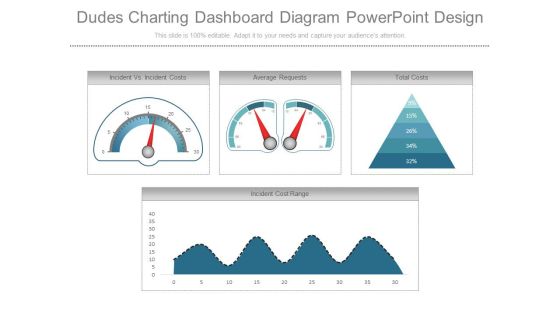
Dudes Charting Dashboard Diagram Powerpoint Design
This is a dudes charting dashboard diagram powerpoint design. This is a four stage process. The stages in this process are incident vs incident costs, average requests, total costs, incident cost range.

Annual Pipeline Value Presentation Visual Aids
This is a annual pipeline value presentation visual aids. This is a seven stage process. The stages in this process are safety inspection score, avg cost hour, on time shipment, ndt acceptance rate, ncr customer accept, annual pipeline value, indirect man hours.

Average Profit Margin Examples Presentation Slides
This is a average profit margin examples presentation slides. This is a five stage process. The stages in this process are sales growth, sales opportunities, product performance, average profit margin, sales target.

Event Policy Planning Template Ppt Slides
This is a event policy planning template ppt slides. This is a five stage process. The stages in this process are direction, security, policy, planning, event.
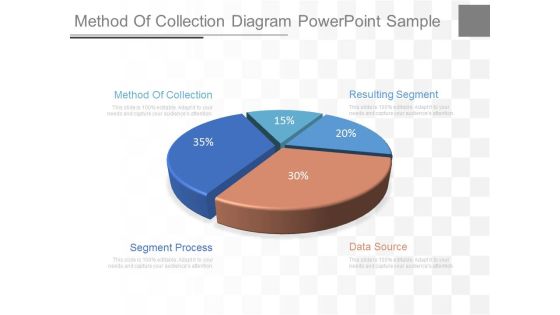
Method Of Collection Diagram Powerpoint Sample
This is a method of collection diagram powerpoint sample. This is a five stage process. The stages in this process are method of collection, segment process, data source, resulting segment.

Project Managers Executives Ppt Slides
This is a project managers executives ppt slides. This is a four stage process. The stages in this process are team members, resource managers, project managers, executives.
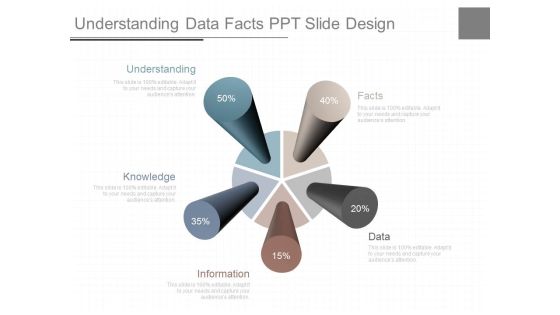
Understanding Data Facts Ppt Slide Design
This is a understanding data facts ppt slide design. This is a five stage process. The stages in this process are understanding, knowledge, information, data, facts.

Custom Market Research Format Diagram Presentation Ideas
This is a custom market research format diagram presentation ideas. This is a six stage process. The stages in this process are markets, products, industries, customers, vendors, competitors, custom market research.

Actual Project Management Linguistic Presentation Visual Aids
This is a actual project management linguistic presentation visual aids. This is a four stage process. The stages in this process are area, kpi name, target compliance, actual, linguistic, project management, engineering, finance.

Current Ratio Working Capital Presentation Visual Aids
This is a current ratio working capital presentation visual aids. This is a five stage process. The stages in this process are current ratio, working capital, return on equity, vendor expenses, income and expenses.

Bank Dashboards Sample Ppt Templates
This is a bank dashboards sample ppt templates. This is a four stage process. The stages in this process are bank pipeline, loans pipeline, lead by source campaign, deposit pipeline, january, february, march, april.

Business Management Dashboard Ppt Example
This is a business management dashboard ppt example. This is a three stage process. The stages in this process are sales figure, regional sales breakdown, product break.

Cpi Spi Dashboard Sample Diagram Powerpoint Slide Designs
This is a cpi spi dashboard sample diagram powerpoint slide designs. This is a four stage process. The stages in this process are cpi spi, performance summary, cost schedule variance, task matrix.

Customer Service Kpi Diagram Powerpoint Slide Design
This is a customer service kpi diagram powerpoint slide design. This is a three stage process. The stages in this process are information desk, valet damage claims, gift shop sales.

Data Visualization For Market Ppt Example
This is a data visualization for market ppt example. This is a six stage process. The stages in this process are tree map chart, exploded pie chart, semi circle chart, bubble chart, line chart, stacked chart, series.

Digital Dashboard Resource Kit Ppt Powerpoint Slides Design
This is a digital dashboard resource kit ppt powerpoint slides design. This is a four stage process. The stages in this process are sales rate, progress, profits, safety.
