2 Sections

Bar Graph 7 QC Tools Ppt PowerPoint Presentation Styles Structure
This is a bar graph 7 qc tools ppt powerpoint presentation styles structure. This is a three stage process. The stages in this process are bar graph, finance, marketing, analysis, investment.
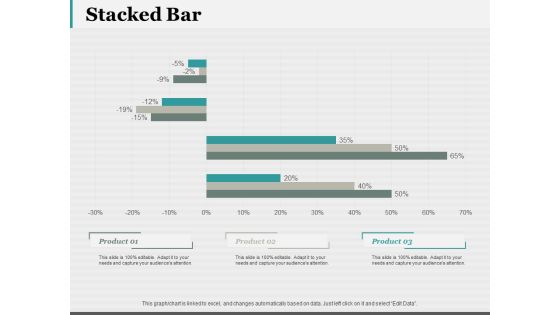
Stacked Bar 7 QC Tools Ppt PowerPoint Presentation Portfolio Smartart
This is a stacked bar 7 qc tools ppt powerpoint presentation portfolio smartart. This is a three stage process. The stages in this process are stacked bar, finance, marketing, strategy, business.

Clustered Bar Capability Maturity Matrix Ppt PowerPoint Presentation Summary Show
This is a clustered bar capability maturity matrix ppt powerpoint presentation summary show. This is a three stage process. The stages in this process are clustered bar, product, year, business, marketing.
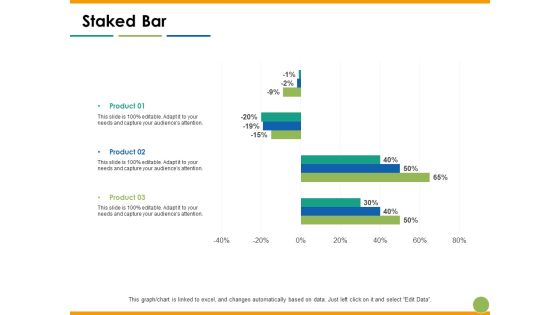
Staked Bar Capability Maturity Matrix Ppt PowerPoint Presentation Slides Outfit
This is a staked bar capability maturity matrix ppt powerpoint presentation slides outfit. This is a three stage process. The stages in this process are staked bar, product, year, finance, percentage.

Stacked Bar Chart Ppt PowerPoint Presentation Portfolio Templates
This is a stacked bar chart ppt powerpoint presentation portfolio templates. This is a three stage process. The stages in this process are stacked bar chart, product, year, business, finance.
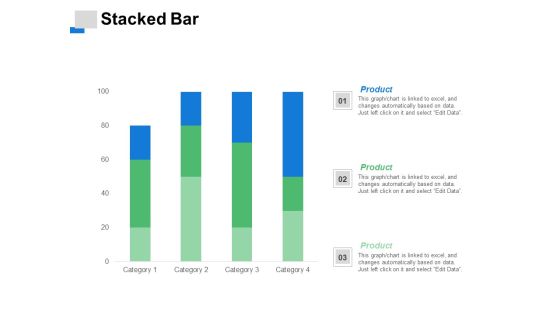
Stacked Bar Finance Ppt PowerPoint Presentation Pictures Gallery
This is a stacked bar finance ppt powerpoint presentation pictures gallery. This is a three stage process. The stages in this process are stacked bar, finance, marketing, analysis, investment.
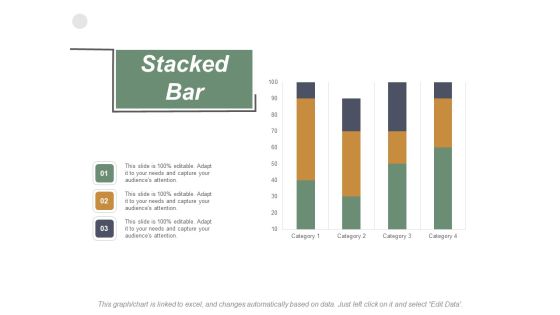
Stacked Bar Finance Ppt PowerPoint Presentation Summary Skills
This is a stacked bar finance ppt powerpoint presentation summary skills. This is a three stage process. The stages in this process are stacked bar, finance, marketing, analysis, business.

Stacked Bar Finance Marketing Ppt PowerPoint Presentation Summary Slide Download
This is a stacked bar finance marketing ppt powerpoint presentation summary slide download. This is a three stage process. The stages in this process are stacked bar, finance, marketing, analysis, investment.

Bar Chart Finance Ppt Powerpoint Presentation Styles Skills
This is a bar chart finance ppt powerpoint presentation styles skills. This is a three stage process. The stages in this process are bar chart, finance, marketing, management, analysis.

Clustered Bar Investment Ppt Powerpoint Presentation Gallery Clipart
This is a clustered bar investment ppt powerpoint presentation gallery clipart. This is a three stage process. The stages in this process are clustered bar, finance, marketing, management, analysis.
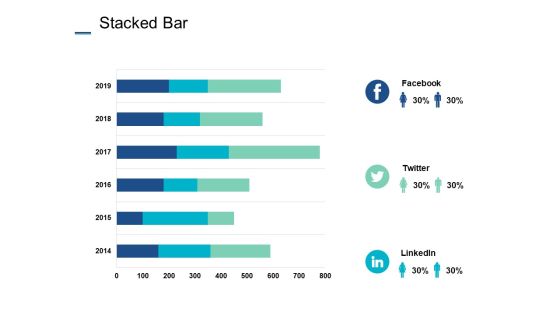
Stacked Bar Investment Ppt PowerPoint Presentation Ideas Graphics Tutorials
This is a stacked bar investment ppt powerpoint presentation ideas graphics tutorials. This is a three stage process. The stages in this process are stacked bar, finance, marketing, analysis, business, investment.

Clustered Bar Analyse Investment Ppt PowerPoint Presentation Outline Tips
This is a clustered bar analyse investment ppt powerpoint presentation outline tips . This is a three stage process. The stages in this process are clustered bar, finance, marketing, management, investment.

Clustered Bar Finance Ppt Powerpoint Presentation Ideas Themes
This is a clustered bar finance ppt powerpoint presentation ideas themes. This is a three stage process. The stages in this process are clustered bar, product, in percentage, years, profit.
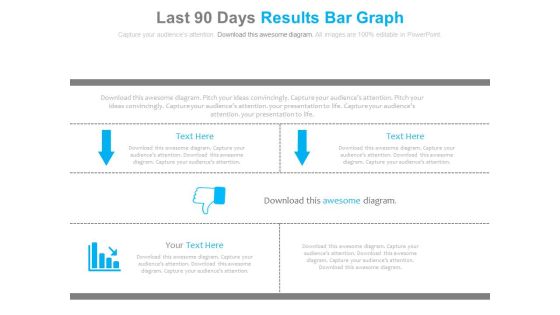
Last 90 Days Results Bar Graph Ppt Slides
This is a last 90 days results bar graph ppt slides. This is a three stage process. The stages in this process are arrows, business, marketing.
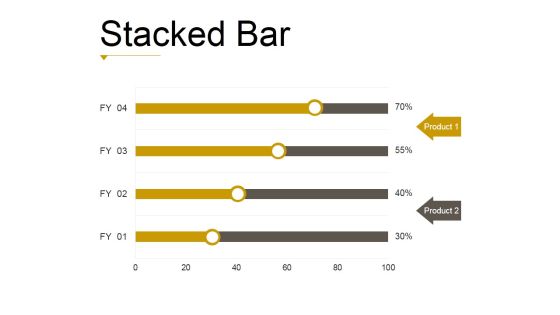
Stacked Bar Template 1 Ppt PowerPoint Presentation Gallery
This is a stacked bar template 1 ppt powerpoint presentation gallery. This is a four stage process. The stages in this process are business, strategy, analysis, marketing, finance.

Bar Graph Ppt PowerPoint Presentation Layouts Graphic Images
This is a bar graph ppt powerpoint presentation layouts graphic images. This is a four stage process. The stages in this process are product, business, marketing, growth.

Bar Chart Ppt PowerPoint Presentation Styles Graphics Example
This is a bar chart ppt powerpoint presentation styles graphics example. This is a nine stage process. The stages in this process are graph, growth, success, business, finance.
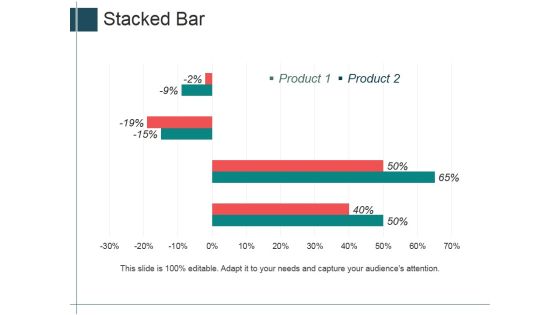
Stacked Bar Ppt PowerPoint Presentation Styles Designs Download
This is a stacked bar ppt powerpoint presentation styles designs download. This is a four stage process. The stages in this process are product, finance, percentage, business.

Bar Chart Ppt PowerPoint Presentation Infographic Template Example
This is a bar chart ppt powerpoint presentation infographic template example. This is a seven stage process. The stages in this process are business, finance, marketing, percentage.

Bar Graph Ppt PowerPoint Presentation Visual Aids Styles
This is a bar graph ppt powerpoint presentation visual aids styles. This is a five stage process. The stages in this process are finance, analysis, planning, business, process.

Bar Graph Ppt PowerPoint Presentation Styles File Formats
This is a bar graph ppt powerpoint presentation styles file formats. This is a four stage process. The stages in this process are percentage, business, marketing, finance, strategy.

Bar Graph Ppt PowerPoint Presentation Portfolio Example Topics
This is a bar graph ppt powerpoint presentation portfolio example topics. This is a four stage process. The stages in this process are business, marketing, management, success, planning.

Bar Diagram Ppt PowerPoint Presentation Ideas Infographic Template
This is a bar diagram ppt powerpoint presentation ideas infographic template. This is a four stage process. The stages in this process are business, finance, marketing, strategy, analysis.
Stacked Bar Ppt PowerPoint Presentation Icon Background Image
This is a stacked bar ppt powerpoint presentation icon background image. This is a four stage process. The stages in this process are product, percentage, finance, business, marketing.
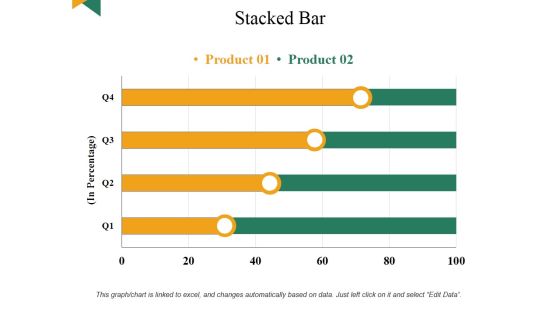
Stacked Bar Ppt PowerPoint Presentation Infographics Design Templates
This is a stacked bar ppt powerpoint presentation infographics design templates. This is a four stage process. The stages in this process are business, marketing, finance, analysis, planning.

Clustered Bar Ppt PowerPoint Presentation Model Visual Aids
This is a clustered bar ppt powerpoint presentation model visual aids. This is a three stage process. The stages in this process are business, marketing, strategy, graph, finance.

Clustered Bar Ppt PowerPoint Presentation Pictures Visual Aids
This is a clustered bar ppt powerpoint presentation pictures visual aids. This is a four stage process. The stages in this process are business, marketing, strategy, finance, planning.

Clustered Bar Ppt PowerPoint Presentation Infographics Example File
This is a clustered bar ppt powerpoint presentation infographics example file. This is a five stage process. The stages in this process are business, marketing, strategy, planning, finance.

Bar Chart Ppt PowerPoint Presentation Ideas Format Ideas
This is a bar chart ppt powerpoint presentation ideas format ideas. This is a four stage process. The stages in this process are finance, marketing, strategy, planning, management.

Bar Graph Finance Ppt PowerPoint Presentation Pictures Elements
This is a bar graph finance ppt powerpoint presentation pictures elements. This is a three stage process. The stages in this process are finance, marketing, management, investment, analysis.

Bar Chart Ppt PowerPoint Presentation Professional Clipart Images
This is a bar chart ppt powerpoint presentation professional clipart images. This is a three stage process. The stages in this process are business, finance, analysis, investment, marketing.

Bar Chart Financial Ppt PowerPoint Presentation Pictures Files
This is a bar chart financial ppt powerpoint presentation pictures files. This is a five stage process. The stages in this process are finance, marketing, management, investment, analysis.

Clustered Bar Ppt PowerPoint Presentation Summary Infographic Template
This is a clustered bar ppt powerpoint presentation summary infographic template. This is a three stage process. The stages in this process are finance, marketing, management, investment, analysis.

Clustered Bar Chart Ppt PowerPoint Presentation Layouts Infographics
This is a clustered bar chart ppt powerpoint presentation layouts infographics. This is a three stage process. The stages in this process are finance, marketing, management, investment, analysis.

Stacked Bar Product Ppt PowerPoint Presentation Infographics Layout
This is a stacked bar product ppt powerpoint presentation infographics layout. This is a three stage process. The stages in this process are business, management, marketing, sales, financial.

Clustered Bar Chart Ppt PowerPoint Presentation Professional Good
This is a clustered bar chart ppt powerpoint presentation professional good. This is a three stage process. The stages in this process are finance, marketing, management, investment, analysis.

Clustered Bar Chart Ppt PowerPoint Presentation Summary Templates
This is a clustered bar chart ppt powerpoint presentation summary templates. This is a three stage process. The stages in this process are finance, marketing, management, investment, analysis.

Clustered Bar Product Ppt PowerPoint Presentation Inspiration Templates
This is a clustered bar product ppt powerpoint presentation inspiration templates. This is a three stage process. The stages in this process are business, management, strategy, marketing, sales.

Bar Chart Slide Ppt PowerPoint Presentation Summary Example File
This is a bar chart slide ppt powerpoint presentation summary example file. This is a three stage process. The stages in this process are percentage, marketing, management, product.

Clustered Bar Finance Ppt PowerPoint Presentation Infographics Example
This is a clustered bar finance ppt powerpoint presentation infographics example. This is a three stage process. The stages in this process are finance, marketing, management, investment, analysis.
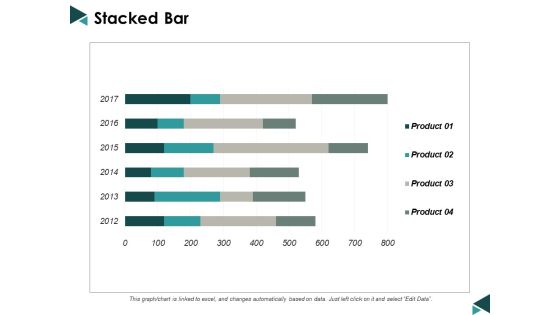
Stacked Bar Finance Ppt Powerpoint Presentation Infographics Example
This is a stacked bar finance ppt powerpoint presentation infographics example. This is a four stage process. The stages in this process are finance, marketing, management, investment, analysis.

stacked bar finance ppt powerpoint presentation file layouts
This is a stacked bar finance ppt powerpoint presentation file layouts. This is a three stage process. The stages in this process are finance, marketing, management, investment, analysis.

bar graph finance ppt powerpoint presentation portfolio summary
This is a bar graph finance ppt powerpoint presentation portfolio summary. This is a three stage process. The stages in this process are finance, marketing, management, investment, analysis.

Stacked Bar Chart Ppt PowerPoint Presentation Gallery Outfit
This is a stacked bar chart ppt powerpoint presentation gallery outfit. This is a three stage process. The stages in this process are finance, marketing, management, investment, analysis.

Stacked Bar Finance Ppt PowerPoint Presentation Ideas Good
This is a stacked bar finance ppt powerpoint presentation ideas good. This is a three stage process. The stages in this process are finance, analysis, business, investment, marketing.
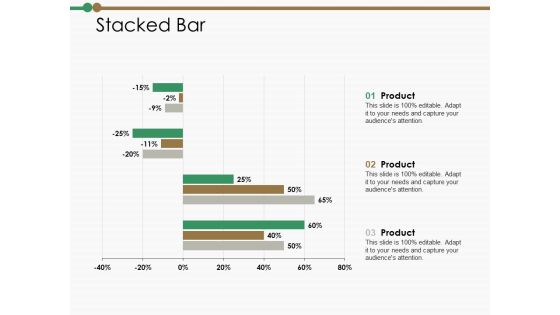
Stacked Bar Ppt PowerPoint Presentation Summary Clipart Images
This is a stacked bar ppt powerpoint presentation summary clipart images. This is a three stage process. The stages in this process are financial, percentage, product, management, marketing.

Clustered Bar Ppt PowerPoint Presentation Icon Background Image
This is a clustered bar ppt powerpoint presentation icon background image. This is a three stage process. The stages in this process are percentage, product, business, marketing.

Stacked Bar Investment Ppt PowerPoint Presentation File Picture
This is a stacked bar investment ppt powerpoint presentation file picture. This is a four stage process. The stages in this process are finance, analysis, business, investment, marketing.

Bar Graph Finance Ppt PowerPoint Presentation Summary Ideas
This is a bar graph finance ppt powerpoint presentation summary ideas. This is a three stage process. The stages in this process are finance, analysis, business, investment, marketing.

Clustered Bar Contribution Ppt PowerPoint Presentation Slides Example
This is a clustered bar contribution ppt powerpoint presentation slides example. This is a three stage process. The stages in this process are finance, business, management, strategy, analysis.

Bar Graph Product Ppt PowerPoint Presentation Layouts Ideas
This is a bar graph product ppt powerpoint presentation layouts ideas. This is a three stage process. The stages in this process are business, management, marketing, product, percentage.

Bar Chart Product Ppt PowerPoint Presentation Summary Diagrams
This is a bar chart product ppt powerpoint presentation summary diagrams. This is a three stage process. The stages in this process are business, management, marketing, percentage, product.

Bar Chart Product Ppt PowerPoint Presentation Portfolio Visuals
This is a bar chart product ppt powerpoint presentation portfolio visuals. This is a three stage process. The stages in this process are business, management, marketing, percentage, product.
Stacked Bar Finance Icon Ppt PowerPoint Presentation Portfolio Tips
This is a stacked bar finance icon ppt powerpoint presentation portfolio tips. This is a three stage process. The stages in this process are finance, strategy, analysis, marketing.

Clustered Bar Product Ppt PowerPoint Presentation Inspiration Elements
This is a clustered bar product ppt powerpoint presentation inspiration elements. This is a three stage process. The stages in this process are percentage, product, business, management, marketing.

Clustered Bar Finance Ppt PowerPoint Presentation Model Grid
This is a clustered bar finance ppt powerpoint presentation model grid. This is a three stage process. The stages in this process are finance, marketing, management, investment.

Clustered Bar Financial Ppt PowerPoint Presentation Model Format
This is a clustered bar financial ppt powerpoint presentation model format. This is a three stage process. The stages in this process are business, management, marketing, percentage, product.

Bar Graph Finance Ppt Powerpoint Presentation Layouts Mockup
This is a bar graph finance ppt powerpoint presentation layouts mockup. This is a three stage process. The stages in this process are finance, marketing, management, investment, analysis.

Cluster Bar Investment Ppt PowerPoint Presentation Portfolio Elements
This is a cluster bar investment ppt powerpoint presentation portfolio elements. This is a three stage process. The stages in this process are finance, analysis, business, investment, marketing.

Clustered Bar Investment Ppt PowerPoint Presentation File Templates
This is a clustered bar investment ppt powerpoint presentation file templates. This is a three stage process. The stages in this process are finance, analysis, business, investment, marketing.

Clustered Bar Planning Ppt PowerPoint Presentation Layouts Demonstration
This is a clustered bar planning ppt powerpoint presentation layouts demonstration. This is a three stage process. The stages in this process are finance, analysis, business, investment, marketing.

Bar Graph Finance Ppt Powerpoint Presentation File Ideas
This is a bar graph finance ppt powerpoint presentation file ideas. This is a four stage process. The stages in this process are finance, marketing, management, investment, analysis.

Clustered Bar Management Ppt Powerpoint Presentation Inspiration Templates
This is a clustered bar management ppt powerpoint presentation inspiration templates. This is a three stage process. The stages in this process are finance, marketing, management, investment, analysis.

Bar Graph Finance Ppt PowerPoint Presentation Styles Slide
This is a bar graph finance ppt powerpoint presentation styles slide. This is a three stage process. The stages in this process are finance, marketing, management, investment, analysis.

Stacked Bar Finance Ppt PowerPoint Presentation File Influencers
This is a stacked bar finance ppt powerpoint presentation file influencers. This is a three stage process. The stages in this process are finance, marketing, management, investment, analysis.

Clustered Bar Finance Ppt PowerPoint Presentation Portfolio Gridlines
This is a clustered bar finance ppt powerpoint presentation portfolio gridlines. This is a three stage process. The stages in this process are finance, marketing, analysis, investment, million.
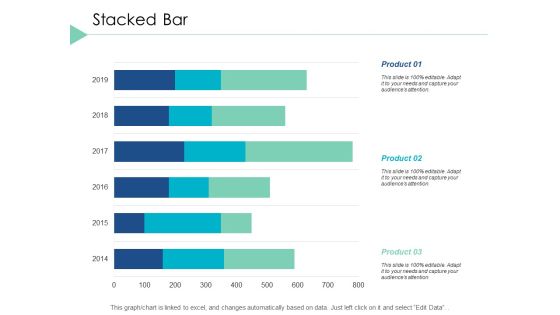
Stacked Bar Finance Ppt PowerPoint Presentation Infographics Guide
This is a stacked bar finance ppt powerpoint presentation infographics guide. This is a three stage process. The stages in this process are finance, marketing, analysis, investment, million.

Clustered Bar Graph Ppt PowerPoint Presentation Outline Layouts
This is a clustered bar graph ppt powerpoint presentation outline layouts. This is a three stage process. The stages in this process are finance, marketing, analysis, investment, million.
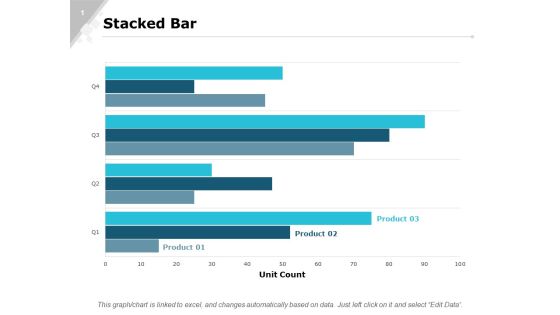
Stacked Bar Graph Ppt PowerPoint Presentation Inspiration Images
This is a stacked bar graph ppt powerpoint presentation inspiration images. This is a three stage process. The stages in this process are finance, marketing, analysis, investment, million.

Pie Chart Bar Ppt PowerPoint Presentation Layouts Examples
This is a pie chart bar ppt powerpoint presentation layouts examples. This is a three stage process. The stages in this process are finance, marketing, analysis, investment, million.
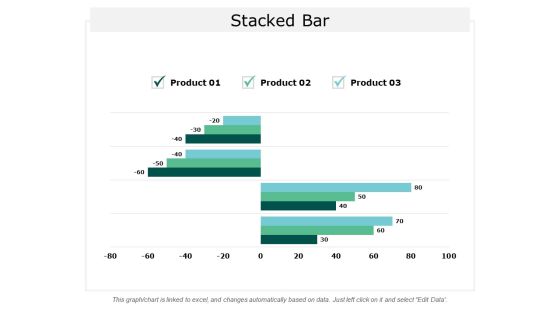
Stacked Bar Marketing Ppt Powerpoint Presentation Layouts Templates
This is a stacked bar marketing ppt powerpoint presentation layouts templates. This is a three stage process. The stages in this process are financial, marketing, analysis, investment, business.

Stacked Bar Finance Ppt PowerPoint Presentation Outline Vector
This is a stacked bar finance ppt powerpoint presentation outline vector. This is a three stage process. The stages in this process are finance, analysis, business, investment, marketing.

Clustered Bar Finance Marketing Ppt PowerPoint Presentation Ideas Graphics
This is a clustered bar finance marketing ppt powerpoint presentation ideas graphics. This is a three stage process. The stages in this process are business, management, marketing, finance.
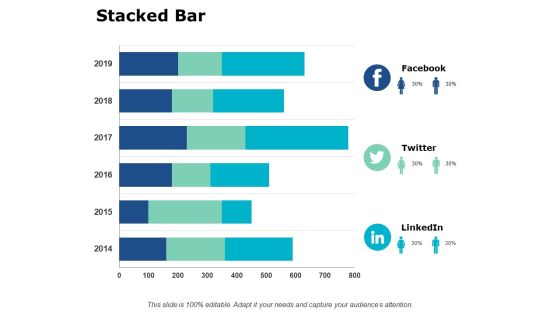
Stacked Bar Investment Ppt PowerPoint Presentation Gallery Infographics
This is a stacked bar investment ppt powerpoint presentation gallery infographics. This is a three stage process. The stages in this process are finance, analysis, business, investment, marketing.

Bar Chart Icon For Financial Ratios Comparison Elements PDF
Presenting bar chart icon for financial ratios comparison elements pdf to dispense important information. This template comprises four stages. It also presents valuable insights into the topics including bar chart icon for financial ratios comparison. This is a completely customizable PowerPoint theme that can be put to use immediately. So, download it and address the topic impactfully.

Colorful Bars With Icons For Business Agenda Powerpoint Template
Develop competitive advantage with our above template which contains infographic of colorful bars. This diagram provides an effective way of displaying business agenda. You can edit text, color, shade and style as per you need.
Profit Growth Bars With Icons And Mouse Powerpoint Template
Our above slide contains graphics of profit growth bars with icons. This PowerPoint template helps to display outline of business plan. Use this diagram to impart more clarity to data and to create more sound impact on viewers.

Bar Graph With Yearly Statistical Analysis Powerpoint Slides
This PowerPoint template contains diagram of bar graph with yearly percentage ratios. You may download this slide to display statistical analysis. You can easily customize this template to make it more unique as per your need.

Bar Graph Infographics With Success Arrow Powerpoint Slides
This PowerPoint template has been designed with bar graph with success arrow. You may use this PPT slide to display goal achievement and planning. Impress your audiences by using this PPT slide.
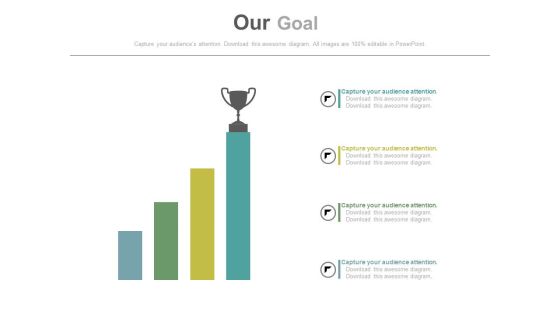
Growth Bar Graph With Trophy On Top Powerpoint Slides
This PowerPoint template has been designed with growth bar graph and trophy onto of it. Download this PPT slide to define and achieve goals with more success. This diagram may be used for goal planning related topics.

Bar Chart Ppt PowerPoint Presentation Pictures Background Image
This is a bar chart ppt powerpoint presentation pictures background image. This is a seven stage process. The stages in this process are financial years, sales in percentage, graph, business.

Bar Chart Ppt PowerPoint Presentation Professional Graphics Download
This is a bar chart ppt powerpoint presentation professional graphics download. This is a seven stage process. The stages in this process are sales in percentage, financial years, chart, business.

Clustered Bar Ppt PowerPoint Presentation Show Slide Portrait
This is a clustered bar ppt powerpoint presentation show slide portrait. This is a four stage process. The stages in this process are product, unit count, graph, business, marketing.

Stacked Bar Template Ppt PowerPoint Presentation Summary Visual Aids
This is a stacked bar template ppt powerpoint presentation summary visual aids. This is a three stage process. The stages in this process are unit count, business, marketing, finance, graph.

Stacked Bar Ppt PowerPoint Presentation Styles Slide Portrait
This is a stacked bar ppt powerpoint presentation styles slide portrait. This is a three stage process. The stages in this process are unit count, business, marketing, strategy, graph, finance.

Clustered Bar Ppt PowerPoint Presentation Outline Slide Download
This is a clustered bar ppt powerpoint presentation outline slide download. This is a three stage process. The stages in this process are unit count, finance, marketing, business, graph.

Clustered Bar Ppt PowerPoint Presentation Portfolio Graphic Images
This is a clustered bar ppt powerpoint presentation portfolio graphic images. This is a three stage process. The stages in this process are business, unit count, finance, marketing, graph.

Clustered Bar Ppt PowerPoint Presentation Pictures Clipart Images
This is a clustered bar ppt powerpoint presentation pictures clipart images. This is a three stage process. The stages in this process are business, marketing, graph, finance, strategy, unit count.

Bar Chart Finance Ppt PowerPoint Presentation Infographics Background Images
This is a bar chart finance ppt powerpoint presentation infographics background images. This is a seven stages process. The stages in this process are alpha testing, beta testing, full scale show.

Clustered Bar Finance Ppt PowerPoint Presentation Summary Example Topics
This is a clustered bar finance ppt powerpoint presentation summary example topics. This is a three stage process. The stages in this process are finance, marketing, management, investment, analysis.

Bar Graph Financial Sales Product Ppt PowerPoint Presentation Icon Vector
This is a bar graph financial sales product ppt powerpoint presentation icon vector. This is a five stage process. The stages in this process are business, management, financial, marketing, sales.

Clustered Bar Finance Ppt PowerPoint Presentation Gallery Background Images
This is a clustered bar finance ppt powerpoint presentation gallery background images. This is a four stage process. The stages in this process are finance, marketing, analysis, business, investment.

Bar Chart Ppt PowerPoint Presentation Infographic Template Graphics Design
This is a bar chart ppt powerpoint presentation infographic template graphics design. This is a five stage process. The stages in this process are management, marketing, business, percentage, product.

Bar Graph Finance Ppt PowerPoint Presentation Infographics Designs Download
This is a bar graph finance ppt powerpoint presentation infographics designs download. This is a three stage process. The stages in this process are finance, marketing, management, investment, analysis.

Clustered Bar Finance Ppt PowerPoint Presentation Icon Infographic Template
This is a clustered bar finance ppt powerpoint presentation icon infographic template. This is a three stage process. The stages in this process are finance, analysis, business, investment, marketing.
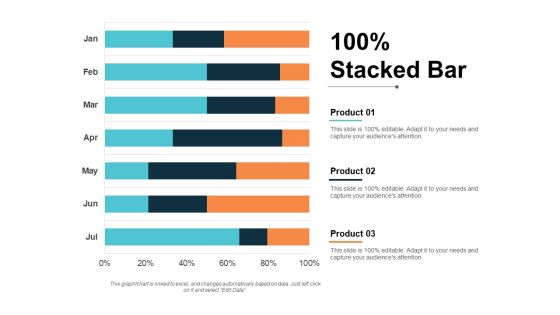
stacked bar finance ppt powerpoint presentation show graphics pictures
This is a stacked bar finance ppt powerpoint presentation show graphics pictures. This is a three stage process. The stages in this process are finance, marketing, management, investment, analysis.

100 Percent Stacked Bar Ppt PowerPoint Presentation Layouts Graphics Template
This is a 100 percent stacked bar ppt powerpoint presentation layouts graphics template. This is a three stage process. The stages in this process are finance, marketing, management, investment, analysis.

Clustered Bar Finance Marketing Ppt PowerPoint Presentation Outline Professional
This is a clustered bar finance marketing ppt powerpoint presentation outline professional. This is a three stage process. The stages in this process are finance, analysis, business, investment, marketing.

Clustered Bar Finance Ppt PowerPoint Presentation Gallery Graphics Design
This is a clustered bar finance ppt powerpoint presentation gallery graphics design. This is a four stage process. The stages in this process are finance, analysis, business, investment, marketing.

Clustered Bar Financial Chart Ppt PowerPoint Presentation File Design Ideas
This is a clustered bar financial chart ppt powerpoint presentation file design ideas. This is a three stage process. The stages in this process are column chart, financial, business, marketing, planning, strategy.

Bar Graph Employee Value Proposition Ppt PowerPoint Presentation File Layout
This is a bar graph employee value proposition ppt powerpoint presentation file layout. This is a three stage process. The stages in this process are business, management, strategy, analysis, marketing.

Clustered Bar Risk Estimator Ppt PowerPoint Presentation Layouts Mockup
This is a clustered bar risk estimator ppt powerpoint presentation layouts mockup. This is a four stage process. The stages in this process are business, management, strategy, analysis, marketing.

Stacked Bar Risk Estimator Ppt PowerPoint Presentation Gallery Design Templates
This is a stacked bar risk estimator ppt powerpoint presentation gallery design templates. This is a four stage process. The stages in this process are business, management, strategy, analysis, marketing.

Project Status Bar Chart Ppt PowerPoint Presentation Ideas Objects
This is a project status bar chart ppt powerpoint presentation ideas objects. This is a four stage process. The stages in this process are project management, project progress, project growth.

Clustered Bar Finance Marketing Ppt PowerPoint Presentation Model Deck
This is a clustered bar finance marketing ppt powerpoint presentation model deck. This is a three stage process. The stages in this process are finance, marketing, analysis, business, investment.

Clustered Bar Chart Marketing Ppt PowerPoint Presentation Layouts Icon
This is a clustered bar chart marketing ppt powerpoint presentation layouts icon. This is a four stage process. The stages in this process are finance, marketing, analysis, business, investment.

Bar Chart Finance Marketing Ppt PowerPoint Presentation Icon Display
This is a bar chart finance marketing ppt powerpoint presentation icon display. This is a three stage process. The stages in this process are finance, analysis, business, investment, marketing.

Clustered Bar Marketing Planning Ppt PowerPoint Presentation Layouts Example
This is a clustered bar marketing planning ppt powerpoint presentation layouts example. This is a three stage process. The stages in this process are finance, analysis, business, investment, marketing.

Clustered Bar Finance Ppt Powerpoint Presentation Visual Aids Example File
This is a clustered bar finance ppt powerpoint presentation visual aids example file. This is a four stage process. The stages in this process are finance, marketing, management, investment, analysis.

Clustered Bar Financial Ppt PowerPoint Presentation Gallery Designs Download
This is a clustered bar financial ppt powerpoint presentation gallery designs download. This is a three stage process. The stages in this process are percentage, product, business, management, marketing.

Stacked Bar Finance Marketing Ppt Powerpoint Presentation Summary Graphics
This is a stacked bar finance marketing ppt powerpoint presentation summary graphics. This is a three stage process. The stages in this process are finance, marketing, management, investment, analysis.

Clustered Bar Business Product Ppt PowerPoint Presentation Gallery Background
This is a clustered bar business product ppt powerpoint presentation gallery background. This is a three stage process. The stages in this process are business, management, marketing, percentage, product.

Bar Plot For Data Visualization Ppt Powerpoint Presentation Pictures Guide
This is a bar plot for data visualization ppt powerpoint presentation pictures guide. This is a four stage process. The stages in this process are scatter plot, probability plots, plot diagram.

Bar Graph Percentage Product Ppt PowerPoint Presentation Layouts Microsoft
This is a bar graph percentage product ppt powerpoint presentation layouts microsoft. This is a three stage process. The stages in this process are business, management, marketing, percentage, product.

Clustered Bar Finance Marketing Ppt Powerpoint Presentation Summary Graphic Tips
This is a clustered bar finance marketing ppt powerpoint presentation summary graphic tips. This is a three stage process. The stages in this process are finance, marketing, management, investment, analysis.

Bar Chart Finance Marketing Ppt Powerpoint Presentation Gallery Grid
This is a bar chart finance marketing ppt powerpoint presentation gallery grid. This is a three stage process. The stages in this process are finance, marketing, management, investment, analysis.

Bar Graph Marketing Process Ppt PowerPoint Presentation Ideas Example Introduction
This is a bar graph marketing process ppt powerpoint presentation ideas example introduction. This is a three stage process. The stages in this process are finance, management, strategy, analysis, marketing.

100 Percent Stacked Bar Finance Ppt PowerPoint Presentation Model Templates
This is a 100 percent stacked bar finance ppt powerpoint presentation model templates. This is a three stage process. The stages in this process are finance, analysis, business, investment, marketing.

Clustered Bar Investment Planning Ppt PowerPoint Presentation Infographic Template Deck
This is a clustered bar investment planning ppt powerpoint presentation infographic template deck. This is a three stage process. The stages in this process are finance, analysis, business, investment, marketing.

Bar Graph Percentage Product Ppt PowerPoint Presentation Styles Good
This is a bar graph percentage product ppt powerpoint presentation styles good. This is a three stage process. The stages in this process are area chart, finance, marketing, management, investment.

Bar Chart Business Management Ppt PowerPoint Presentation Ideas Example Introduction
This is a bar chart business management ppt powerpoint presentation ideas example introduction. This is a three stage process. The stages in this process are finance, marketing, management, investment, analysis.

Stacked Bar Graph Ppt PowerPoint Presentation Portfolio Slide Portrait
This is a stacked bar graph ppt powerpoint presentation portfolio slide portrait. This is a three stage process. The stages in this process are finance, marketing, management, investment, analysis.

Clustered Bar Graph Ppt PowerPoint Presentation Model Background Designs
This is a clustered bar graph ppt powerpoint presentation model background designs. This is a three stage process. The stages in this process are finance, marketing, management, investment, analysis.

Bar Graph Finance Ppt PowerPoint Presentation Outline Background Designs
This is a bar graph finance ppt powerpoint presentation outline background designs. This is a three stage process. The stages in this process are financial, maximum, medium, minimum, marketing.
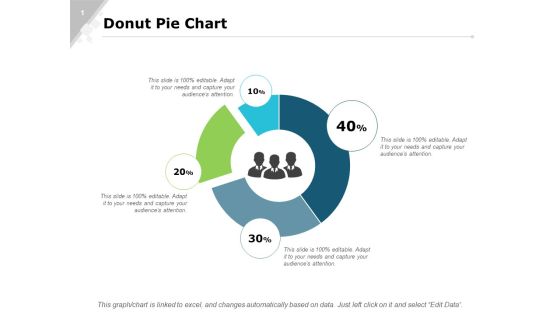
Donut Pie Chart Bar Ppt PowerPoint Presentation Infographics Slide Portrait
This is a donut pie chart bar ppt powerpoint presentation infographics slide portrait. This is a four stage process. The stages in this process are finance, marketing, analysis, investment, million.

Clustered Bar Chart Finance Ppt Powerpoint Presentation Icon Graphics Template
This is a clustered bar chart finance ppt powerpoint presentation icon graphics template. This is a four stage process. The stages in this process are finance, marketing, management, investment, analysis.

Clustered Bar Finance Ppt Powerpoint Presentation Portfolio Slide Portrait
This is a clustered bar finance ppt powerpoint presentation portfolio slide portrait. This is a three stage process. The stages in this process are finance, marketing, management, investment, analysis.

Bar Chart Finance Marketing Ppt PowerPoint Presentation File Good
This is a bar chart finance marketing ppt powerpoint presentation file good. This is a three stage process. The stages in this process are finance, marketing, management, investment, analysis.

Bar Chart Management Investment Ppt PowerPoint Presentation File Rules
This is a bar chart management investment ppt powerpoint presentation file rules. This is a three stage process. The stages in this process are finance, marketing, management, investment, analysis.
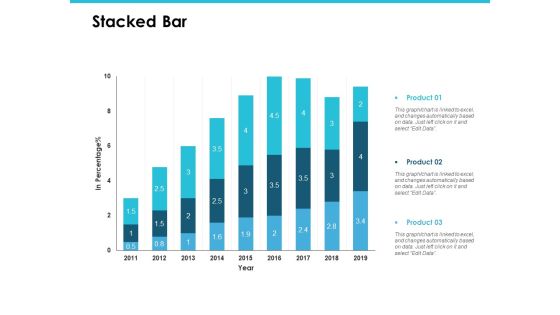
Stacked Bar Finance Marketing Ppt PowerPoint Presentation Portfolio Graphics Pictures
This is a stacked bar finance marketing ppt powerpoint presentation portfolio graphics pictures. This is a three stage process. The stages in this process are finance, marketing, management, investment, analysis.

Clustered Bar Finance Marketing Ppt PowerPoint Presentation File Format Ideas
Presenting this set of slides with name clustered bar finance marketing ppt powerpoint presentation file format ideas. This is a one stage process. The stages in this process are finance, marketing, management, investment, analysis. This is a completely editable PowerPoint presentation and is available for immediate download. Download now and impress your audience.

Combo Chart Bar Ppt PowerPoint Presentation Slides Portfolio
This is a company growth strategy ppt powerpoint presentation professional slides. This is a three stage process. The stages in this process are finance, marketing, analysis, investment, million.

Financial Crisis Dollar And Puzzle Pieces Ppt PowerPoint Presentation Diagram Templates
This is a financial crisis dollar and puzzle pieces ppt powerpoint presentation diagram templates. This is a one stage process. The stages in this process are mutual funds, funds to buy, investment slide.

Blocked Bank Card Vector Icon Ppt PowerPoint Presentation Slides Example File PDF
Presenting this set of slides with name blocked bank card vector icon ppt powerpoint presentation slides example file pdf. This is a three stage process. The stages in this process are blocked bank card vector icon. This is a completely editable PowerPoint presentation and is available for immediate download. Download now and impress your audience.

Benefit Of Block Chain Technology For Securing Confidential Data Icon Topics PDF
Presenting Benefit Of Block Chain Technology For Securing Confidential Data Icon Topics PDF to dispense important information. This template comprises four stages. It also presents valuable insights into the topics including Benefit Of Block Chain, Technology For Securing, Confidential Data Icon This is a completely customizable PowerPoint theme that can be put to use immediately. So, download it and address the topic impactfully.
Research Tactics With Chess Pieces Vector Icon Ppt PowerPoint Presentation Summary Clipart Images PDF
Persuade your audience using this research tactics with chess pieces vector icon ppt powerpoint presentation summary clipart images pdf. This PPT design covers three stages, thus making it a great tool to use. It also caters to a variety of topics including research tactics with chess pieces vector icon. Download this PPT design now to present a convincing pitch that not only emphasizes the topic but also showcases your presentation skills.

Thank You Six Building Blocks Of Digital Change Ppt PowerPoint Presentation Infographic Template Good
This is a thank you six building blocks of digital change ppt powerpoint presentation infographic template good. This is a one stage process. The stages in this process are thank you.

Thank You Six Building Blocks Of Digital Transformation Ppt PowerPoint Presentation Slides Infographics
This is a thank you six building blocks of digital transformation ppt powerpoint presentation slides infographics. This is a one stage process. The stages in this process are thank you.

Building Blocks For Successful Marketing Plan Ppt PowerPoint Presentation Gallery Example Topics PDF
Persuade your audience using this building blocks for successful marketing plan ppt powerpoint presentation gallery example topics pdf. This PPT design covers six stages, thus making it a great tool to use. It also caters to a variety of topics including goals, sales, process. Download this PPT design now to present a convincing pitch that not only emphasizes the topic but also showcases your presentation skills.

Organizational Building Blocks Company Introduction Ppt PowerPoint Presentation Visual Aids Example File PDF
this is a organizational building blocks company introduction ppt powerpoint presentation visual aids example file Pdf template with various stages. focus and dispense information on three stages using this creative set, that comes with editable features. it contains large content boxes to add your information on topics like values client, target audience, creative. you can also showcase facts, figures, and other relevant content using this ppt layout. grab it now.

Bar Graph For Sales Revenue Over The Years Ppt PowerPoint Presentation Professional
This is a bar graph for sales revenue over the years ppt powerpoint presentation professional. This is a nine stage process. The stages in this process are business, marketing, growth, bar, years.

Bar Graph Companys Business Model Canvas Ppt PowerPoint Presentation Visual Aids Model
This is a bar graph companys business model canvas ppt powerpoint presentation visual aids model. This is a three stage process. The stages in this process are bar graph, finance, marketing, strategy, analysis, business.
Eight Percentage Bars With Business Icons Ppt PowerPoint Presentation Icon Graphic Tips
Presenting this set of slides with name eight percentage bars with business icons ppt powerpoint presentation icon graphic tips. This is a eight stage process. The stages in this process are eight percentage bars with business icons. This is a completely editable PowerPoint presentation and is available for immediate download. Download now and impress your audience.
Five Percentage Bars With Business Icons Ppt PowerPoint Presentation Styles Objects
Presenting this set of slides with name five percentage bars with business icons ppt powerpoint presentation styles objects. This is a five stage process. The stages in this process are five percentage bars with business icons. This is a completely editable PowerPoint presentation and is available for immediate download. Download now and impress your audience.
Four Percentage Bars With Business Icons Ppt PowerPoint Presentation Ideas Rules
Presenting this set of slides with name four percentage bars with business icons ppt powerpoint presentation ideas rules. This is a four stage process. The stages in this process are four percentage bars with business icons. This is a completely editable PowerPoint presentation and is available for immediate download. Download now and impress your audience.
Seven Percentage Bars With Business Icons Ppt PowerPoint Presentation Infographics Example Topics
Presenting this set of slides with name seven percentage bars with business icons ppt powerpoint presentation infographics example topics. This is a seven stage process. The stages in this process are seven percentage bars with business icons. This is a completely editable PowerPoint presentation and is available for immediate download. Download now and impress your audience.
Six Percentage Bars With Business Icons Ppt PowerPoint Presentation File Example
Presenting this set of slides with name six percentage bars with business icons ppt powerpoint presentation file example. This is a six stage process. The stages in this process are six percentage bars with business icons. This is a completely editable PowerPoint presentation and is available for immediate download. Download now and impress your audience.

Bar Graph Showing Negative Trend Ppt PowerPoint Presentation Summary Master Slide
Presenting this set of slides with name bar graph showing negative trend ppt powerpoint presentation summary master slide. This is a one stage process. The stages in this process are bar graph showing negative trend. This is a completely editable PowerPoint presentation and is available for immediate download. Download now and impress your audience.

Bar Graph Analytics Vector Icon Ppt PowerPoint Presentation Slides Information PDF
Presenting this set of slides with name bar graph analytics vector icon ppt powerpoint presentation slides information pdf. This is a three stage process. The stages in this process are bar graph analytics vector icon. This is a completely editable PowerPoint presentation and is available for immediate download. Download now and impress your audience.

Bar Graph Analyzing Company Performance Vector Icon Ppt PowerPoint Presentation Ideas Slides PDF
Presenting this set of slides with name bar graph analyzing company performance vector icon ppt powerpoint presentation ideas slides pdf. This is a three stage process. The stages in this process are bar graph analyzing company performance vector icon. This is a completely editable PowerPoint presentation and is available for immediate download. Download now and impress your audience.

Bar Graph Showing Business Performance With Downward Arrow Ppt PowerPoint Presentation Show Format Ideas PDF
Presenting this set of slides with name bar graph showing business performance with downward arrow ppt powerpoint presentation show format ideas pdf. This is a three stage process. The stages in this process are bar graph showing business performance with downward arrow. This is a completely editable PowerPoint presentation and is available for immediate download. Download now and impress your audience.

Bar Graph Showing Business Loss Vector Icon Ppt PowerPoint Presentation Gallery Example Topics PDF
Presenting this set of slides with name bar graph showing business loss vector icon ppt powerpoint presentation gallery example topics pdf. This is a three stage process. The stages in this process are bar graph showing business loss vector icon. This is a completely editable PowerPoint presentation and is available for immediate download. Download now and impress your audience.
Identifying Risk In Business Bar Graph Vector Icon Ppt PowerPoint Presentation Icon Show PDF
Presenting this set of slides with name identifying risk in business bar graph vector icon ppt powerpoint presentation icon show pdf. This is a three stage process. The stages in this process are identifying risk in business bar graph vector icon. This is a completely editable PowerPoint presentation and is available for immediate download. Download now and impress your audience.

Bar Chart For Yearly Business Progress Ppt PowerPoint Presentation Outline Backgrounds PDF
Presenting this set of slides with name bar chart for yearly business progress ppt powerpoint presentation outline backgrounds pdf. This is a four stage process. The stages in this process are bar chart for yearly business progress. This is a completely editable PowerPoint presentation and is available for immediate download. Download now and impress your audience.

Bar Graph Showing Growth In Money Flow Ppt PowerPoint Presentation File Show PDF
Presenting this set of slides with name bar graph showing growth in money flow ppt powerpoint presentation file show pdf. This is a three stage process. The stages in this process are bar graph showing growth in money flow. This is a completely editable PowerPoint presentation and is available for immediate download. Download now and impress your audience.
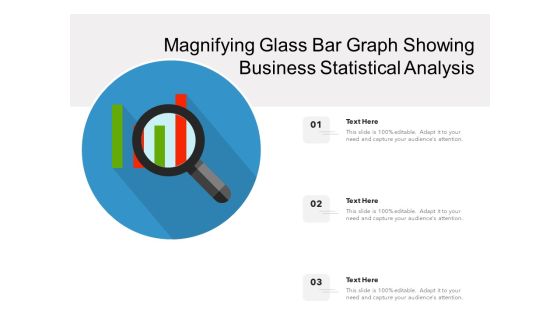
Magnifying Glass Bar Graph Showing Business Statistical Analysis Ppt PowerPoint Presentation File Sample PDF
Presenting this set of slides with name magnifying glass bar graph showing business statistical analysis ppt powerpoint presentation file sample pdf. This is a three stage process. The stages in this process are magnifying glass bar graph showing business statistical analysis. This is a completely editable PowerPoint presentation and is available for immediate download. Download now and impress your audience.

Business Growth Bar Graph Vector Icon Ppt PowerPoint Presentation Icon Inspiration PDF
Presenting this set of slides with name business growth bar graph vector icon ppt powerpoint presentation icon inspiration pdf. This is a three stage process. The stages in this process are business growth bar graph vector icon. This is a completely editable PowerPoint presentation and is available for immediate download. Download now and impress your audience.

Data Analysis Bar Chart With Magnifying Glass Icon Ppt PowerPoint Presentation Icon Layouts PDF
Presenting this set of slides with name data analysis bar chart with magnifying glass icon ppt powerpoint presentation icon layouts pdf. This is a three stage process. The stages in this process are data analysis bar chart with magnifying glass icon. This is a completely editable PowerPoint presentation and is available for immediate download. Download now and impress your audience.

Data Analysis With Bar Chart In Magnifying Glass Vector Icon Ppt PowerPoint Presentation File Model PDF
Presenting this set of slides with name data analysis with bar chart in magnifying glass vector icon ppt powerpoint presentation file model pdf. This is a one stage process. The stages in this process is data analysis with bar chart in magnifying glass vector icon. This is a completely editable PowerPoint presentation and is available for immediate download. Download now and impress your audience.

Bar Graph For Gap Assessment Vector Icon Ppt PowerPoint Presentation Professional Background PDF
Presenting bar graph for gap assessment vector icon ppt powerpoint presentation professional background pdf to dispense important information. This template comprises three stages. It also presents valuable insights into the topics including bar graph for gap assessment vector icon. This is a completely customizable PowerPoint theme that can be put to use immediately. So, download it and address the topic impactfully.
Dollar Note With Growing Payback Bar Vector Icon Ppt PowerPoint Presentation File Example PDF
Presenting dollar note with growing payback bar vector icon ppt powerpoint presentation file example pdf to dispense important information. This template comprises three stages. It also presents valuable insights into the topics including dollar note with growing payback bar vector icon. This is a completely customizable PowerPoint theme that can be put to use immediately. So, download it and address the topic impactfully.

Bar Graph And Magnifying Glass Assessment Icon Ppt PowerPoint Presentation Portfolio Graphics Pictures PDF
Presenting bar graph and magnifying glass assessment icon ppt powerpoint presentation portfolio graphics pictures pdf to dispense important information. This template comprises four stages. It also presents valuable insights into the topics including bar graph and magnifying glass assessment icon. This is a completely customizable PowerPoint theme that can be put to use immediately. So, download it and address the topic impactfully.
Statistical Data Icon Of Data Analytics Using Bar Graph Background PDF
Presenting statistical data icon of data analytics using bar graph background pdf to dispense important information. This template comprises four stages. It also presents valuable insights into the topics including statistical data icon of data analytics using bar graph. This is a completely customizable PowerPoint theme that can be put to use immediately. So, download it and address the topic impactfully.
Due Diligence Procedure Icon With Bars And Magnifying Glass Summary PDF
Presenting Due Diligence Procedure Icon With Bars And Magnifying Glass Summary PDF to dispense important information. This template comprises four stages. It also presents valuable insights into the topics including Due Diligence Procedure Icon With Bars And Magnifying Glass. This is a completely customizable PowerPoint theme that can be put to use immediately. So, download it and address the topic impactfully.

Red Board With Arrow Bar For Target Market Ppt PowerPoint Presentation Clipart
This is a red board with arrow bar for target market ppt powerpoint presentation clipart. This is a three stage process. The stages in this process are our goals, arrows, marketing, strategy, business, success.

Magnifier With Tools And Bar Graph Ppt PowerPoint Presentation Portfolio Templates
This is a magnifier with tools and bar graph ppt powerpoint presentation portfolio templates. This is a four stage process. The stages in this process are magnifier, search, marketing, strategy, business.

100 Percent Stacked Bar Strategy Approaches Ppt PowerPoint Presentation Gallery Visual Aids
This is a 100 percent stacked bar strategy approaches ppt powerpoint presentation gallery visual aids. This is a three stage process. The stages in this process are business, management, strategy, analysis, marketing.

Clustered Bar Chart Yearly Operating Plan Ppt PowerPoint Presentation Styles Icon
This is a clustered bar chart yearly operating plan ppt powerpoint presentation styles icon. This is a four stage process. The stages in this process are business, management, strategy, analysis, marketing.

Staked Bar Planning Business Ppt PowerPoint Presentation Infographic Template Infographic Template
This is a staked bar planning business ppt powerpoint presentation infographic template infographic template. This is a three stage process. The stages in this process are finance, marketing, analysis, business, investment.
Bar Graph Icon Showing Operating Rhythm Ppt Powerpoint Presentation Ideas Templates
This is a bar graph icon showing operating rhythm ppt powerpoint presentation ideas templates. This is a three stage process. The stages in this process are six sigma, operating rhythm, business rhythm.

Bar Chart With Magnifying Glass For Financial Analysis Ppt Powerpoint Presentation Infographics Designs Download
This is a bar chart with magnifying glass for financial analysis ppt powerpoint presentation infographics designs download. This is a three stage process. The stages in this process are business metrics, business kpi, business dashboard.

Clustered Bar Chart Percentage Product Ppt PowerPoint Presentation Portfolio Example Introduction
This is a clustered bar chart percentage product ppt powerpoint presentation portfolio example introduction. This is a three stage process. The stages in this process are area chart, finance, marketing, management, investment.
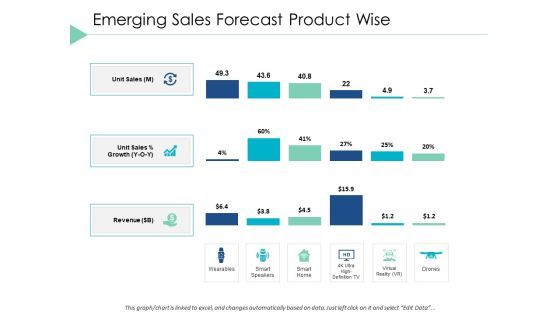
Emerging Sales Forecast Product Wise Bar Ppt PowerPoint Presentation Portfolio Slide Portrait
This is a emerging sales forecast product wise bar ppt powerpoint presentation portfolio slide portrait. This is a four stage process. The stages in this process are finance, marketing, analysis, investment, million.

Business Trends Bar Chart Vector Icon Ppt PowerPoint Presentation Inspiration Graphic Images PDF
Persuade your audience using this business trends bar chart vector icon ppt powerpoint presentation inspiration graphic images pdf. This PPT design covers three stages, thus making it a great tool to use. It also caters to a variety of topics including business trends bar chart vector icon. Download this PPT design now to present a convincing pitch that not only emphasizes the topic but also showcases your presentation skills.

Business Financial Growth Bar Graph With Dollar Symbol Icon Ppt PowerPoint Presentation File Ideas PDF
Persuade your audience using this business financial growth bar graph with dollar symbol icon ppt powerpoint presentation file ideas pdf. This PPT design covers one stages, thus making it a great tool to use. It also caters to a variety of topics including business financial growth bar graph with dollar symbol icon. Download this PPT design now to present a convincing pitch that not only emphasizes the topic but also showcases your presentation skills.
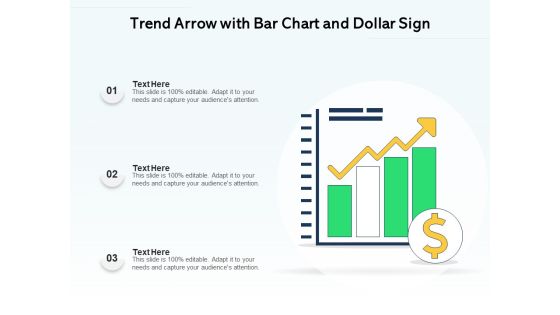
Trend Arrow With Bar Chart And Dollar Sign Ppt PowerPoint Presentation Influencers PDF
Persuade your audience using this trend arrow with bar chart and dollar sign ppt powerpoint presentation influencers pdf. This PPT design covers three stages, thus making it a great tool to use. It also caters to a variety of topics including trend arrow with bar chart and dollar sign. Download this PPT design now to present a convincing pitch that not only emphasizes the topic but also showcases your presentation skills.

Bar Chart With Magnifying Glass For Product Performance Analysis Ppt PowerPoint Presentation Gallery Example File PDF
Presenting bar chart with magnifying glass for product performance analysis ppt powerpoint presentation gallery example file pdf to dispense important information. This template comprises three stages. It also presents valuable insights into the topics including bar chart with magnifying glass for product performance analysis. This is a completely customizable PowerPoint theme that can be put to use immediately. So, download it and address the topic impactfully.

Bar Graph With Arrows For Data Representation Vector Icon Ppt PowerPoint Presentation Summary Picture PDF
Presenting bar graph with arrows for data representation vector icon ppt powerpoint presentation summary picture pdf to dispense important information. This template comprises three stages. It also presents valuable insights into the topics including bar graph with arrows for data representation vector icon. This is a completely customizable PowerPoint theme that can be put to use immediately. So, download it and address the topic impactfully.

Vector Showing Statistics Comparison Bar Chart Ppt Visual Aids Styles PDF
Persuade your audience using this Vector Showing Statistics Comparison Bar Chart Ppt Visual Aids Styles PDF. This PPT design covers three stages, thus making it a great tool to use. It also caters to a variety of topics including vector showing statistics comparison bar chart. Download this PPT design now to present a convincing pitch that not only emphasizes the topic but also showcases your presentation skills.
Performance Monitoring Vector Icon Bar Graph In Magnifying Glass Ppt PowerPoint Presentation Summary Gallery
Presenting this set of slides with name performance monitoring vector icon bar graph in magnifying glass ppt powerpoint presentation summary gallery. This is a one stage process. The stages in this process are growth, improvement, enhancement. This is a completely editable PowerPoint presentation and is available for immediate download. Download now and impress your audience.
 Home
Home