2 Phases

Line Chart Ppt PowerPoint Presentation Inspiration Graphics Tutorials
This is a line chart ppt powerpoint presentation inspiration graphics tutorials. This is a two stage process. The stages in this process are line chart, growth, strategy, analysis, business.

Column Chart Finance Ppt PowerPoint Presentation Slides Information
This is a column chart finance ppt powerpoint presentation slides information. This is a two stage process. The stages in this process are column chart finance, investment, business, planning, marketing.

Quality Control Plan Streamline Variation Management By Connecting Quality Diagrams PDF
Mentioned slide shows streamline variation management flowchart of an organization by connecting quality and regulatory. Organization may edit the slide or modify it as per its requirement. Retrieve professionally designed Quality Control Plan Streamline Variation Management By Connecting Quality Diagrams PDF to effectively convey your message and captivate your listeners. Save time by selecting pre-made slideshows that are appropriate for various topics, from business to educational purposes. These themes come in many different styles, from creative to corporate, and all of them are easily adjustable and can be edited quickly. Access them as PowerPoint templates or as Google Slides themes. You dont have to go on a hunt for the perfect presentation because Slidegeeks got you covered from everywhere.
Product And Brand Positioning Map Brand Techniques Structure Icons PDF
Mentioned slide shows positioning map of new brand as well as products coming under it. Here the product are positioned based on cost and quality. Presenting product and brand positioning map brand techniques structure icons pdf to provide visual cues and insights. Share and navigate important information on two stages that need your due attention. This template can be used to pitch topics like cost, product, price. In addtion, this PPT design contains high resolution images, graphics, etc, that are easily editable and available for immediate download.

9 Key Elements For Project Close Process Icons PDF
This template displays key components of the project closure procedure. It includes elements such as assessing project as per IPS, conducting closure review, finalsing open contracts, documenting lessons learned, etc. Persuade your audience using this 9 Key Elements For Project Close Process Icons PDF. This PPT design covers two stages, thus making it a great tool to use. It also caters to a variety of topics including Finalize, Plans, Resources. Download this PPT design now to present a convincing pitch that not only emphasizes the topic but also showcases your presentation skills.
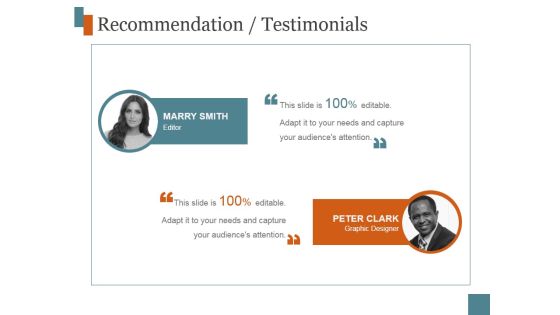
Recommendation Testimonials Ppt PowerPoint Presentation Themes
This is a recommendation testimonials ppt powerpoint presentation themes. This is a two stage process. The stages in this process are marry smith editor, peter clark graphic designer.

Meet Our Team Ppt PowerPoint Presentation Themes
This is a meet our team ppt powerpoint presentation themes. This is a two stage process. The stages in this process are team, communication, business.

Timeline Continue Ppt PowerPoint Presentation Themes
This is a timeline continue ppt powerpoint presentation themes. This is a two stage process. The stages in this process are timeline, management, strategy, planning, business.

Our Team Ppt PowerPoint Presentation Pictures Themes
This is a our team ppt powerpoint presentation pictures themes. This is a two stage process. The stages in this process are team, management, business, planning, communication.

Strengths Marketing Ppt PowerPoint Presentation Model Themes
This is a strengths marketing ppt powerpoint presentation model themes. This is a two stage process. The stages in this process are strengths, business, planning, strategy, marketing.
Stacked Column Ppt PowerPoint Presentation Icon Slides
This is a stacked column ppt powerpoint presentation icon slides. This is a two stage process. The stages in this process are profit, business, marketing, graph, growth.

Core Business Divisions With Enterprise Workforce Ppt Styles Examples PDF
This slide shows core corporate departments with extended team. It provides information about new growth innovation, marketing, finance, quality assurance, customer support, etc. Presenting Core Business Divisions With Enterprise Workforce Ppt Styles Examples PDF to dispense important information. This template comprises two stages. It also presents valuable insights into the topics including Core Team, Existing Business, New Growth Innovation. This is a completely customizable PowerPoint theme that can be put to use immediately. So, download it and address the topic impactfully.

Two Factors Variables Assessment Chart Ppt PowerPoint Presentation File Clipart PDF
Presenting this set of slides with name two factors variables assessment chart ppt powerpoint presentation file clipart pdf. This is a two stage process. The stages in this process are two factors variables assessment chart. This is a completely editable PowerPoint presentation and is available for immediate download. Download now and impress your audience.

Facility Management Services Offered By The Company Developing Tactical Fm Services Diagrams PDF
Find highly impressive Facility Management Services Offered By The Company Developing Tactical Fm Services Diagrams PDF on Slidegeeks to deliver a meaningful presentation. You can save an ample amount of time using these presentation templates. No need to worry to prepare everything from scratch because Slidegeeks experts have already done a huge research and work for you. You need to download Facility Management Services Offered By The Company Developing Tactical Fm Services Diagrams PDF for your upcoming presentation. All the presentation templates are 100 Precent editable and you can change the color and personalize the content accordingly. Download now.

Gross Margin Analysis Bar Chart Powerpoint Slide Backgrounds
This is a gross margin analysis bar chart powerpoint slide backgrounds. This is a two stage process. The stages in this process are bar graph, business, marketing, growth, success.

Hierarchy Chart Sample Templates Ppt PowerPoint Presentation Background Designs
This is a hierarchy chart sample templates ppt powerpoint presentation background designs. This is a two stage process. The stages in this process are business, marketing, management, communication, planning.

Xbar And R Chart Ppt PowerPoint Presentation Example 2015
This is a xbar and r chart ppt powerpoint presentation example 2015. This is a two stage process. The stages in this process are business, strategy, marketing, success, growth strategy.
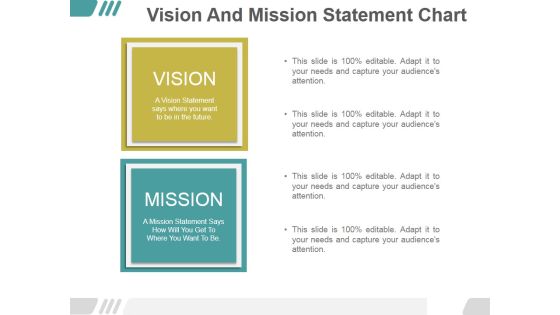
Vision And Mission Statement Chart Ppt PowerPoint Presentation Samples
This is a vision and mission statement chart ppt powerpoint presentation samples. This is a two stage process. The stages in this process are vision, business, marketing, mission, management.

Vision And Mission Statement Chart Ppt PowerPoint Presentation Model Demonstration
This is a vision and mission statement chart ppt powerpoint presentation model demonstration. This is a two stage process. The stages in this process are vision, mission, business, strategy, management.

Line Chart Ppt PowerPoint Presentation File Graphic Images
This is a line chart ppt powerpoint presentation file graphic images. This is a two stage process. The stages in this process are business, strategy, marketing, planning, growth strategy, finance.

Line Chart Ppt Powerpoint Presentation Infographic Template Format
This is a line chart ppt powerpoint presentation infographic template format. This is a two stage process. The stages in this process are jan, feb, mar, apr, may, financial.
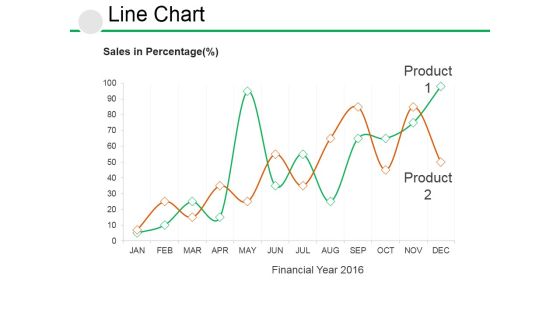
Line Chart Ppt PowerPoint Presentation Visual Aids Example File
This is a line chart ppt powerpoint presentation visual aids example file. This is a two stage process. The stages in this process are business, growth, strategy, analysis, management.

Line Chart Ppt PowerPoint Presentation Model Design Templates
This is a line chart ppt powerpoint presentation model design templates. This is a two stage process. The stages in this process are sales in percentage, financial years, product.

Area Chart Ppt PowerPoint Presentation Show Layout Ideas
This is a area chart ppt powerpoint presentation show layout ideas. This is a two stage process. The stages in this process are product, in percentage, financial year, growth.
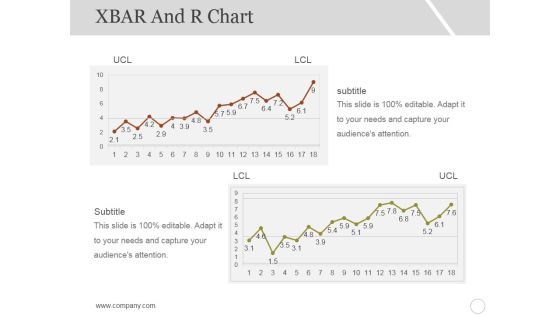
Xbar And R Chart Ppt PowerPoint Presentation Inspiration Styles
This is a xbar and r chart ppt powerpoint presentation inspiration styles. This is a two stage process. The stages in this process are subtitle, lcl, ucl, growth, graph.
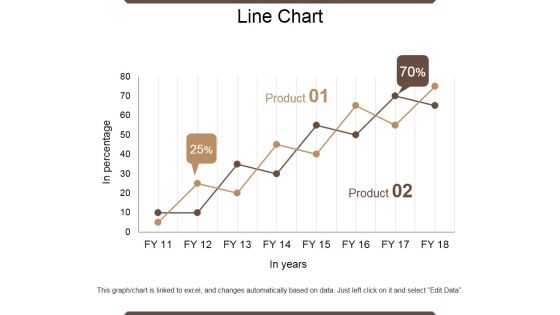
Line Chart Ppt PowerPoint Presentation Outline Infographic Template
This is a line chart ppt powerpoint presentation outline infographic template. This is a two stage process. The stages in this process are in percentage, product, in year, growth, success.

Area Chart Ppt PowerPoint Presentation Infographic Template Samples
This is a area chart ppt powerpoint presentation infographic template samples. This is a two stage process. The stages in this process are in percentage product, business, marketing, growth.
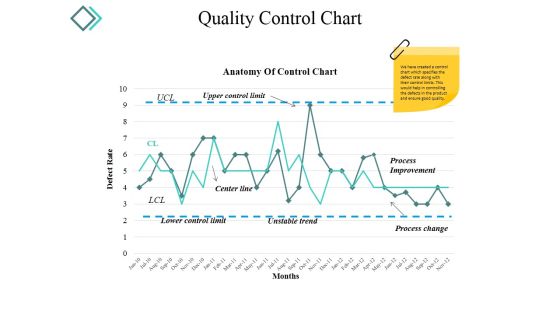
Quality Control Chart Ppt PowerPoint Presentation Model Background Images
This is a quality control chart ppt powerpoint presentation model background images. This is a two stage process. The stages in this process are center line, process improvement, process change, unstable trend.
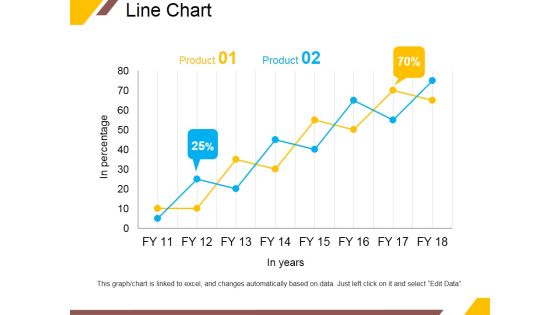
Line Chart Ppt PowerPoint Presentation Portfolio Infographic Template
This is a line chart ppt powerpoint presentation portfolio infographic template. This is a two stage process. The stages in this process are product, in years, business, percentage, growth.

Area Chart Ppt PowerPoint Presentation File Graphic Tips
This is a area chart ppt powerpoint presentation file graphic tips. This is a two stage process. The stages in this process are product, in percentage, financial year, business, growth.
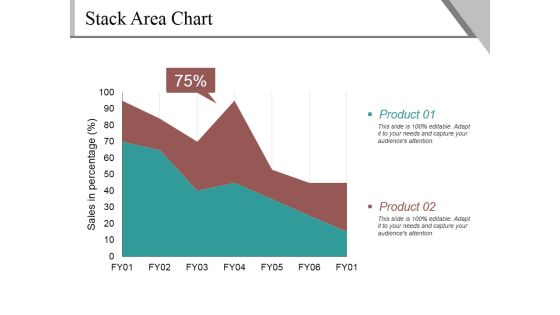
Stack Area Chart Ppt PowerPoint Presentation Gallery Guidelines
This is a stack area chart ppt powerpoint presentation gallery guidelines. This is a two stage process. The stages in this process are sales in percentage, product, percentage, business.

Stack Area Chart Ppt PowerPoint Presentation Example File
This is a stack area chart ppt powerpoint presentation example file. This is a two stage process. The stages in this process are product, sales in percentage, percentage, finance.

Line Chart Ppt PowerPoint Presentation Portfolio Design Templates
This is a line chart ppt powerpoint presentation portfolio design templates. This is a two stage process. The stages in this process are in percentage, in years, percentage, business, graph.

Column Chart Ppt PowerPoint Presentation Gallery Graphics Example
This is a column chart ppt powerpoint presentation gallery graphics example. This is a two stage process. The stages in this process are expenditure in, years, business, marketing, growth.
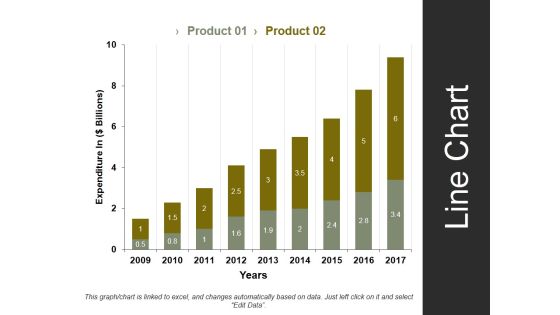
Line Chart Template 1 Ppt PowerPoint Presentation Styles Summary
This is a line chart template 1 ppt powerpoint presentation styles summary. This is a two stage process. The stages in this process are expenditure in, years, business, marketing, strategy.

Column Chart Ppt PowerPoint Presentation Model Graphics Download
This is a column chart ppt powerpoint presentation model graphics download. This is a two stage process. The stages in this process are product, financial year, sales in percentage, bar graph, success.

Scatter Bubble Chart Ppt PowerPoint Presentation Styles Objects
This is a scatter bubble chart ppt powerpoint presentation styles objects. This is a two stage process. The stages in this process are product, in price, highest sale, percentage, finance.

Column Chart Ppt PowerPoint Presentation Gallery Slide Portrait
This is a column chart ppt powerpoint presentation gallery slide portrait. This is a two stage process. The stages in this process are sales in percentage, financial year, product, bar graph, growth.
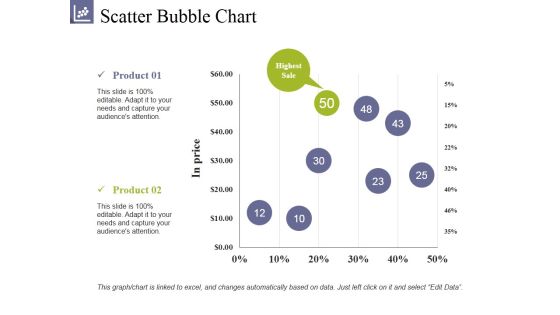
Scatter Bubble Chart Ppt PowerPoint Presentation Summary Clipart
This is a scatter bubble chart ppt powerpoint presentation summary clipart. This is a two stage process. The stages in this process are product, highest sale, in prices, growth, success.

Bar Chart Ppt PowerPoint Presentation Infographics Format Ideas
This is a bar chart ppt powerpoint presentation infographics format ideas. This is a two stage process. The stages in this process are bar graph, product, financial year, sales in percentage.

Bubble Chart Ppt PowerPoint Presentation Layouts Clipart Images
This is a bubble chart ppt powerpoint presentation layouts clipart images. This is a two stage process. The stages in this process are business, marketing, profit, innovation, technology, idea bulb.

Client Achievements Playbook One Customer Data Platform To Meet All Needs Rules PDF
Following slide depicts the companys customer data platform, which is designed to meet the data needs of customer success team. Data sources covered in the diagram are website, POS, customer feedback etc. This is a client achievements playbook one customer data platform to meet all needs rules pdf template with various stages. Focus and dispense information on two stages using this creative set, that comes with editable features. It contains large content boxes to add your information on topics like data sources, customer success team, ecommerce website, mobile application, customer service specialist. You can also showcase facts, figures, and other relevant content using this PPT layout. Grab it now.
Discussion Of Two Persons For Business Deals Icon Ppt PowerPoint Presentation Icon Visuals PDF
Presenting discussion of two persons for business deals icon ppt powerpoint presentation icon visuals pdf to dispense important information. This template comprises two stages. It also presents valuable insights into the topics including discussion of two persons for business deals icon. This is a completely customizable PowerPoint theme that can be put to use immediately. So, download it and address the topic impactfully.
Two Employees Communicating Vector Icon Ppt PowerPoint Presentation Icon Infographic Template PDF
Presenting two employees communicating vector icon ppt powerpoint presentation icon infographic template pdf to dispense important information. This template comprises two stages. It also presents valuable insights into the topics including two employees communicating vector icon. This is a completely customizable PowerPoint theme that can be put to use immediately. So, download it and address the topic impactfully.

Competitive Assessment Chart With Market Share Ppt PowerPoint Presentation File Clipart PDF
Presenting competitive assessment chart with market share ppt powerpoint presentation file clipart pdf to dispense important information. This template comprises two stages. It also presents valuable insights into the topics including competitive assessment chart with market share. This is a completely customizable PowerPoint theme that can be put to use immediately. So, download it and address the topic impactfully.

Effort Save Grid Chart With Value To User Ppt PowerPoint Presentation Gallery Graphics Download PDF
Presenting effort save grid chart with value to user ppt powerpoint presentation gallery graphics download pdf to dispense important information. This template comprises two stages. It also presents valuable insights into the topics including effort save grid chart with value to user. This is a completely customizable PowerPoint theme that can be put to use immediately. So, download it and address the topic impactfully.

Consultant Doing Competitive Assessment Through Product Positioning Chart Ppt PowerPoint Presentation Outline Files PDF
Presenting consultant doing competitive assessment through product positioning chart ppt powerpoint presentation outline files pdf to dispense important information. This template comprises two stages. It also presents valuable insights into the topics including consultant doing competitive assessment through product positioning chart. This is a completely customizable PowerPoint theme that can be put to use immediately. So, download it and address the topic impactfully.

Upward And Downward Arrow With Chart Vector Illustration Ppt PowerPoint Presentation Styles Graphics Example PDF
Presenting upward and downward arrow with chart vector illustration ppt powerpoint presentation styles graphics example pdf to dispense important information. This template comprises two stages. It also presents valuable insights into the topics including upward and downward arrow with chart vector illustration. This is a completely customizable PowerPoint theme that can be put to use immediately. So, download it and address the topic impactfully.
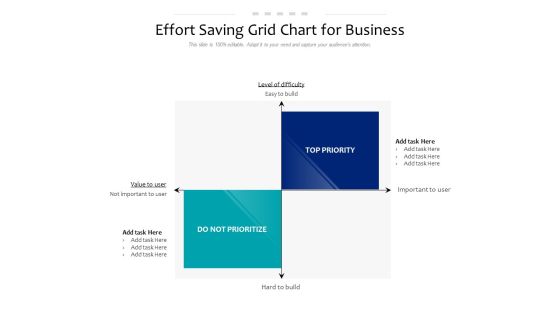
Effort Saving Grid Chart For Business Ppt PowerPoint Presentation Ideas Example File PDF
Presenting effort saving grid chart for business ppt powerpoint presentation ideas example file pdf to dispense important information. This template comprises two stages. It also presents valuable insights into the topics including effort saving grid chart for business. This is a completely customizable PowerPoint theme that can be put to use immediately. So, download it and address the topic impactfully.

Column Chart Ppt PowerPoint Presentation Model Design Inspiration
This is a column chart ppt powerpoint presentation model design inspiration. This is a three stage process. The stages in this process are business, marketing, bar, graph, plan.

Half Yearly Data Quality Assessment Systems Roadmap Diagrams
We present our half yearly data quality assessment systems roadmap diagrams. This PowerPoint layout is easy-to-edit so you can change the font size, font type, color, and shape conveniently. In addition to this, the PowerPoint layout is Google Slides compatible, so you can share it with your audience and give them access to edit it. Therefore, download and save this well-researched half yearly data quality assessment systems roadmap diagrams in different formats like PDF, PNG, and JPG to smoothly execute your business plan.

Annual Trends Ppt PowerPoint Presentation Diagram PDF
Presenting Annual Trends Ppt PowerPoint Presentation Diagram PDF to dispense important information. This template comprises two stages. It also presents valuable insights into the topics including Annual Trends. This is a completely customizable PowerPoint theme that can be put to use immediately. So, download it and address the topic impactfully.
Fine Tuning Of Concept Ppt PowerPoint Presentation Icon Show
This is a fine tuning of concept ppt powerpoint presentation icon show. This is a three stage process. The stages in this process are determine decision making authority, support from management, data migration plan, composition of project team, project management, training for users.

Half Yearly HR Transformation Trimonthly By Trimonthly Process Roadmap Diagrams
We present our half yearly hr transformation trimonthly by trimonthly process roadmap diagrams. This PowerPoint layout is easy to edit so you can change the font size, font type, color, and shape conveniently. In addition to this, the PowerPoint layout is Google Slides compatible, so you can share it with your audience and give them access to edit it. Therefore, download and save this well researched half yearly hr transformation trimonthly by trimonthly process roadmap diagrams in different formats like PDF, PNG, and JPG to smoothly execute your business plan.
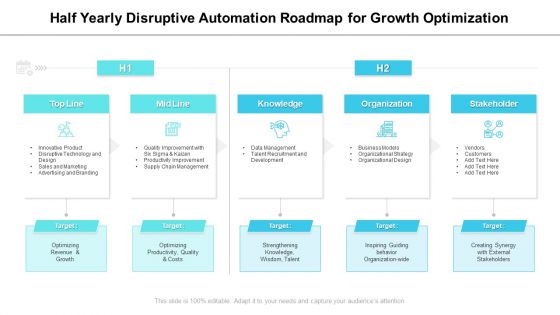
Half Yearly Disruptive Automation Roadmap For Growth Optimization Diagrams
We present our half yearly disruptive automation roadmap for growth optimization diagrams. This PowerPoint layout is easy to edit so you can change the font size, font type, color, and shape conveniently. In addition to this, the PowerPoint layout is Google Slides compatible, so you can share it with your audience and give them access to edit it. Therefore, download and save this well researched half yearly disruptive automation roadmap for growth optimization diagrams in different formats like PDF, PNG, and JPG to smoothly execute your business plan.

Half Yearly Retirement Timeline Diagram With Goals And Objectives Summary
We present our half yearly retirement timeline diagram with goals and objectives summary. This PowerPoint layout is easy to edit so you can change the font size, font type, color, and shape conveniently. In addition to this, the PowerPoint layout is Google Slides compatible, so you can share it with your audience and give them access to edit it. Therefore, download and save this well researched half yearly retirement timeline diagram with goals and objectives summary in different formats like PDF, PNG, and JPG to smoothly execute your business plan.
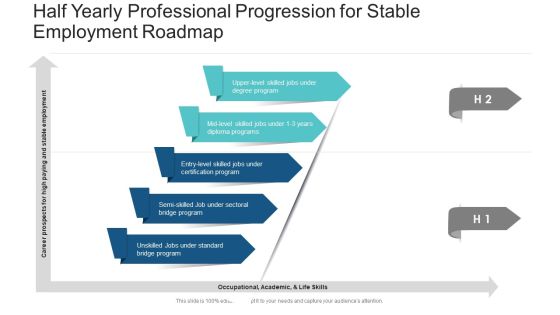
Half Yearly Professional Progression For Stable Employment Roadmap Diagrams
We present our half yearly professional progression for stable employment roadmap diagrams. This PowerPoint layout is easy to edit so you can change the font size, font type, color, and shape conveniently. In addition to this, the PowerPoint layout is Google Slides compatible, so you can share it with your audience and give them access to edit it. Therefore, download and save this well researched half yearly professional progression for stable employment roadmap diagrams in different formats like PDF, PNG, and JPG to smoothly execute your business plan.

Tools To Identify Market Opportunities For Business Growth Customer Strategy Options Mockup PDF
Presenting tools to identify market opportunities for business growth customer strategy options mockup pdf. to provide visual cues and insights. Share and navigate important information on two stages that need your due attention. This template can be used to pitch topics like Strengthen your Existing Customer Base, Poor marke, Increase your Customer Base, New product, New target, Dropping sales. In addtion, this PPT design contains high resolution images, graphics, etc, that are easily editable and available for immediate download.

Agile Organization Chart Ppt PowerPoint Presentation File Sample Cpb
Presenting this set of slides with name agile organization chart ppt powerpoint presentation file sample cpb. This is an editable Powerpoint two stages graphic that deals with topics like agile organization chart to help convey your message better graphically. This product is a premium product available for immediate download and is 100 percent editable in Powerpoint. Download this now and use it in your presentations to impress your audience.

Organizations Employee Creating Gantt Charts For Data Representation Download PDF
Persuade your audience using this organizations employee creating gantt charts for data representation download pdf. This PPT design covers two stages, thus making it a great tool to use. It also caters to a variety of topics including organizations employee creating gantt charts for data representation. Download this PPT design now to present a convincing pitch that not only emphasizes the topic but also showcases your presentation skills.
 Home
Home