2 Phases
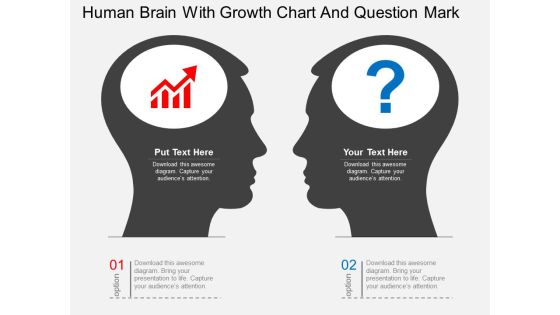
Human Brain With Growth Chart And Question Mark Powerpoint Template
This PowerPoint template has been designed with graphics of human brain with growth chart and question mark. This diagram can be used to display creative thinking in business. Capture the attention of your audience with this slide.
Vertical And Horizontal Org Charts Ppt PowerPoint Presentation Model Icon PDF
Presenting this set of slides with name vertical and horizontal org charts ppt powerpoint presentation model icon pdf. This is a two stage process. The stages in this process are vertical, horizontal. This is a completely editable PowerPoint presentation and is available for immediate download. Download now and impress your audience.

Conversion Rate Optimization Funnel Chart With Icons Ppt PowerPoint Presentation Layouts Visual Aids PDF
Presenting this set of slides with name conversion rate optimization funnel chart with icons ppt powerpoint presentation layouts visual aids pdf. This is a two stage process. The stages in this process are conversion optimization, cro. This is a completely editable PowerPoint presentation and is available for immediate download. Download now and impress your audience.

Industry Overview Percentage Chart Ppt Slides
This is a industry overview percentage chart ppt slides. This is a two stage process. The stages in this process are business, marketing.
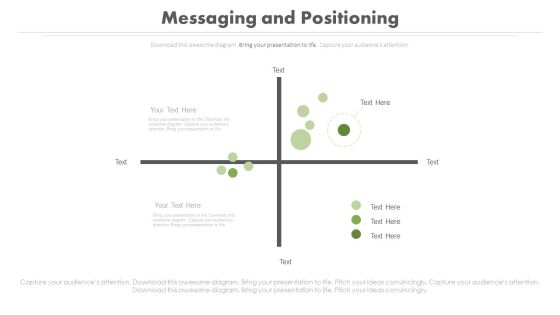
Messaging And Positioning Line Chart Ppt Slides
This is a messaging and positioning line chart ppt slides. This is a two stage process. The stages in this process are business, marketing.
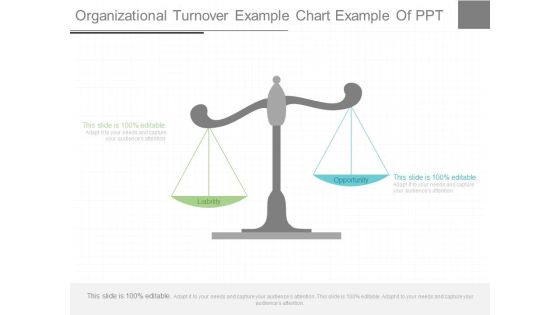
Organizational Turnover Example Chart Example Of Ppt
This is a organizational turnover example chart example of ppt. This is a two stage process. The stages in this process are liability, opportunity.

Health Scorecard Table Chart Powerpoint Ideas
This is a health scorecard table chart powerpoint ideas. This is a two stage process. The stages in this process are overall score, qualitative aspects, quantitative aspects.

Profit And Loss Balance Chart Ppt Design
This is a profit and loss balance chart ppt design. This is a two stage process. The stages in this process are business, management, success, presentation, marketing.

Cost Benefit Assessment Arrow Chart Presentation Outline
This is a cost benefit assessment arrow chart presentation outline. This is a two stage process. The stages in this process are compare, arrows, finance, money, strategy.

Comparison Chart For Performance Analysis Ppt Design
This is a comparison chart for performance analysis ppt design. This is a two stage process. The stages in this process are compare, scale, measurement, business, marketing.

Comparison Chart Ppt PowerPoint Presentation Show
This is a comparison chart ppt powerpoint presentation show. This is a two stage process. The stages in this process are business, strategy, marketing, analysis, growth strategy, compare.

Area Chart Ppt PowerPoint Presentation Images
This is a area chart ppt powerpoint presentation images. This is a two stage process. The stages in this process are business, strategy, marketing, analysis, finance.

Column Chart Ppt PowerPoint Presentation Portfolio Designs
This is a column chart ppt powerpoint presentation portfolio designs. This is a two stage process. The stages in this process are business, marketing, timeline, growth, compare.

Area Chart Ppt PowerPoint Presentation Summary Deck
This is a area chart ppt powerpoint presentation summary deck. This is a two stage process. The stages in this process are sales in percentage, financial year.

Area Chart Ppt PowerPoint Presentation Professional Display
This is a area chart ppt powerpoint presentation professional display. This is a two stage process. The stages in this process are business, finance, growth, strategy, marketing, analysis.

Area Chart Ppt PowerPoint Presentation Slides Inspiration
This is a area chart ppt powerpoint presentation slides inspiration. This is a two stage process. The stages in this process are business, marketing, finance, growth, management.

Column Chart Ppt PowerPoint Presentation Show Shapes
This is a column chart ppt powerpoint presentation show shapes. This is a two stage process. The stages in this process are sales, product, business, management, finance.

Scatter Chart Ppt PowerPoint Presentation Gallery Layout
This is a scatter chart ppt powerpoint presentation gallery layout. This is a two stage process. The stages in this process are financial, marketing, management, strategy, planning.

Line Chart Ppt PowerPoint Presentation Gallery Summary
This is a line chart ppt powerpoint presentation gallery summary. This is a two stage process. The stages in this process are finance, graph, business, management, marketing.

Area Chart Ppt PowerPoint Presentation Slides Gridlines
This is a area chart ppt powerpoint presentation slides gridlines. This is a two stage process. The stages in this process are business, finance, marketing, percentage.

Line Chart Ppt PowerPoint Presentation Portfolio Shapes
This is a line chart ppt powerpoint presentation portfolio shapes. This is a two stage process. The stages in this process are profit, product, business, marketing, graph.
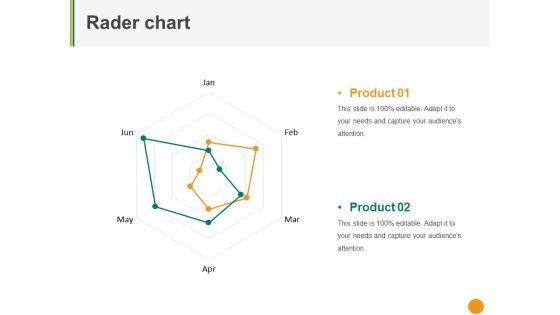
Rader Chart Ppt PowerPoint Presentation Professional Pictures
This is a rader chart ppt powerpoint presentation professional pictures. This is a two stage process. The stages in this process are product, finance, business, marketing.

Bubble Chart Ppt PowerPoint Presentation Outline Smartart
This is a bubble chart ppt powerpoint presentation outline smartart. This is a two stage process. The stages in this process are analysis, finance, business, marketing, strategy.

Line Chart Ppt PowerPoint Presentation Portfolio Inspiration
This is a line chart ppt powerpoint presentation portfolio inspiration. This is a two stage process. The stages in this process are business, marketing, strategy, planning, finance.
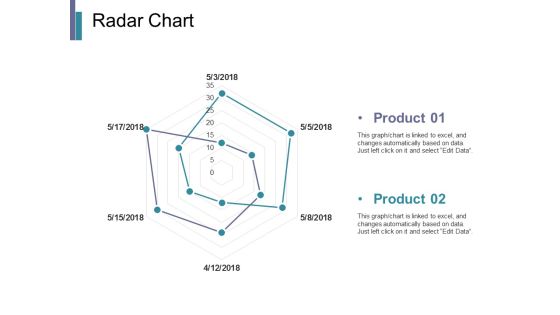
Radar Chart Ppt PowerPoint Presentation Infographics Pictures
This is a radar chart ppt powerpoint presentation infographics pictures. This is a two stage process. The stages in this process are business, marketing, strategy, planning, finance.

Bubble Chart Ppt PowerPoint Presentation Portfolio Show
This is a bubble chart ppt powerpoint presentation portfolio show. This is a two stage process. The stages in this process are business, marketing, strategy, planning, finance.

Column Chart Ppt PowerPoint Presentation Slides Format
This is a column chart ppt powerpoint presentation slides format. This is a two stage process. The stages in this process are finance, marketing, management, investment, analysis.

Column Chart Ppt PowerPoint Presentation Show Outfit
This is a column chart ppt powerpoint presentation show outfit. This is a two stage process. The stages in this process are product, percentage, marketing.

Line Chart Ppt PowerPoint Presentation Summary Guidelines
This is a line chart ppt powerpoint presentation summary guidelines. This is a two stage process. The stages in this process are percentage, product, business, management, marketing.

Column Chart Ppt PowerPoint Presentation Gallery Templates
This is a column chart ppt powerpoint presentation gallery templates. This is a two stage process. The stages in this process are management, marketing, business, percentage.
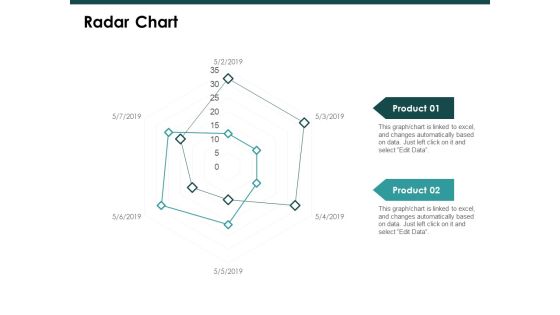
Radar Chart Graph Ppt PowerPoint Presentation Slide
This is a radar chart graph ppt powerpoint presentation slide. This is a two stage process. The stages in this process are finance, marketing, management, investment, analysis.

Area Chart Ppt PowerPoint Presentation Model Influencers
This is a area chart ppt powerpoint presentation model influencers. This is a two stage process. The stages in this process are sales in percentage, chart, business, marketing, finance.
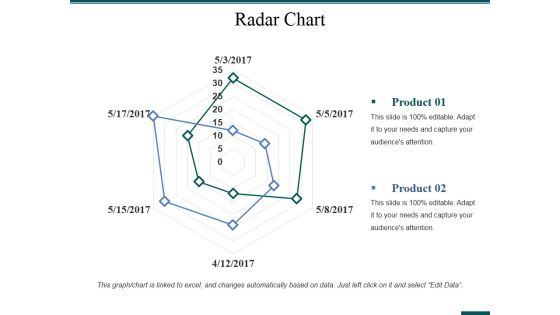
Radar Chart Ppt PowerPoint Presentation Layouts Gallery
This is a radar chart ppt powerpoint presentation layouts gallery. This is a two stage process. The stages in this process are business, analysis, strategy, marketing, radar chart, finance.
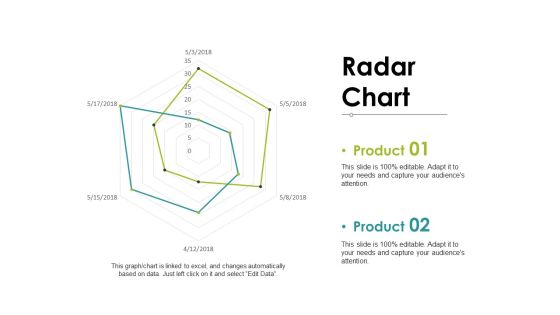
Radar Chart Ppt PowerPoint Presentation Ideas Mockup
This is a stacked column ppt powerpoint presentation pictures layouts. This is a two stage process. The stages in this process are business, marketing, planning, finance, strategy.
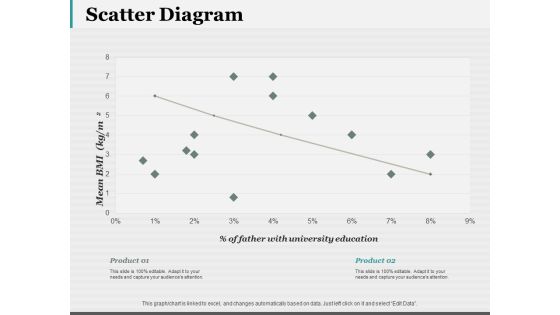
Scatter Diagram Ppt PowerPoint Presentation Model Mockup
This is a scatter diagram ppt powerpoint presentation model mockup. This is a two stage process. The stages in this process are scatter diagram, finance, marketing, strategy, business.
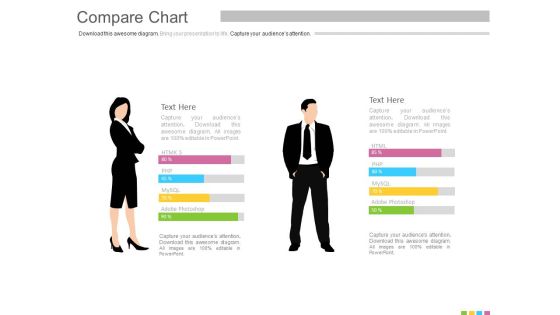
Male And Female Skills Assessment Chart Powerpoint Slides
This PPT slide displays graphics of compare chart with business man and woman. Use this PPT design to display skill assessment chart. This PowerPoint template can be customized as per requirements of business education or any other theme.
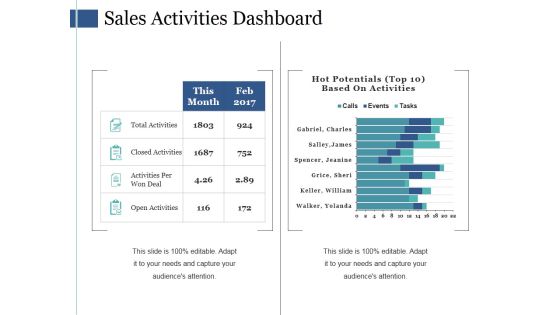
Sales Activities Dashboard Ppt PowerPoint Presentation Ideas Themes
This is a sales activities dashboard ppt powerpoint presentation ideas themes. This is a two stage process. The stages in this process are total activities, closed activities, activities per won deal, open activities.
Office Buildings Compare Chart Powerpoint Slides
This PowerPoint template has been designed with two office buildings. Download this compare chart to make business presentations. You can modify the color, font size and text according to the requirement and the template can be utilized for various purposes

Workforce Performance Comparison Chart Powerpoint Slides Templates
This is a workforce performance comparison chart powerpoint slides templates. This is a two stage process. The stages in this process are customer focus, accountability, service excellence, problem solving, continuous improvement, collaborative conflict resolution.

Column Chart Ppt PowerPoint Presentation Background Designs
This is a column chart ppt powerpoint presentation background designs. This is a two stage process. The stages in this process are bar graph, finance, marketing, strategy, analysis, business.

Clustered Column Ppt PowerPoint Presentation Styles Diagrams
This is a clustered column ppt powerpoint presentation styles diagrams. This is a two stage process. The stages in this process are business, marketing, graph, finance, clustered column.

Column Chart Ppt PowerPoint Presentation Summary Shapes
This is a column chart ppt powerpoint presentation summary shapes. This is a three stage process. The stages in this process are business, marketing, strategy, finance, planning.

Line Chart Ppt PowerPoint Presentation Summary Topics
This is a line chart ppt powerpoint presentation summary topics. This is a three stage process. The stages in this process are business, marketing, strategy, planning, finance.

Line Chart Ppt PowerPoint Presentation Styles Backgrounds
This is a line chart ppt powerpoint presentation styles backgrounds. This is a three stage process. The stages in this process are business, marketing, strategy, planning, finance.

Area Chart Ppt PowerPoint Presentation Model Designs
This is a area chart ppt powerpoint presentation model designs. This is a three stage process. The stages in this process are business, marketing, strategy, planning, finance.
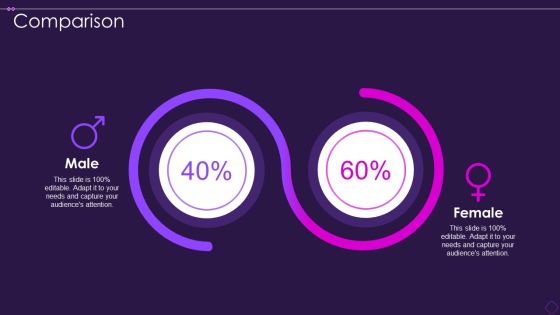
Scrum Organizational Chart Comparison Download PDF
Presenting scrum organizational chart comparison download pdf to provide visual cues and insights. Share and navigate important information on two stages that need your due attention. This template can be used to pitch topics like female, male. In addtion, this PPT design contains high resolution images, graphics, etc, that are easily editable and available for immediate download.

Comparison Ppt PowerPoint Presentation Themes
This is a comparison ppt powerpoint presentation themes. This is a two stage process. The stages in this process are compare, business, marketing, finance.

Dashboard Ppt PowerPoint Presentation Themes
This is a dashboard ppt powerpoint presentation themes. This is a two stage process. The stages in this process are low, high, poor, good, excellent.

Area Stacked Ppt PowerPoint Presentation Diagram Images
This is a area stacked ppt powerpoint presentation diagram images. This is a two stage process. The stages in this process are sales in percentage, product, business, marketing, finance.
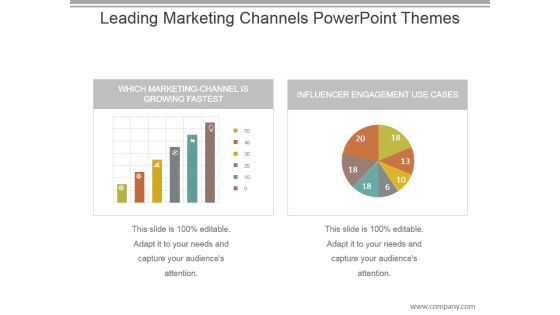
Leading Marketing Channels Powerpoint Themes
This is a leading marketing channels powerpoint themes. This is a two stage process. The stages in this process are which marketing channel is growing fastest, influencer engagement use cases.
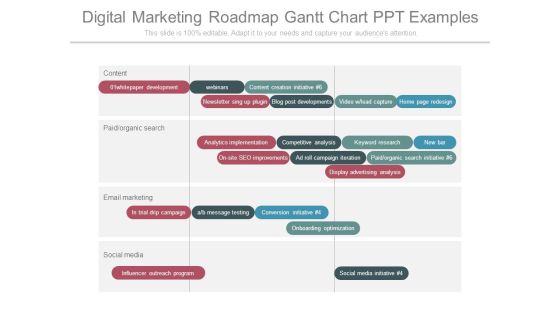
Digital Marketing Roadmap Gantt Chart Ppt Examples
This is a digital marketing roadmap gantt chart ppt examples. This is a two stage process. The stages in this process are content, whitepaper development, webinars, content creation initiative, newsletter sing up plugin, blog post developments, video lead capture, home page redesign, paid organic search, analytics implementation, competitive analysis, keyword research, new bar, on site seo improvements, ad roll campaign iteration, paid organic search initiative, display advertising analysis, email marketing, trial drip campaign, a b message testing, conversion initiative, onboarding optimization, social media, influencer outreach program, social media initiative.
Pros And Cons Layout To Resolve Department Conflict Ppt PowerPoint Presentation Icon Diagrams PDF
Presenting pros and cons layout to resolve department conflict ppt powerpoint presentation icon diagrams pdf to dispense important information. This template comprises two stages. It also presents valuable insights into the topics including pros and cons layout to resolve department conflict. This is a completely customizable PowerPoint theme that can be put to use immediately. So, download it and address the topic impactfully.

Reasons To Invest In Green Energy Clean And Renewable Energy Ppt PowerPoint Presentation Diagram Graph Charts PDF
This slide illustrates why people, organizations, and governments should invest in green energy by describing the impact of fossil fuels and non-renewable energies.Presenting Reasons To Invest In Green Energy Clean And Renewable Energy Ppt PowerPoint Presentation Diagram Graph Charts PDF to provide visual cues and insights. Share and navigate important information on two stages that need your due attention. This template can be used to pitch topics like Problems Traditional, Energy Sources, Solutions Provided. In addtion, this PPT design contains high resolution images, graphics, etc, that are easily editable and available for immediate download.
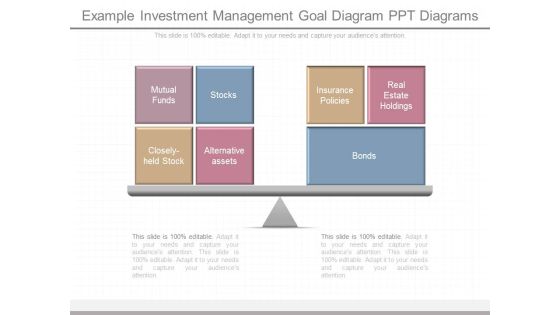
Example Investment Management Goal Diagram Ppt Diagrams
This is a example investment management goal diagram ppt diagrams. This is a two stage process. The stages in this process are mutual funds, closely held stock, stocks, alternative assets, insurance policies, real estate holdings, bonds.
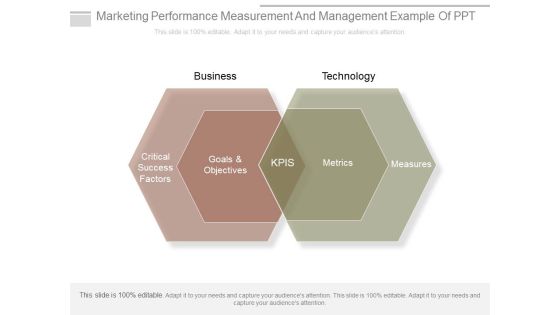
Marketing Performance Measurement And Management Example Of Ppt
This is a marketing performance measurement and management example of ppt. This is a two stage process. The stages in this process are business, technology, critical success factors, goals and objectives, kpis, metrics, measures.

Repositioning A Product Ppt PowerPoint Presentation Model Maker
This is a repositioning a product ppt powerpoint presentation model maker. This is a two stage process. The stages in this process are to new consumers, among existing customers.
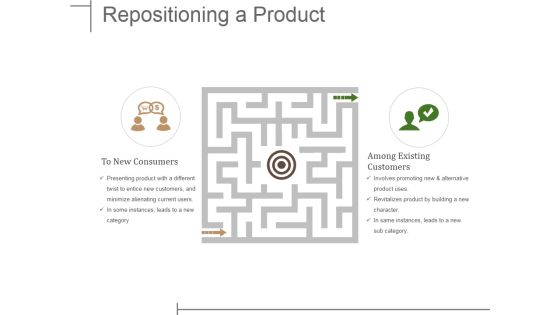
Repositioning A Product Ppt PowerPoint Presentation Styles Show
This is a repositioning a product ppt powerpoint presentation styles show. This is a two stage process. The stages in this process are to new consumers, among existing customers.

Compare Chart For Interactive Session Powerpoint Slides
This professional slide contains design of checklists of positive and negative points. You may use this compare chart for interactive session. Add this slide to your presentation and impress your superiors.
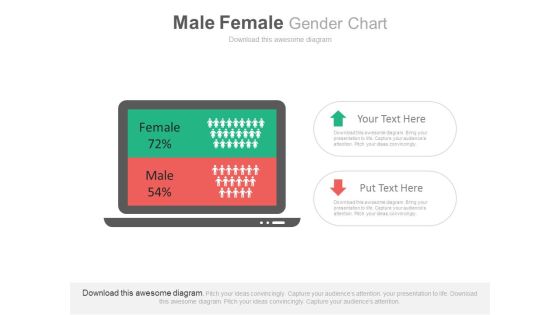
Population Statistics Compare Chart Powerpoint Slides
This PowerPoint template has been designed with compare chart slide layout. You may download this PPT slide to depict population statistics. Add this slide to your presentation and impress your superiors.

Two Commodity Comparison Diagram For Income Statement Components Introduction PDF
Presenting two commodity comparison diagram for income statement components introduction pdf to dispense important information. This template comprises two stages. It also presents valuable insights into the topics including two commodity comparison diagram for income statement components . This is a completely customizable PowerPoint theme that can be put to use immediately. So, download it and address the topic impactfully.

 Home
Home