2 Phases

Stock Chart Ppt PowerPoint Presentation Ideas Infographics
This is a stock chart ppt powerpoint presentation ideas infographics. This is a two stage process. The stages in this process are high, volume, low, product, stock chart.
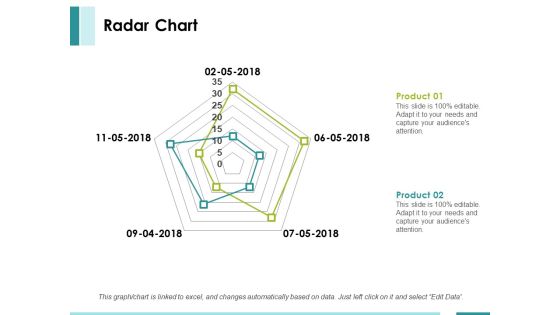
Radar Chart Ppt PowerPoint Presentation Summary Layout
This is a radar chart ppt powerpoint presentation summary layout. This is a two stage process. The stages in this process are product, finance, shape, radar chart, business.

Radar Chart Ppt PowerPoint Presentation File Rules
This is a radar chart ppt powerpoint presentation file rules. This is a two stage process. The stages in this process are product, radar chart, finance.

Data Driven Comparison Charts For Analysis Powerpoint Slides
You can download this PowerPoint template to display statistical data and analysis. This PPT slide contains data driven comparison charts. Draw an innovative business idea using this professional diagram.
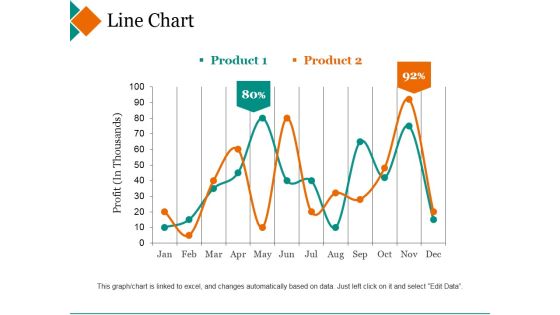
Line Chart Ppt PowerPoint Presentation Inspiration Deck
This is a line chart ppt powerpoint presentation inspiration deck. This is a two stage process. The stages in this process are product, profit, percentage, finance, line graph.

Radar Chart Ppt PowerPoint Presentation Infographics Portfolio
This is a radar chart ppt powerpoint presentation infographics portfolio. This is a two stage process. The stages in this process are product, finance, shapes, business, marketing.

Area Chart Ppt PowerPoint Presentation Show Backgrounds
This is a area chart ppt powerpoint presentation show backgrounds. This is a two stage process. The stages in this process are financial year, product, in percentage.

Area Chart Ppt PowerPoint Presentation Professional Grid
This is a area chart ppt powerpoint presentation professional grid. This is a two stage process. The stages in this process are product, sales in percentage, business.

Bar Chart Ppt PowerPoint Presentation Portfolio Inspiration
This is a bar chart ppt powerpoint presentation portfolio inspiration. This is a two stage process. The stages in this process are product, in percentage, in years.

Stock Chart Ppt PowerPoint Presentation Layouts Outfit
This is a stock chart ppt powerpoint presentation layouts outfit. This is a two stage process. The stages in this process are close, high, volume, low, open.

Stock Chart Ppt PowerPoint Presentation Guide
This is a stock chart ppt powerpoint presentation guide. This is a two stage process. The stages in this process are product, close, high, volume, low.

Area Chart Ppt PowerPoint Presentation Summary Model
This is a area chart ppt powerpoint presentation summary model. This is a two stage process. The stages in this process are analysis, finance, marketing, management, investment.

Bar Chart Ppt PowerPoint Presentation Inspiration Demonstration
This is a bar chart ppt powerpoint presentation inspiration demonstration. This is a two stage process. The stages in this process are bar chart, financial years, sales in percentage, product, finance.

Bar Chart Ppt PowerPoint Presentation Model Picture
This is a bar chart ppt powerpoint presentation model picture. This is a two stage process. The stages in this process are product, sales in percentage, financial years, bar chart.

Bar Chart Ppt PowerPoint Presentation Ideas Deck
This is a bar chart ppt powerpoint presentation ideas deck. This is a two stage process. The stages in this process are product, in percentage, in years, financial, business.
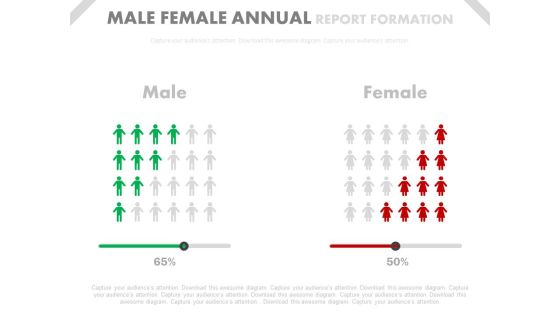
Male Female Ratio Comparison Chart Powerpoint Slides
This PowerPoint template has been designed with graphics of comparison chart. You may download this PPT slide to depict male female ratio comparison chart. Add this slide to your presentation and impress your superiors.
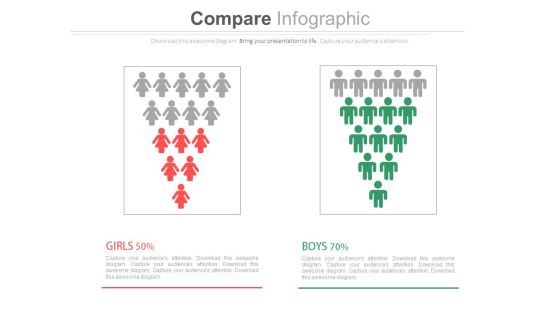
Male Female Gender Ratio Analysis Comparison Chart Powerpoint Slides
This PowerPoint template has been designed with graphics of male and female icons. Download this PPT slide to depict gender ratio analysis. Grab the attention of your team with this eye catching template.

Stock Chart Ppt PowerPoint Presentation Slides Graphics Pictures
This is a stock chart ppt powerpoint presentation slides graphics pictures. This is a two stage process. The stages in this process are product, high, volume, low, open.

Stacked Line Chart Ppt PowerPoint Presentation Pictures Elements
This is a stacked line chart ppt powerpoint presentation pictures elements. This is a two stage process. The stages in this process are product, profit, stacked line chart, year, business.

Radar Chart Ppt PowerPoint Presentation Summary Design Templates
This is a radar chart ppt powerpoint presentation summary design templates. This is a two stage process. The stages in this process are radar chart, product, shapes, business, marketing.

Radar Chart Ppt PowerPoint Presentation Inspiration Infographic Template
This is a radar chart ppt powerpoint presentation inspiration infographic template. This is a two stage process. The stages in this process are radar chart, product, business, finance, marketing.

Radar Chart Ppt PowerPoint Presentation Infographics Visual Aids
This is a radar chart ppt powerpoint presentation infographics visual aids. This is a two stage process. The stages in this process are radar chart, product, finance, business, marketing.
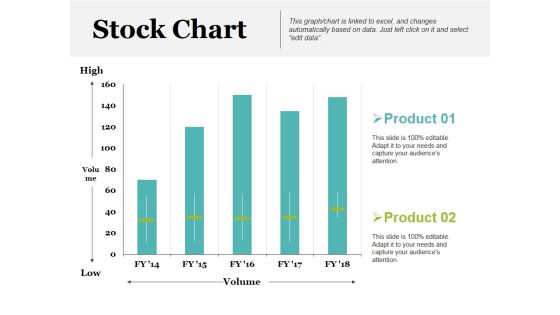
Stock Chart Ppt PowerPoint Presentation Inspiration Example Introduction
This is a stock chart ppt powerpoint presentation inspiration example introduction. This is a two stage process. The stages in this process are product, high, volume, low, stock chart.
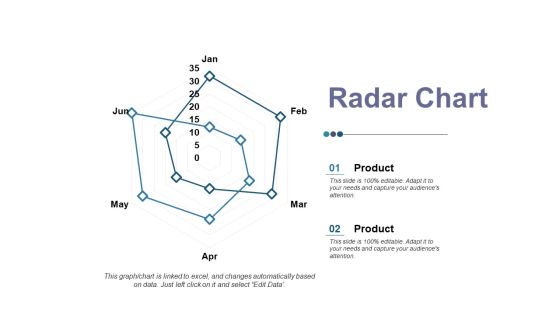
Radar Chart Ppt PowerPoint Presentation Professional Master Slide
This is a radar chart ppt powerpoint presentation professional master slide. This is a two stage process. The stages in this process are product, radar chart, financial, business, shape.
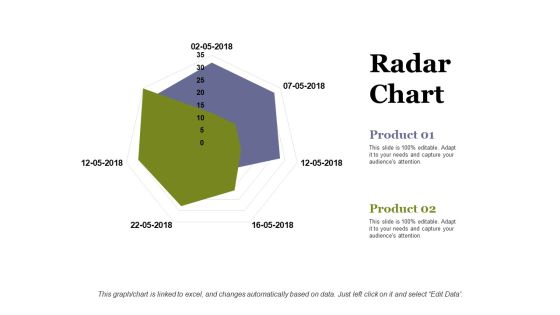
Radar Chart Ppt PowerPoint Presentation Infographic Template Information
This is a radar chart ppt powerpoint presentation infographic template information. This is a two stage process. The stages in this process are radar chart, product, business, marketing, shape.

Radar Chart Ppt PowerPoint Presentation Portfolio Graphics Template
This is a radar chart ppt powerpoint presentation portfolio graphics template. This is a two stage process. The stages in this process are product, finance, shape, radar chart, business.

Radar Chart Ppt PowerPoint Presentation Professional Infographic Template
This is a radar chart ppt powerpoint presentation professional infographic template. This is a two stage process. The stages in this process are product, finance, shape, radar chart, business.
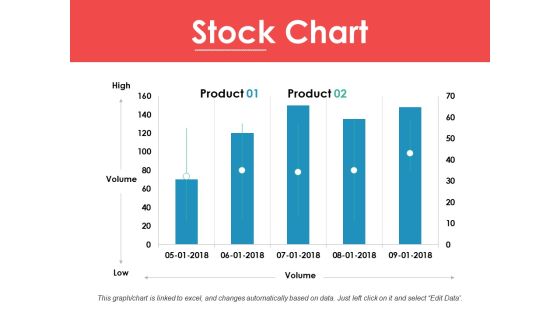
Stock Chart Ppt PowerPoint Presentation Ideas Infographic Template
This is a stock chart ppt powerpoint presentation ideas infographic template. This is a two stage process. The stages in this process are high, volume, low, product, stock chart.

Open High Low Close Chart Ppt PowerPoint Presentation Outline Rules
This is a open high low close chart ppt powerpoint presentation outline rules. This is a two stage process. The stages in this process are product, high, low, close, in percentage.
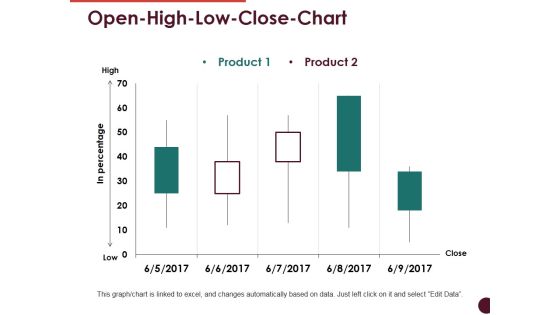
Open High Low Close Chart Ppt PowerPoint Presentation Professional Visuals
This is a open high low close chart ppt powerpoint presentation professional visuals. This is a two stage process. The stages in this process are high, low, in percentage, product, close.

Volume High Low Close Chart Ppt PowerPoint Presentation Infographics Good
This is a volume high low close chart ppt powerpoint presentation infographics good. This is a two stage process. The stages in this process are high, volume, low, product, close.

Bar Chart Ppt PowerPoint Presentation Slides Example File
This is a bar chart ppt powerpoint presentation slides example file. This is a two stage process. The stages in this process are product, financial years, sales in percentage.

Control Chart Template 1 Ppt PowerPoint Presentation Ideas Images
This is a control chart template 1 ppt powerpoint presentation ideas images. This is a two stage process. The stages in this process are average range or quality, upper control limit, lower control limit, time, process average.

Risk Analysis Complex Ppt PowerPoint Presentation Show Themes
This is a risk analysis complex ppt powerpoint presentation show themes. This is a two stage process. The stages in this process are description of risk, control measures, risk analysis, additional control.

Dashboard Ppt PowerPoint Presentation Diagram Lists
This is a dashboard ppt powerpoint presentation diagram lists. This is a two stage process. The stages in this process are low, medium, high, dashboard, measurement.

Column Chart Employee Value Proposition Ppt PowerPoint Presentation Slides Graphics Design
This is a column chart employee value proposition ppt powerpoint presentation slides graphics design. This is a two stage process. The stages in this process are business, management, strategy, analysis, marketing.

Boys And Girls Participants Details Chart Ppt Powerpoint Presentation Portfolio Layout Ideas
This is a boys and girls participants details chart ppt powerpoint presentation portfolio layout ideas. This is a two stage process. The stages in this process are list of participants, list of members, list of contributors.
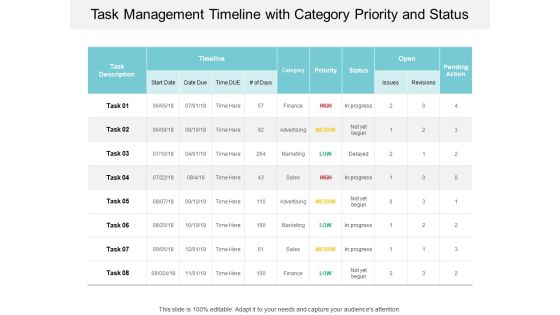
Task Management Timeline With Category Priority And Status Ppt PowerPoint Presentation Ideas Themes
This is a task management timeline with category priority and status ppt powerpoint presentation ideas themes. This is a two stage process. The stages in this process are activity tracker, business, marketing.
Financials Ppt PowerPoint Presentation Icon Deck
This is a financials ppt powerpoint presentation icon deck. This is a two stage process. The stages in this process are minimum, maximum, financial, percentage, icons.
Financial Ppt PowerPoint Presentation Icon Smartart
This is a financial ppt powerpoint presentation icon smartart. This is a two stage process. The stages in this process are silver, gold, dollar, symbol, feature.

Dashboard Ppt PowerPoint Presentation Icon Infographic Template
This is a dashboard ppt powerpoint presentation icon infographic template. This is a two stage process. The stages in this process are low, medium, high, dashboard, measurement.

Client Testimonials Ppt PowerPoint Presentation Icon Deck
This is a client testimonials ppt powerpoint presentation icon deck. This is a two stage process. The stages in this process are designation, about us, business, marketing, communication.

Comparison Ppt PowerPoint Presentation Pictures Icon
This is a comparison ppt powerpoint presentation pictures icon. This is a two stage process. The stages in this process are compare, percentage, finance, business, marketing.
Task Management And Planning Vector Icon Ppt Powerpoint Presentation Icon Master Slide
This is a task management and planning vector icon ppt powerpoint presentation icon master slide. This is a two stage process. The stages in this process are feedback loop icon, evaluation icon, assessment icon.

Finance And Time Management Balance Diagram Powerpoint Template
This PowerPoint template contains graphics of scale diagram with money and clock. This PPT slide is suitable to present money and time balance. Visual effect helps in maintaining the flow of the discussion and provides more clarity to the subject.

Comparison Risk Estimator Ppt PowerPoint Presentation Icon Layout
This is a comparison risk estimator ppt powerpoint presentation icon layout. This is a two stage process. The stages in this process are business, management, strategy, analysis, compare.
Task Planner Vector Icon Ppt PowerPoint Presentation Styles Maker
This is a task planner vector icon ppt powerpoint presentation styles maker. This is a two stage process. The stages in this process are agenda, schedule, timetable.

Comparison Sample Budget Ppt Ppt PowerPoint Presentation Gallery Icon
This is a comparison sample budget ppt ppt powerpoint presentation gallery icon. This is a two stage process. The stages in this process are business, management, strategy, analysis, icons.

Data Analysis Vector Icons Ppt Powerpoint Presentation Layouts Gridlines
This is a data analysis vector icons ppt powerpoint presentation layouts gridlines. This is a two stage process. The stages in this process are data presentation, content presentation, information presentation.
Income Cash Inflow Vector Icon Ppt Powerpoint Presentation Professional Vector
This is a income cash inflow vector icon ppt powerpoint presentation professional vector. This is a two stage process. The stages in this process are earn money, earn cash, earn funds.
Green Red Right Wrong Vector Icon Ppt Powerpoint Presentation Model Shapes
This is a green red right wrong vector icon ppt powerpoint presentation model shapes. This is a two stage process. The stages in this process are correct incorrect icon, dos and do not icon, right and wrong icon.
Icons Yes And No Vector With Text Holders Ppt Powerpoint Presentation Show Shapes
This is a icons yes and no vector with text holders ppt powerpoint presentation show shapes. This is a two stage process. The stages in this process are correct incorrect icon, dos and do not icon, right and wrong icon.
Man Woman Gender Vector Icon Ppt PowerPoint Presentation Ideas Background Image
This is a man woman gender vector icon ppt powerpoint presentation ideas background image. This is a two stage process. The stages in this process are human icon, person icon, man symbol.

Balance Between Burdens And Benefits Of Wealth Ppt PowerPoint Presentation Icon Show
This is a balance between burdens and benefits of wealth ppt powerpoint presentation icon show. This is a two stage process. The stages in this process are social justice, economic justice, welfare economics.

Balancing Scale With Dollar And Christian Cross Icon Ppt PowerPoint Presentation Visual Aids Ideas
This is a balancing scale with dollar and christian cross icon ppt powerpoint presentation visual aids ideas. This is a two stage process. The stages in this process are social justice, economic justice, welfare economics.

Balance Scale With Bag And Arrow Ppt PowerPoint Presentation Portfolio Icons
This is a balance scale with bag and arrow ppt powerpoint presentation portfolio icons. This is a two stage process. The stages in this process are handle, switch, levers.

Blue And Green Circles On Scale Board Ppt Powerpoint Presentation Icon Slideshow
This is a blue and green circles on scale board ppt powerpoint presentation icon slideshow. This is a two stage process. The stages in this process are balance scale, weighing scale, measuring scale.
Speed Dashboard With Arrows Percent Values And Icons Ppt PowerPoint Presentation Infographic Template Model
This is a speed dashboard with arrows percent values and icons ppt powerpoint presentation infographic template model. This is a two stage process. The stages in this process are fuel gauge, gas gauge, fuel containers.
Financial Efficiency And Increased Productivity Vector Icon Ppt Powerpoint Presentation Infographics Graphic Images
This is a financial efficiency and increased productivity vector icon ppt powerpoint presentation infographics graphic images. This is a two stage process. The stages in this process are earn money, earn cash, earn funds.
Man With Dollar Sign Vector Icon Ppt Powerpoint Presentation Summary Example Introduction
This is a man with dollar sign vector icon ppt powerpoint presentation summary example introduction. This is a two stage process. The stages in this process are earn money, earn cash, earn funds.

 Home
Home