2 Phases

Bar Chart Ppt PowerPoint Presentation Professional Files
This is a bar chart ppt powerpoint presentation professional files. This is a seven stage process. The stages in this process are bar chart, product, sales in percentage, financial years.

Stock Chart Ppt PowerPoint Presentation Backgrounds
This is a stock chart ppt powerpoint presentation backgrounds. This is a five stage process. The stages in this process are high, volume, low, close.
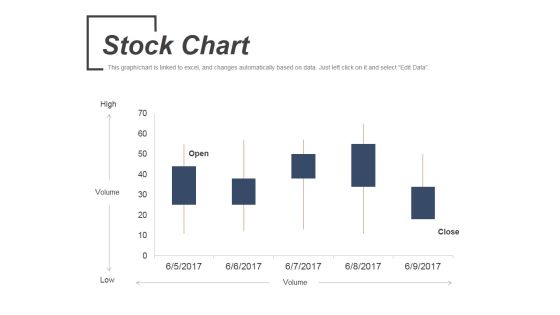
Stock Chart Ppt PowerPoint Presentation Ideas Topics
This is a stock chart ppt powerpoint presentation ideas topics. This is a five stage process. The stages in this process are volume, low, high, open, close.
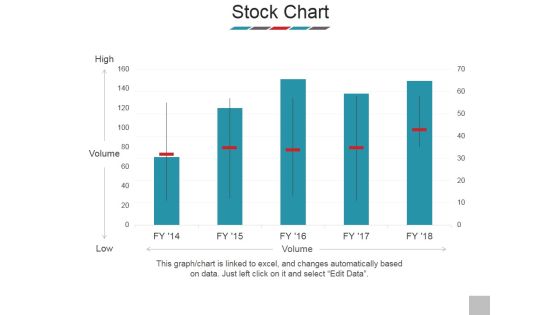
Stock Chart Ppt PowerPoint Presentation Show Templates
This is a stock chart ppt powerpoint presentation show templates. This is a five stage process. The stages in this process are high, volume, low, business, marketing.

Combo Chart Ppt PowerPoint Presentation Styles Good
This is a combo chart ppt powerpoint presentation styles good. This is a eight stage process. The stages in this process are market size, growth rate, product, growth, strategy, graph, finance.
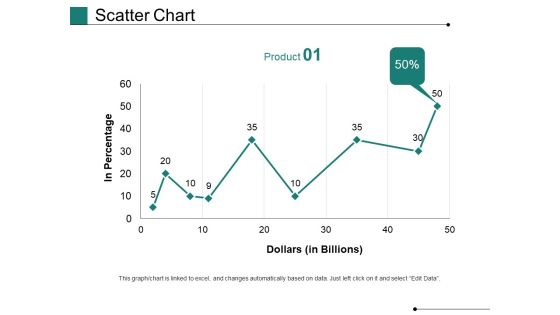
Scatter Chart Ppt PowerPoint Presentation Gallery Show
This is a scatter chart ppt powerpoint presentation gallery show. This is a one stage process. The stages in this process are in percentage, dollars, business, marketing, growth, graph.

Activity Planning Chart Ppt PowerPoint Presentation Shapes
This is a activity planning chart ppt powerpoint presentation shapes. This is a seven stage process. The stages in this process are business, marketing, management, chart, planning.

Bar Chart Ppt PowerPoint Presentation Deck
This is a bar chart ppt powerpoint presentation deck. This is a four stage process. The stages in this process are business, marketing, management, bar chart, finance.
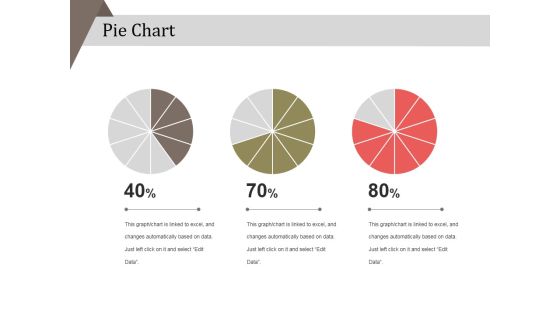
Pie Chart Ppt PowerPoint Presentation Layouts Example
This is a pie chart ppt powerpoint presentation layouts example. This is a three stage process. The stages in this process are business, strategy, analysis, pie chart, finance, marketing.
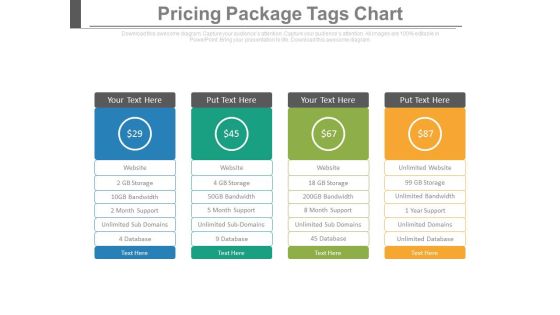
Pricing Package Tags Chart Ppt Slides
This is a pricing package tags chart ppt slides. This is a four stage process. The stages in this process are business, symbol, marketing, finance, success.
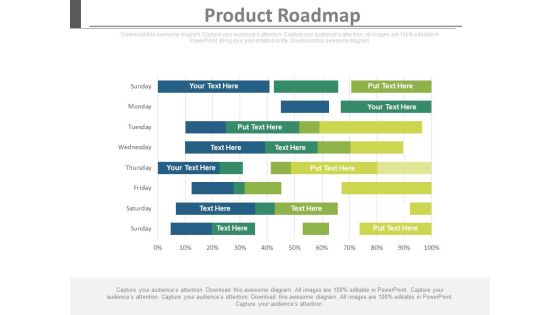
Product Roadmap Analysis Chart Ppt Slides
This is a product roadmap analysis chart ppt slides. This is a one stage process. The stages in this process are success, business, marketing.

Column Chart Ppt PowerPoint Presentation Introduction
This is a column chart ppt powerpoint presentation introduction. This is a nine stage process. The stages in this process are business, marketing, management, growth, timeline.

Combo Chart Ppt PowerPoint Presentation Inspiration
This is a combo chart ppt powerpoint presentation inspiration. This is a eight stage process. The stages in this process are business, marketing, management, growth, timeline.

Pareto Chart Ppt PowerPoint Presentation Ideas
This is a pareto chart ppt powerpoint presentation ideas. This is a four stage process. The stages in this process are bar graph, finance, marketing, strategy, analysis, business.

Scatter Bubble Chart Ppt PowerPoint Presentation Slides
This is a scatter bubble chart ppt powerpoint presentation slides. This is a eight stage process. The stages in this process are in price, highest sale, business, management.

Line Chart Ppt PowerPoint Presentation Summary Portfolio
This is a line chart ppt powerpoint presentation summary portfolio. This is a eight stage process. The stages in this process are finance, planning, management, business, process, strategy.

Combo Chart Ppt PowerPoint Presentation Model Gallery
This is a combo chart ppt powerpoint presentation model gallery. This is a eight stage process. The stages in this process are business, marketing, management, growth, timeline.
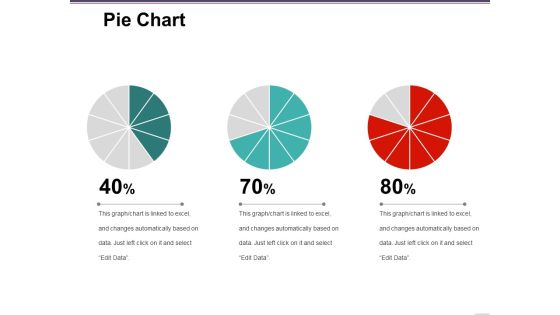
Pie Chart Ppt PowerPoint Presentation Layouts Good
This is a pie chart ppt powerpoint presentation layouts good. This is a three stage process. The stages in this process are finance, marketing, management, process, business.
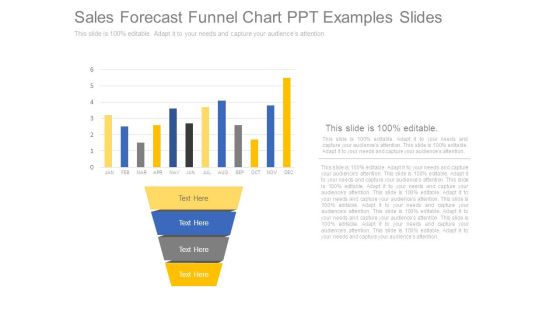
Sales Forecast Funnel Chart Ppt Examples Slides
This is a sales forecast funnel chart ppt examples slides. This is a four stage process. The stages in this process are jan, feb, mar, apr, may, jun, jul, aug, sep, oct, nov, dec.

Competitor Analysis Chart Ppt PowerPoint Presentation Visuals
This is a competitor analysis chart ppt powerpoint presentation visuals. This is a five stage process. The stages in this process are revenue, profit, market share, main activity, number of employee, product quality.
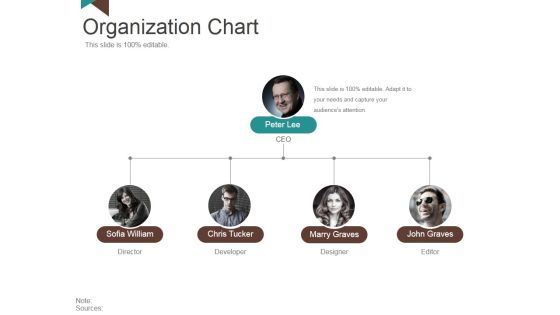
Organization Chart Ppt PowerPoint Presentation Styles Outfit
This is a organization chart ppt powerpoint presentation styles outfit. This is a four stage process. The stages in this process are peter lee, sofia william, chris tucker, marry graves, john graves.

Financial Planning And Examination Plan For Small And Large Enterprises Leverage Ratios To Measure The Debt Level Background PDF
The following slide outlines top 2 leverage ratios which will assist the in determining the debt level incurred by the organization. This slide provides information about debt to equity and interest coverage ratio of the company and its competitors for the period of last 3 years. Get a simple yet stunning designed Financial Planning And Examination Plan For Small And Large Enterprises Leverage Ratios To Measure The Debt Level Background PDF. It is the best one to establish the tone in your meetings. It is an excellent way to make your presentations highly effective. So, download this PPT today from Slidegeeks and see the positive impacts. Our easy to edit Financial Planning And Examination Plan For Small And Large Enterprises Leverage Ratios To Measure The Debt Level Background PDF can be your go to option for all upcoming conferences and meetings. So, what are you waiting for Grab this template today.

Monetary Planning And Evaluation Guide Leverage Ratios To Measure The Debt Level Ppt Infographics Show PDF
The following slide outlines top 2 leverage ratios which will assist the in determining the debt level incurred by the organization. This slide provides information about debt to equity and interest coverage ratio of the company and its competitors for the period of last 3 years. This modern and well-arranged Monetary Planning And Evaluation Guide Leverage Ratios To Measure The Debt Level Ppt Infographics Show PDF provides lots of creative possibilities. It is very simple to customize and edit with the Powerpoint Software. Just drag and drop your pictures into the shapes. All facets of this template can be edited with Powerpoint no extra software is necessary. Add your own material, put your images in the places assigned for them, adjust the colors, and then you can show your slides to the world, with an animated slide included.

Effective Financial Planning Assessment Techniques Leverage Ratios To Measure The Debt Level Sample PDF
The following slide outlines top 2 leverage ratios which will assist the in determining the debt level incurred by the organization. This slide provides information about debt to equity and interest coverage ratio of the company and its competitors for the period of last 3 years. This modern and well-arranged Effective Financial Planning Assessment Techniques Leverage Ratios To Measure The Debt Level Sample PDF provides lots of creative possibilities. It is very simple to customize and edit with the Powerpoint Software. Just drag and drop your pictures into the shapes. All facets of this template can be edited with Powerpoint no extra software is necessary. Add your own material, put your images in the places assigned for them, adjust the colors, and then you can show your slides to the world, with an animated slide included.

Overview Of Organizational Leverage Ratios To Measure The Debt Level Formats PDF
The following slide outlines top 2 leverage ratios which will assist the in determining the debt level incurred by the organization. This slide provides information about debt to equity and interest coverage ratio of the company and its competitors for the period of last 3 years. This modern and well-arranged Overview Of Organizational Leverage Ratios To Measure The Debt Level Formats PDF provides lots of creative possibilities. It is very simple to customize and edit with the Powerpoint Software. Just drag and drop your pictures into the shapes. All facets of this template can be edited with Powerpoint, no extra software is necessary. Add your own material, put your images in the places assigned for them, adjust the colors, and then you can show your slides to the world, with an animated slide included.
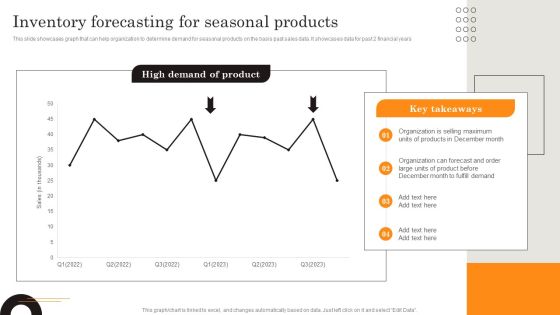
Procurement Strategies For Reducing Stock Wastage Inventory Forecasting For Seasonal Ideas PDF
This slide showcases graph that can help organization to determine demand for seasonal products on the basis past sales data. It showcases data for past 2 financial years. Do you have to make sure that everyone on your team knows about any specific topic I yes, then you should give Procurement Strategies For Reducing Stock Wastage Inventory Forecasting For Seasonal Ideas PDF a try. Our experts have put a lot of knowledge and effort into creating this impeccable Procurement Strategies For Reducing Stock Wastage Inventory Forecasting For Seasonal Ideas PDF. You can use this template for your upcoming presentations, as the slides are perfect to represent even the tiniest detail. You can download these templates from the Slidegeeks website and these are easy to edit. So grab these today.

Strategies To Order And Manage Ideal Inventory Levels Inventory Forecasting Elements PDF
This slide showcases graph that can help organization to determine demand for seasonal products on the basis past sales data. It showcases data for past 2 financial years. Do you have to make sure that everyone on your team knows about any specific topic I yes, then you should give Strategies To Order And Manage Ideal Inventory Levels Inventory Forecasting Elements PDF a try. Our experts have put a lot of knowledge and effort into creating this impeccable Strategies To Order And Manage Ideal Inventory Levels Inventory Forecasting Elements PDF. You can use this template for your upcoming presentations, as the slides are perfect to represent even the tiniest detail. You can download these templates from the Slidegeeks website and these are easy to edit. So grab these today.
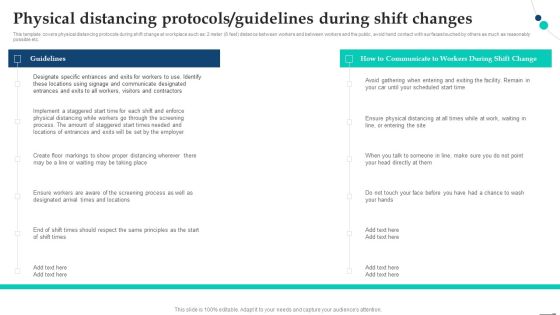
Physical Distancing Protocols Guidelines During Shift Changes Pandemic Company Playbook Diagrams PDF
This template covers physical distancing protocols during shift change at workplace such as 2 meter 6 feet distance between workers and between workers and the public, avoid hand contact with surfaces touched by others as much as reasonably possible etc. Formulating a presentation can take up a lot of effort and time, so the content and message should always be the primary focus. The visuals of the PowerPoint can enhance the presenters message, so our Physical Distancing Protocols Guidelines During Shift Changes Pandemic Company Playbook Diagrams PDF was created to help save time. Instead of worrying about the design, the presenter can concentrate on the message while our designers work on creating the ideal templates for whatever situation is needed. Slidegeeks has experts for everything from amazing designs to valuable content, we have put everything into Physical Distancing Protocols Guidelines During Shift Changes Pandemic Company Playbook Diagrams PDF.
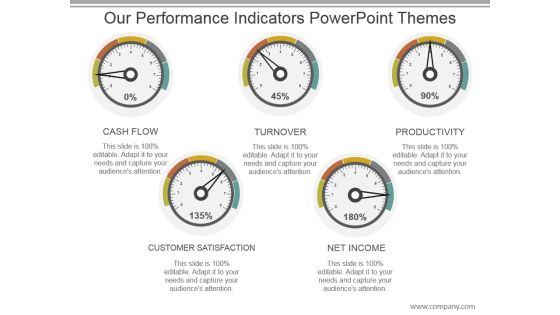
Our Performance Indicators Powerpoint Themes
This is a our performance indicators powerpoint themes. This is a five stage process. The stages in this process are cash flow, turnover, productivity, customer satisfaction, net income.
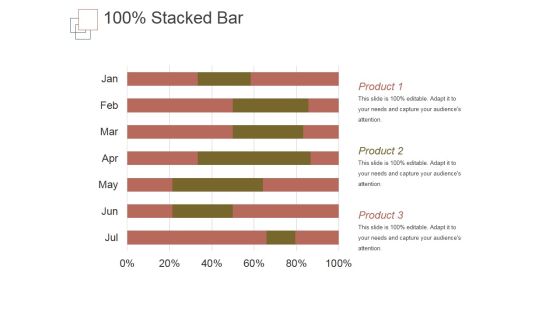
Stacked Bar Template 1 Ppt PowerPoint Presentation Themes
This is a stacked bar template 1 ppt powerpoint presentation themes. This is a six stage process. The stages in this process are product, business, marketing, success, management.
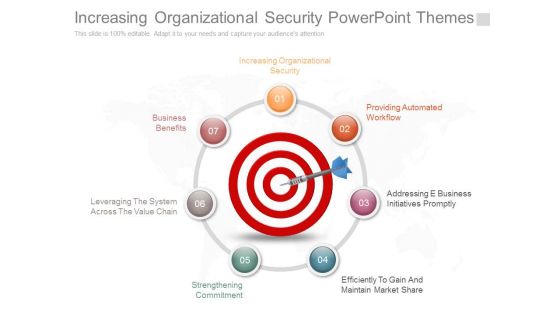
Increasing Organizational Security Powerpoint Themes
This is a increasing organizational security powerpoint themes. This is a seven stage process. The stages in this process are increasing organizational security, business benefits, leveraging the system across the value chain, strengthening commitment, providing automated workflow, addressing e business initiatives promptly, efficiently to gain and maintain market share.

Crm Dashboard Sales Dashboard Ppt PowerPoint Presentation Themes
This is a crm dashboard sales dashboard ppt powerpoint presentation themes. This is a four stage process. The stages in this process are month over month closing trend, lead owner breakdown, total lead ownership, sales by product march 2017.

Competitive Analysis Scatter Chart Radar Chart Ppt PowerPoint Presentation Portfolio Templates
This is a competitive analysis scatter chart radar chart ppt powerpoint presentation portfolio templates. This is a eight stage process. The stages in this process are users interface, data import, example, pricing, support.
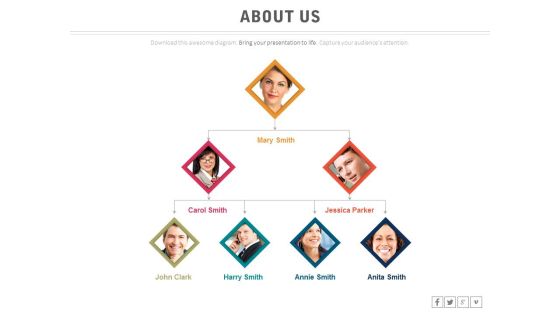
Team Network Diagram For Marketing Research Powerpoint Slides
Develop competitive advantage with our above template which contains team network diagram. This diagram may be used to display marketing research team. You can edit text, color, shade and style as per you need.
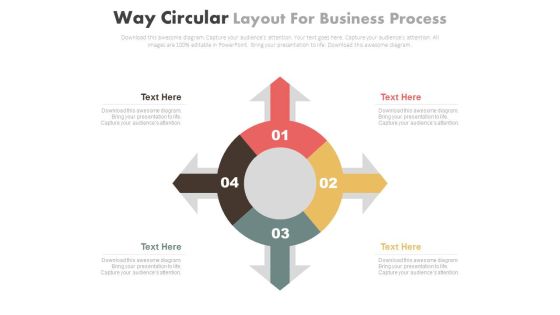
Four Arrows Circular Diagram For Business Process Powerpoint Slides
This PowerPoint template contains graphics of circular diagram. This PowerPoint template helps to conveys business processes in a visual manner. Download this PPT slide for quick decision-making.

Clustered Column-Line Ppt PowerPoint Presentation Ideas Diagrams
This is a clustered column-line ppt powerpoint presentation ideas diagrams. This is a three stage process. The stages in this process are clustered column line, business, finance, marketing, strategy.

Our Goal Ppt PowerPoint Presentation Diagrams
This is a our goal ppt powerpoint presentation diagrams. This is a six stage process. The stages in this process are business, strategy, marketing, target, icons, process.

Dollar Stacks Chart For Performance Attribution Powerpoint Slide Designs
This is a dollar stacks chart for performance attribution powerpoint slide designs. This is a four stage process. The stages in this process are step.
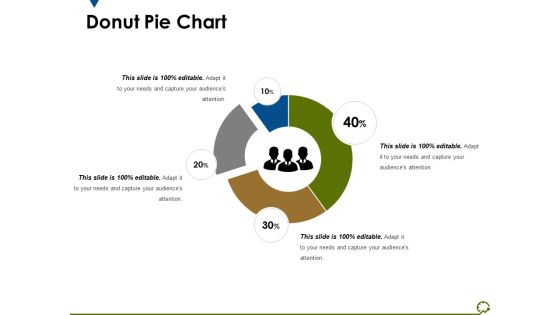
Donut Pie Chart Ppt PowerPoint Presentation Show Styles
This is a donut pie chart ppt powerpoint presentation show styles. This is a four stage process. The stages in this process are chart, business, process, management, percentage.

Portative Analysis Bubble Chart Ppt PowerPoint Presentation Slide
This is a portative analysis bubble chart ppt powerpoint presentation slide. This is a six stage process. The stages in this process are portative, analysis, business, graph, bubble chart.
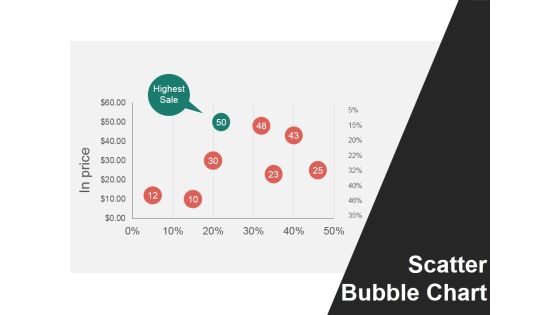
Scatter Bubble Chart Ppt PowerPoint Presentation Show Infographic Template
This is a scatter bubble chart ppt powerpoint presentation show infographic template. This is a six stage process. The stages in this process are in price, scatter bubble chart, highest sale.

Column Chart Ppt PowerPoint Presentation Ideas Designs Download
This is a column chart ppt powerpoint presentation ideas designs download. This is a six stage process. The stages in this process are business, strategy, analysis, planning, column chart, financial.

Line Chart Ppt PowerPoint Presentation Visual Aids Pictures
This is a line chart ppt powerpoint presentation visual aids pictures. This is a three stage process. The stages in this process are business, marketing, line chart, analysis, growth.

Bar Chart Ppt PowerPoint Presentation Slides Design Ideas
This is a bar chart ppt powerpoint presentation slides design ideas. This is a six stage process. The stages in this process are product, bar chart, sales in percentage.

Column Chart Ppt PowerPoint Presentation Infographic Template Graphics Tutorials
This is a column chart ppt powerpoint presentation infographic template graphics tutorials. This is a twelve stage process. The stages in this process are column chart, finance, marketing, strategy, investment, business.
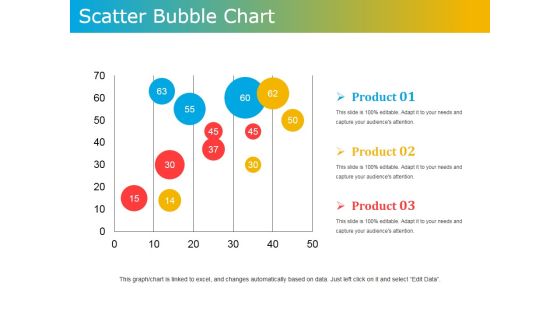
Scatter Bubble Chart Ppt PowerPoint Presentation Ideas Design Templates
This is a scatter bubble chart ppt powerpoint presentation ideas design templates. This is a three stage process. The stages in this process are product, scatter, bubble chart, business, marketing.
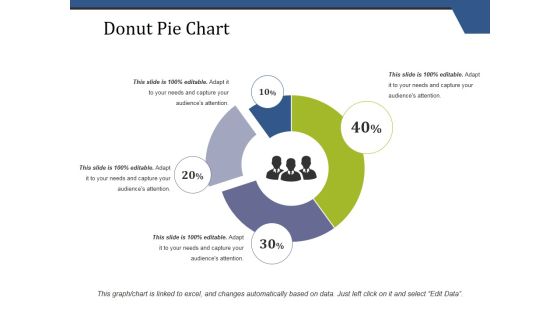
Donut Pie Chart Ppt PowerPoint Presentation Portfolio Clipart Images
This is a donut pie chart ppt powerpoint presentation portfolio clipart images. This is a four stage process. The stages in this process are donut pie chart, finance, marketing, strategy, business.
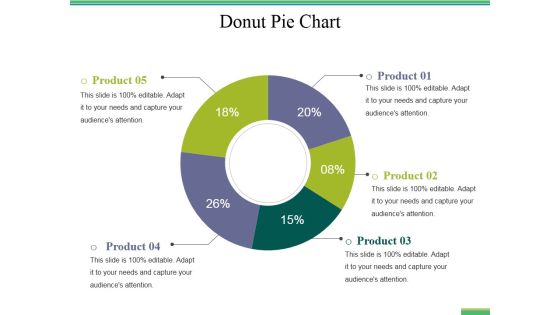
Donut Pie Chart Ppt PowerPoint Presentation Professional Files
This is a donut pie chart ppt powerpoint presentation professional files. This is a five stage process. The stages in this process are donut pie chart, finance, marketing, investment, analysis, business.

Donut Pie Chart Ppt PowerPoint Presentation Professional Format Ideas
This is a donut pie chart ppt powerpoint presentation professional format ideas. This is a three stage process. The stages in this process are donut pie chart, marketing, strategy, analysis, business.

donut pie chart ppt powerpoint presentation file skills
This is a donut pie chart ppt powerpoint presentation file skills. This is a five stage process. The stages in this process are donut pie chart, finance, marketing, strategy, business.
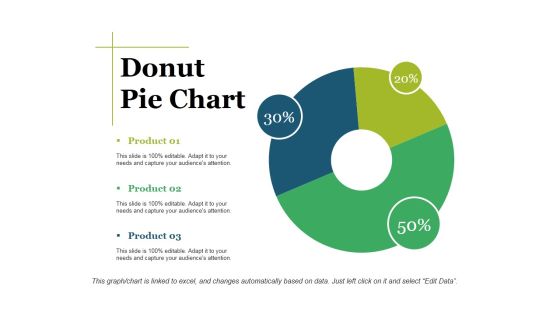
Donut Pie Chart Ppt PowerPoint Presentation Show Graphic Tips
This is a donut pie chart ppt powerpoint presentation show graphic tips. This is a three stage process. The stages in this process are donut pie chart, finance, marketing, strategy, analysis, business.

Pie Chart Ppt PowerPoint Presentation Infographic Template Graphics Example
This is a pie chart ppt powerpoint presentation infographic template graphics example. This is a four stage process. The stages in this process are pie chart, finance, marketing, strategy, business.
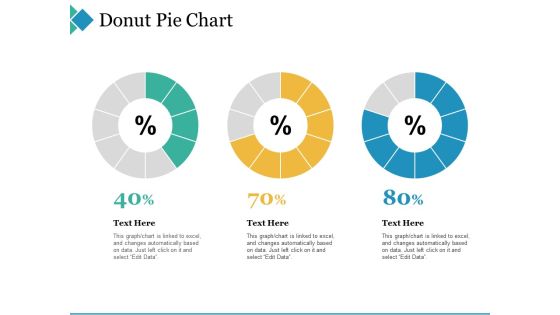
Donut Pie Chart Ppt PowerPoint Presentation Infographic Template Example 2015
This is a donut pie chart ppt powerpoint presentation infographic template example 2015. This is a three stage process. The stages in this process are donut pie chart, finance, marketing, strategy, business.

Donut Pie Chart Ppt PowerPoint Presentation Portfolio Example Topics
This is a donut pie chart ppt powerpoint presentation portfolio example topics. This is a four stage process. The stages in this process are donut pie chart, strategy, business, marketing, finance.
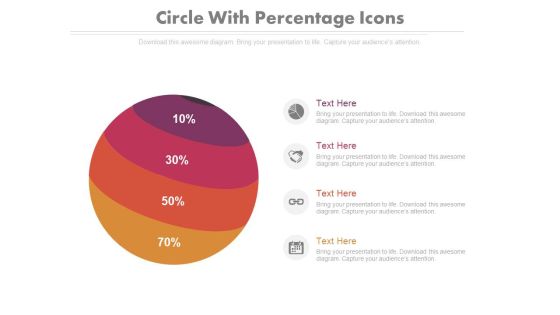
Four Parts Circle Chart With Percentage Ratio Powerpoint Slides
This PowerPoint template contains four parts circle chart with percentage ratio. You may download this PPT slide design to display your ideas in visual manner. You can easily customize this template to make it more unique as per your need.

5 Cylinders Column Chart For Market Growth Ppt PowerPoint Presentation Outline
This is a 5 cylinders column chart for market growth ppt powerpoint presentation outline. This is a five stage process. The stages in this process are business, marketing, icons, growth, finance.

Volume High Low Close Chart Ppt PowerPoint Presentation Show
This is a volume high low close chart ppt powerpoint presentation show. This is a five stage process. The stages in this process are high, volume, low.

Combo Chart Template 1 Ppt PowerPoint Presentation Inspiration
This is a combo chart template 1 ppt powerpoint presentation inspiration. This is a four stage process. The stages in this process are business, marketing, growth, product, finance.

Stock Chart Ppt PowerPoint Presentation Inspiration Graphics Design
This is a stock chart ppt powerpoint presentation inspiration graphics design. This is a five stage process. The stages in this process are high, volume, low.
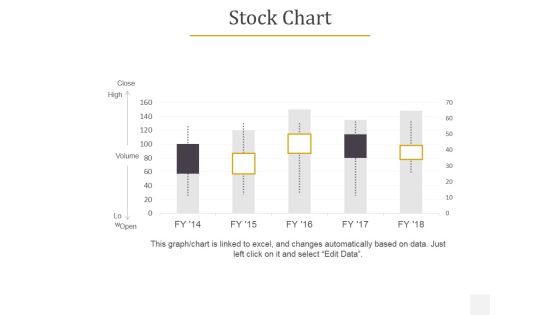
Stock Chart Ppt PowerPoint Presentation Visual Aids Summary
This is a stock chart ppt powerpoint presentation visual aids summary. This is a five stage process. The stages in this process are close, high, volume, open.

 Home
Home