2 Lists
Stock Chart Ppt PowerPoint Presentation Icon Graphic Images
This is a stock chart ppt powerpoint presentation icon graphic images. This is a five stage process. The stages in this process are high, volume, low, close.

Bar Chart Ppt PowerPoint Presentation Infographic Template Example
This is a bar chart ppt powerpoint presentation infographic template example. This is a seven stage process. The stages in this process are business, finance, marketing, percentage.
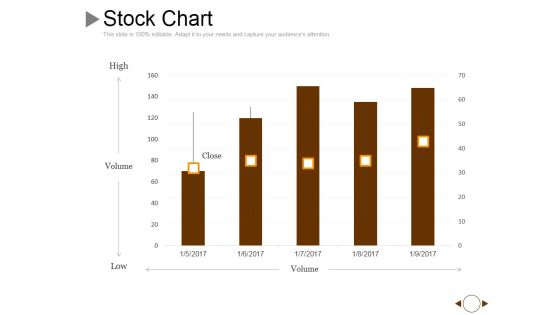
Stock Chart Ppt PowerPoint Presentation Gallery Graphics Example
This is a stock chart ppt powerpoint presentation gallery graphics example. This is a five stage process. The stages in this process are volume, high, low, close.
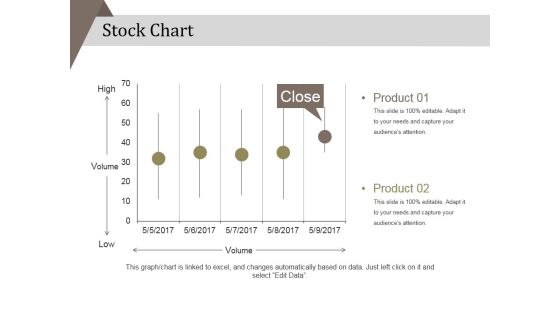
Stock Chart Ppt PowerPoint Presentation Portfolio Background Designs
This is a stock chart ppt powerpoint presentation portfolio background designs. This is a five stage process. The stages in this process are product, high, low .

Doughnut Chart Ppt PowerPoint Presentation Visual Aids Files
This is a doughnut chart ppt powerpoint presentation visual aids files. This is a three stage process. The stages in this process are finance, donut, percentage, business, marketing.

High Low Close Chart Ppt PowerPoint Presentation Infographics Templates
This is a high low close chart ppt powerpoint presentation infographics templates. This is a nine stage process. The stages in this process are high, volume, low, close.
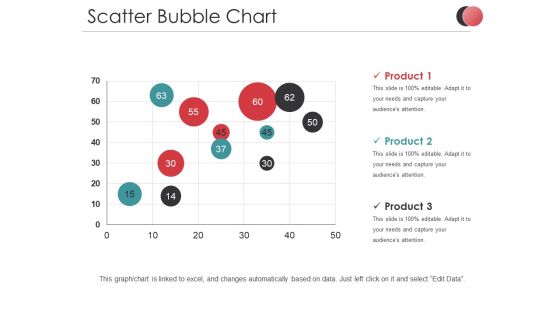
Scatter Bubble Chart Ppt PowerPoint Presentation Infographic Template Diagrams
This is a scatter bubble chart ppt powerpoint presentation infographic template diagrams. This is a three stage process. The stages in this process are product, business, marketing, finance.

Donut Pie Chart Ppt PowerPoint Presentation Show Topics
This is a donut pie chart ppt powerpoint presentation show topics. This is a three stage process. The stages in this process are percentage, finance, donut, business.

Combo Chart Ppt PowerPoint Presentation Infographic Template Maker
This is a combo chart ppt powerpoint presentation infographic template maker. This is a three stage process. The stages in this process are business, finance, growth, investment, marketing.

Area Chart Product Finance Ppt PowerPoint Presentation Guide
This is a area chart product finance ppt powerpoint presentation guide. This is a four stage process. The stages in this process are business, management, financial, marketing, sales.
Scatter Chart Ppt PowerPoint Presentation Icon Background Images
This is a scatter chart ppt powerpoint presentation icon background images. This is a one stage process. The stages in this process are percentage, product, business, marketing, management.

Clustered Column Chart Ppt PowerPoint Presentation Ideas Picture
This is a clustered column chart ppt powerpoint presentation ideas picture. This is a three stage process. The stages in this process are percentage, product, management, marketing.

Area Chart Finance Ppt PowerPoint Presentation Infographics Deck
This is a area chart finance ppt powerpoint presentation infographics deck. This is a three stage process. The stages in this process are finance, marketing, management, investment, analysis.

Combo Chart Finance Ppt PowerPoint Presentation Styles Example
This is a combo chart finance ppt powerpoint presentation styles example. This is a three stage process. The stages in this process are finance, marketing, management, investment, analysis.

area chart finance ppt powerpoint presentation pictures format
This is a area chart finance ppt powerpoint presentation pictures format. This is a three stage process. The stages in this process are finance, marketing, management, investment, analysis.
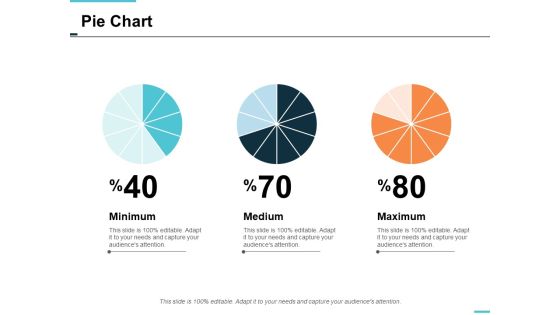
pie chart finance ppt powerpoint presentation styles skills
This is a pie chart finance ppt powerpoint presentation styles skills. This is a three stage process. The stages in this process are finance, marketing, management, investment, analysis.

Stacked Column Chart Ppt PowerPoint Presentation Professional Diagrams
This is a stacked column chart ppt powerpoint presentation professional diagrams. This is a three stage process. The stages in this process are percentage, product, management, marketing.

Clustered Chart Finance Ppt PowerPoint Presentation Summary Guide
This is a clustered chart finance ppt powerpoint presentation summary guide. This is a three stage process. The stages in this process are finance, marketing, management, investment, analysis.

Combo Chart Finance Ppt PowerPoint Presentation Portfolio Guidelines
This is a combo chart finance ppt powerpoint presentation portfolio guidelines. This is a three stage process. The stages in this process are finance, marketing, management, investment, analysis.

Stacked Column Chart Ppt PowerPoint Presentation Slides Files
This is a stacked column chart ppt powerpoint presentation slides files. This is a three stage process. The stages in this process are percentage, product, business, marketing.

Area Chart Contribution Ppt PowerPoint Presentation Gallery Structure
This is a area chart contribution ppt powerpoint presentation gallery structure. This is a three stage process. The stages in this process are business, management, strategy, analysis, marketing.

Donut Chart Management Ppt Powerpoint Presentation Slides Aids
This is a donut chart management ppt powerpoint presentation slides aids. This is a six stage process. The stages in this process are finance, marketing, management, investment, analysis.

Column Chart Finance Ppt Powerpoint Presentation Summary Visuals
This is a column chart finance ppt powerpoint presentation summary visuals. This is a four stage process. The stages in this process are finance, marketing, management, investment, analysis.

area chart finance ppt powerpoint presentation layouts ideas
This is a area chart finance ppt powerpoint presentation layouts ideas. This is a three stage process. The stages in this process are finance, marketing, management, investment, analysis.
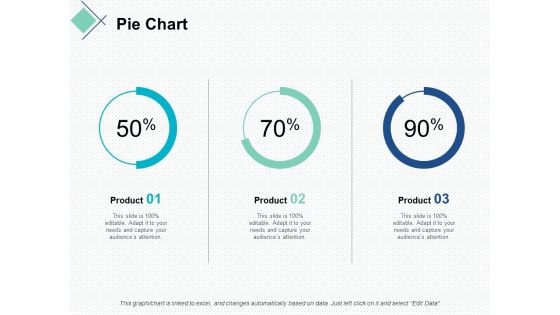
pie chart finance marketing ppt powerpoint presentation slides demonstration
This is a pie chart finance marketing ppt powerpoint presentation slides demonstration. This is a stage process. The stages in this process are finance, marketing, management, investment, analysis.

Column Chart Marketing Ppt Powerpoint Presentation Icon Diagrams
This is a column chart marketing ppt powerpoint presentation icon diagrams. This is a three stage process. The stages in this process are finance, marketing, management, investment, analysis.

Stock Chart Graph Ppt PowerPoint Presentation Ideas Demonstration
This is a stock chart graph ppt powerpoint presentation ideas demonstration. This is a three stage process. The stages in this process are finance, marketing, management, investment, analysis.
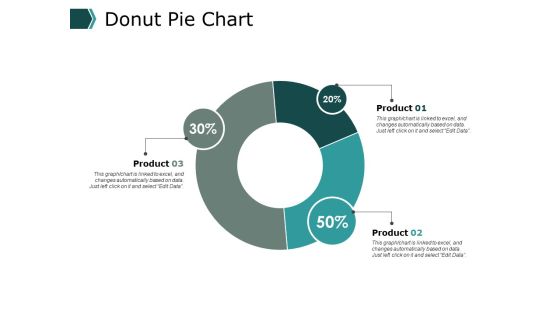
Donut Pie Chart Ppt PowerPoint Presentation Model Deck
This is a donut pie chart ppt powerpoint presentation model deck. This is a three stage process. The stages in this process are finance, marketing, management, investment, analysis.
Project Management Gantt Chart Graph Ppt PowerPoint Presentation Styles Icon
This is a project management gantt chart graph ppt powerpoint presentation styles icon. This is a four stage process. The stages in this process are four.

Combo Chart Graph Ppt PowerPoint Presentation Inspiration Template
This is a combo chart graph ppt powerpoint presentation inspiration template. This is a three stage process. The stages in this process are finance, marketing, management, investment, analysis.

Column Chart Finance Ppt PowerPoint Presentation Summary Grid
This is a column chart finance ppt powerpoint presentation summary grid. This is a three stage process. The stages in this process are finance, marketing, management, investment, analysis.

Pie Chart Finance Ppt PowerPoint Presentation Ideas Templates
This is a pie chart finance ppt powerpoint presentation ideas templates. This is a three stage process. The stages in this process are finance, marketing, management, investment, analysis.
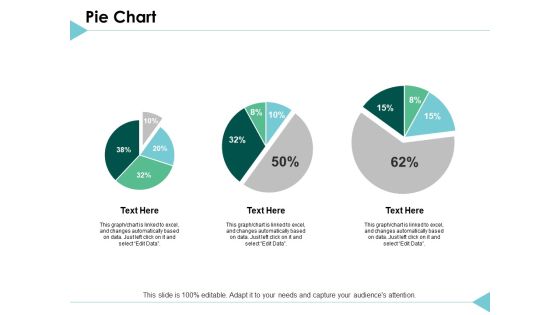
Pie Chart Finance Ppt PowerPoint Presentation Styles Templates
This is a pie chart finance ppt powerpoint presentation styles templates. This is a three stage process. The stages in this process are finance, marketing, analysis, investment, million.

Clustered Chart Graph Ppt PowerPoint Presentation Gallery Backgrounds
This is a clustered chart graph ppt powerpoint presentation gallery backgrounds. This is a three stage process. The stages in this process are finance, marketing, analysis, investment, million.

Column Chart Graph Ppt PowerPoint Presentation Slides File Formats
This is a combo chart bar ppt powerpoint presentation slides portfolio. This is a three stage process. The stages in this process are finance, marketing, analysis, investment, million.

Area Chart Finance Ppt PowerPoint Presentation Gallery Information
This is a area chart finance ppt powerpoint presentation gallery information. This is a three stage process. The stages in this process are finance, marketing, analysis, investment, million.

Combo Chart Graph Ppt PowerPoint Presentation Professional Guidelines
This is a combo chart graph ppt powerpoint presentation professional guidelines. This is a three stage process. The stages in this process are finance, marketing, analysis, investment, million.

Pie Chart Bar Ppt PowerPoint Presentation Layouts Examples
This is a pie chart bar ppt powerpoint presentation layouts examples. This is a three stage process. The stages in this process are finance, marketing, analysis, investment, million.

Pie Chart Finance Ppt Powerpoint Presentation Gallery Templates
This is a pie chart finance ppt powerpoint presentation gallery templates. This is a four stage process. The stages in this process are finance, marketing, management, investment, analysis.

Combo Chart Finance Ppt Powerpoint Presentation Ideas Slides
This is a combo chart finance ppt powerpoint presentation ideas slides. This is a three stage process. The stages in this process are finance, marketing, management, investment, analysis.
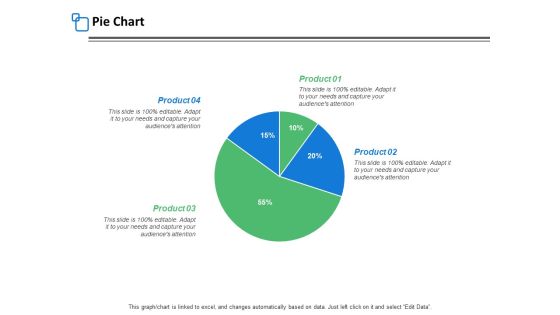
Pie Chart Finance Ppt PowerPoint Presentation Inspiration Templates
This is a pie chart finance ppt powerpoint presentation inspiration templates. This is a four stage process. The stages in this process are finance, marketing, management, investment, analysis.
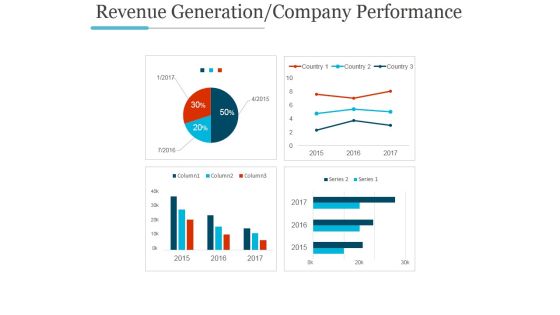
Revenue Generation Company Performance Ppt PowerPoint Presentation Inspiration
This is a revenue generation company performance ppt powerpoint presentation inspiration. This is a four stage process. The stages in this process are graph, growth, success, business, marketing.

Hr Dashboard Template Ppt PowerPoint Presentation Deck
This is a hr dashboard template ppt powerpoint presentation deck. This is a four stage process. The stages in this process are turnover rate, headcount flow, headcount, staffing trends.

Hr Dashboard Ppt PowerPoint Presentation Shapes
This is a hr dashboard ppt powerpoint presentation shapes. This is a four stage process. The stages in this process are total employees, key metrics, employee churn, open positions by divisions.
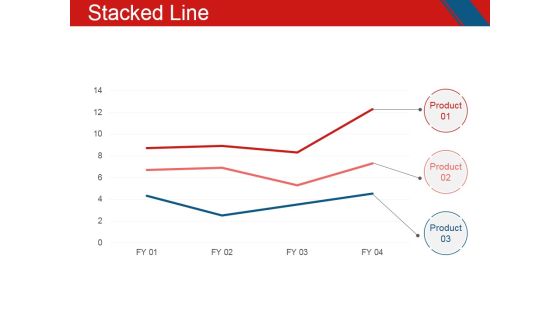
Stacked Line Ppt PowerPoint Presentation Styles Graphic Images
This is a stacked line ppt powerpoint presentation styles graphic images. This is a three stage process. The stages in this process are business, marketing, finance, stacked line, management.
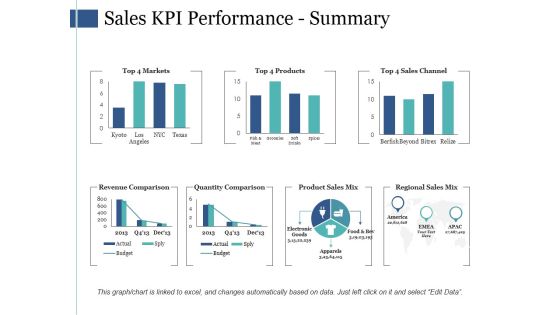
Sales Kpi Performance Summary Ppt PowerPoint Presentation Infographic Template Infographics
This is a sales kpi performance summary ppt powerpoint presentation infographic template infographics. This is a seven stage process. The stages in this process are revenue comparison, quantity comparison, product sales mix, regional sales mix.
Sales Kpi Tracker Ppt PowerPoint Presentation Visual Aids Files
This is a sales kpi tracker ppt powerpoint presentation visual aids files. This is a six stage process. The stages in this process are leads created, sales ratio, opportunities won, top products in revenue, open deals vs last yr.

Sales Revenue Product Ppt PowerPoint Presentation Infographic Template Backgrounds
This is a sales revenue product ppt powerpoint presentation infographic template backgrounds. This is a three stage process. The stages in this process are product wise revenue, profit percent of total revenue, total income product.
Executive Summary Ppt PowerPoint Presentation Icon Visuals
This is a executive summary ppt powerpoint presentation icon visuals. This is a four stage process. The stages in this process are finance, marketing, management, investment, analysis.
Mckinsey 7S Strategy Model For Project Management News Paper Formats PDF
Presenting mckinsey 7s strategy model for project management news paper formats pdf to provide visual cues and insights. Share and navigate important information on one stage that need your due attention. This template can be used to pitch topics like news paper. In addtion, this PPT design contains high resolution images, graphics, etc, that are easily editable and available for immediate download.
Job Profile In Curriculum Vitae Icon Ppt PowerPoint Presentation Professional Microsoft
Presenting this set of slides with name job profile in curriculum vitae icon ppt powerpoint presentation professional microsoft. This is a one stage process. The stages in this process are role description icon, role description steps, corporate relationship. This is a completely editable PowerPoint presentation and is available for immediate download. Download now and impress your audience.
Variables Correlation Scatter Chart Ppt PowerPoint Presentation Model Smartart PDF
Presenting variables correlation scatter chart ppt powerpoint presentation model smartart pdf to dispense important information. This template comprises three stages. It also presents valuable insights into the topics including variables correlation scatter chart. This is a completely customizable PowerPoint theme that can be put to use immediately. So, download it and address the topic impactfully.

Charts Representing Business Data Analysis Icon Introduction PDF
Presenting charts representing business data analysis icon introduction pdf. to dispense important information. This template comprises three stages. It also presents valuable insights into the topics including charts representing business data analysis icon. This is a completely customizable PowerPoint theme that can be put to use immediately. So, download it and address the topic impactfully.

Business Objective Presentation Chart Of Provenance Data Download PDF
Presenting business objective presentation chart of provenance data download pdf to dispense important information. This template comprises five stages. It also presents valuable insights into the topics including business objective presentation chart of provenance data. This is a completely customizable PowerPoint theme that can be put to use immediately. So, download it and address the topic impactfully.

Statistical Data Analysis Chart Of Collected Data Formats PDF
Presenting statistical data analysis chart of collected data formats pdf to dispense important information. This template comprises four stages. It also presents valuable insights into the topics including statistical data analysis chart of collected data. This is a completely customizable PowerPoint theme that can be put to use immediately. So, download it and address the topic impactfully.

Bar Chart Icon For Financial Ratios Comparison Elements PDF
Presenting bar chart icon for financial ratios comparison elements pdf to dispense important information. This template comprises four stages. It also presents valuable insights into the topics including bar chart icon for financial ratios comparison. This is a completely customizable PowerPoint theme that can be put to use immediately. So, download it and address the topic impactfully.

Chart Comparison Icon For Financial Ratios Template PDF
Persuade your audience using this chart comparison icon for financial ratios template pdf. This PPT design covers three stages, thus making it a great tool to use. It also caters to a variety of topics including chart comparison icon for financial ratios. Download this PPT design now to present a convincing pitch that not only emphasizes the topic but also showcases your presentation skills.

Chart Icon For Price To Earning Financial Ratios Professional PDF
Presenting chart icon for price to earning financial ratios professional pdf to dispense important information. This template comprises four stages. It also presents valuable insights into the topics including chart icon for price to earning financial ratios. This is a completely customizable PowerPoint theme that can be put to use immediately. So, download it and address the topic impactfully.
Price Catalogue Chart Icon Of Product Comparison Slides PDF
Presenting price catalogue chart icon of product comparison slides pdf to dispense important information. This template comprises three stages. It also presents valuable insights into the topics including price catalogue chart icon of product comparison. This is a completely customizable PowerPoint theme that can be put to use immediately. So, download it and address the topic impactfully.

Company Vulnerability Administration Need For Vulnerability Management Introduction PDF
Presenting company vulnerability administration need for vulnerability management introduction pdf to provide visual cues and insights. Share and navigate important information on three stages that need your due attention. This template can be used to pitch topics like detective controls, responsive controls, vulnerability management is a standard process, implementing a vulnerability management program. In addtion, this PPT design contains high resolution images, graphics, etc, that are easily editable and available for immediate download.
 Home
Home