2 Lists

Consulting Diagram Dashboard Business Information Chart Business Diagram
Get The Domestics Right With Our Consulting Diagram Dashboard Business Information Chart Business Diagram Powerpoint Templates. Create The Base For Thoughts To Grow.
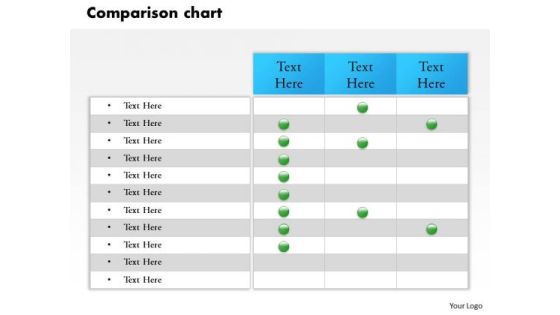
Business Cycle Diagram Product Description And Comparison Chart Sales Diagram
Document Your Views On Our Business Cycle Diagram Product Description And Comparison Chart Sales Diagram Powerpoint Templates. They Will Create A Strong Impression.

Business Framework Model Comparison Chart Of Business Product Business Diagram
Put In A Dollop Of Our Business Framework Model Comparison Chart Of Business Product Business Diagram Powerpoint Templates. Give Your Thoughts A Distinctive Flavor.

Business Framework Model Product Comparison Business Chart Marketing Diagram
Doll Up Your Thoughts With Our Business Framework Model Product Comparison Business Chart Marketing Diagram Powerpoint Templates. They Will Make A Pretty Picture.

Consulting Diagram Comparison Chart For Effective Reports Business Cycle Diagram
Establish The Dominance Of Your Ideas. Our Consulting Diagram Comparison Chart For Effective Reports Business Cycle Diagram Powerpoint Templates Will Put Them On Top.
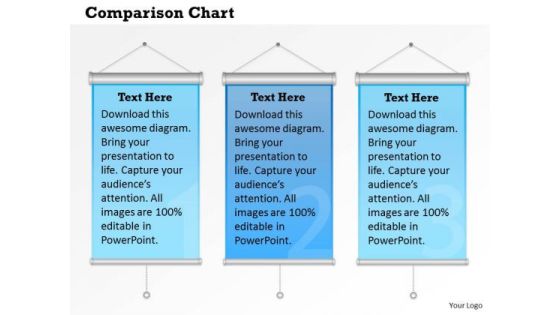
Strategic Management Comparison Chart Business Design Sales Diagram
Open Up Doors That Lead To Success. Our Strategic Management Comparison Chart Business Design Sales Diagram Powerpoint Templates Provide The Handles.
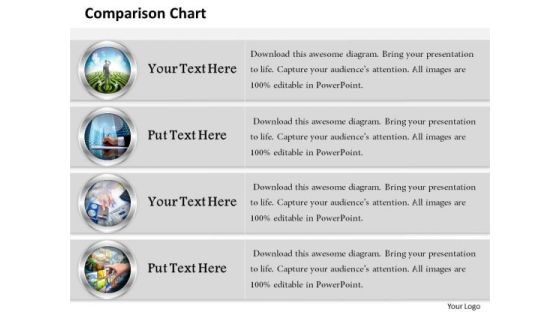
Strategic Management Comparison Chart With Pictures Business Diagram
Deliver The Right Dose With Our Strategic Management Comparison Chart With Pictures Business Diagram Powerpoint Templates. Your Ideas Will Get The Correct Illumination.
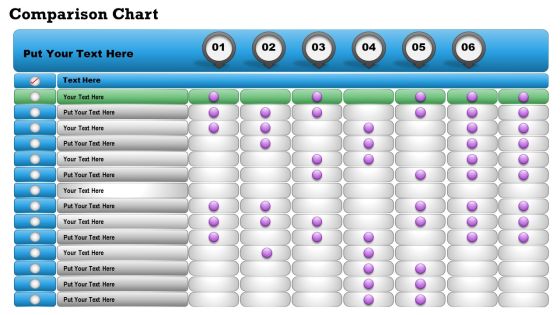
Strategy Diagram Comparison Chart For Business Data Consulting Diagram
Double Up Our Strategy Diagram Comparison Chart For Business Data Consulting Diagram Powerpoint Templates With Your Thoughts. They Will Make An Awesome Pair.
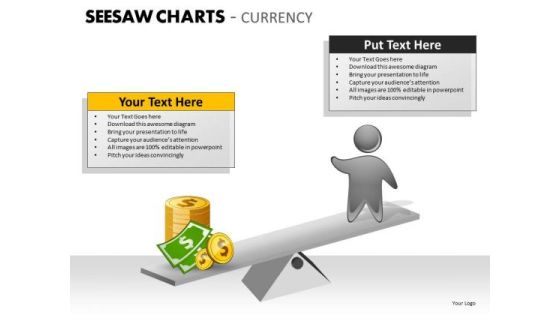
Business Cycle Diagram Seesaw Charts Currency Consulting Diagram
Get Out Of The Dock With Our Business Cycle Diagram Seesaw Charts Currency Consulting Diagram Powerpoint Templates. Your Mind Will Be Set Free.
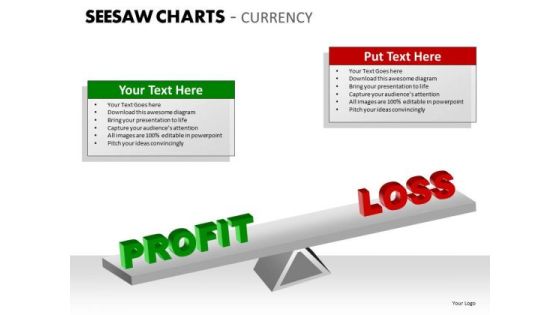
Business Framework Model Seesaw Charts Currency Strategy Diagram
Put In A Dollop Of Our Business Framework Model Seesaw Charts Currency Strategy Diagram Powerpoint Templates. Give Your Thoughts A Distinctive Flavor.
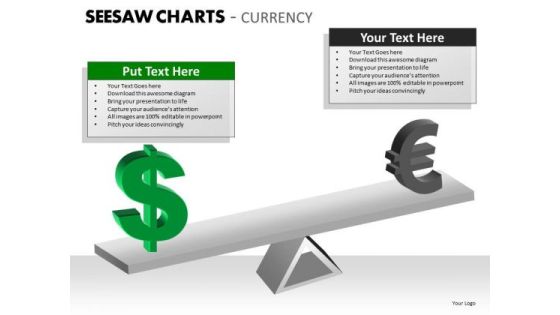
Mba Models And Frameworks Seesaw Charts Currency Business Diagram
Your Listeners Will Never Doodle. Our MBA Models And Frameworks Seesaw Charts Currency Business Diagram Powerpoint Templates Will Hold Their Concentration.
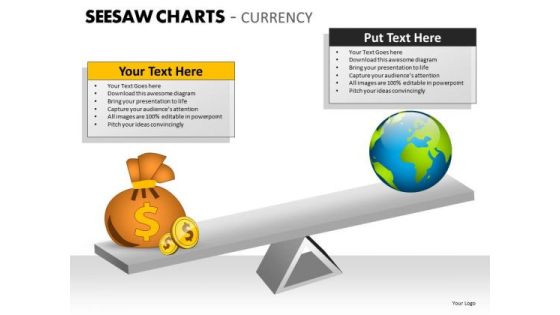
Mba Models And Frameworks Seesaw Charts Currency Marketing Diagram
Be A Donor Of Great Ideas. Display Your Charity On Our MBA Models And Frameworks Seesaw Charts Currency Marketing Diagram Powerpoint Templates.
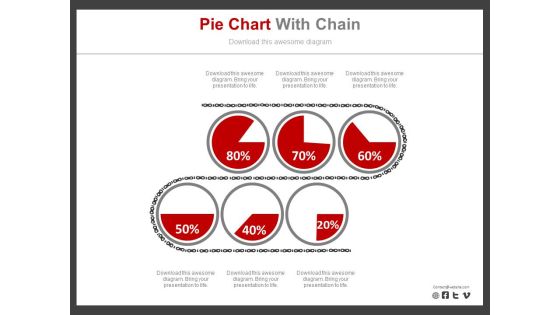
Six Pie Charts For Revenue Analysis Report Powerpoint Slides
Six pie charts have been displayed in this business slide. This business diagram helps to exhibit revenue analysis report. Download this PowerPoint template to build an exclusive presentation.

Stock Chart Ppt PowerPoint Presentation Gallery Graphic Images
This is a stock chart ppt powerpoint presentation gallery graphic images. This is a five stage process. The stages in this process are close, high, volume, low, open.
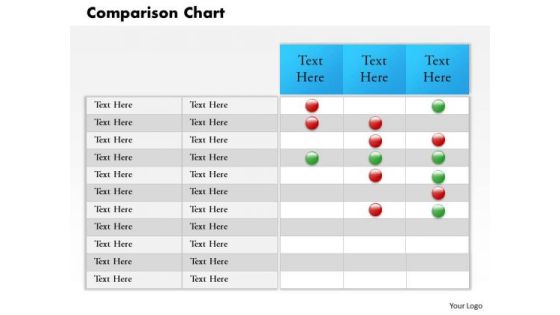
Business Framework Model Comparison Chart And Business Report Strategy Diagram
Analyze Ailments On Our Business Framework Model Comparison Chart And Business Report Strategy Diagram Powerpoint Templates. Bring Out The Thinking Doctor In You. Dock Your Thoughts With Our Business Framework Model Comparison Chart And Business Report Strategy Diagram Powerpoint Templates. They Will Launch Them Into Orbit.

Business Cycle Diagram Data Driven Comparison Chart Business Diagram
Analyze Ailments On Our Business Cycle Diagram Data Driven Comparison Chart Business Diagram Powerpoint Templates. Bring Out The Thinking Doctor In You. Dock Your Thoughts With Our Business Cycle Diagram Data Driven Comparison Chart Business Diagram Powerpoint Templates. They Will Launch Them Into Orbit.

Mba Models And Frameworks Business Financial Chart Diagram Sales Diagram
Open Up Doors That Lead To Success. Our MBA Models And Frameworks Business Financial Chart Diagram Sales Diagram Powerpoint Templates Provide The Handles. Opportunity Will Come Knocking At Your Door. Welcome It With Our MBA Models And Frameworks Business Financial Chart Diagram Sales Diagram Powerpoint Templates.
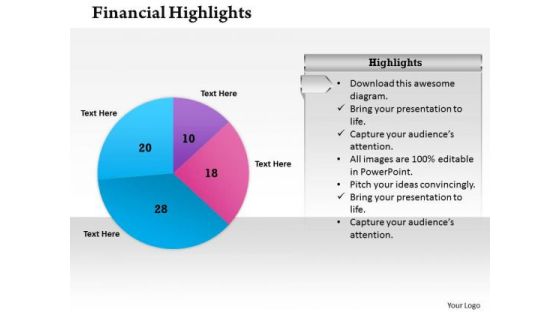
Sales Diagram Pie Chart For Financial Result Business Diagram
Knock On The Door To Success With Our Sales Diagram Pie Chart For Financial Result Business Diagram Powerpoint Templates. Be Assured Of Gaining Entry. Give Them A Dose Of Your Ability. It Will Go Down Well With Our Sales Diagram Pie Chart For Financial Result Business Diagram Powerpoint Templates.
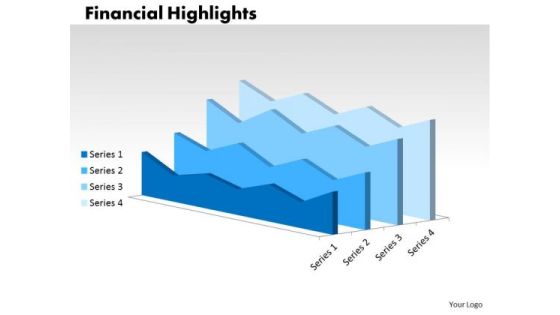
Strategy Diagram Growth Analysis Chart Diagram Consulting Diagram
Double Up Our Strategy Diagram Growth Analysis Chart Diagram Consulting Diagram Powerpoint Templates With Your Thoughts. They Will Make An Awesome Pair. When In Doubt Use Our Strategy Diagram Growth Analysis Chart Diagram Consulting Diagram Powerpoint Templates. The Way Ahead Will Become Crystal Clear.

Pie Charts For Financial Ratio Analysis Powerpoint Slides
This PowerPoint template has been designed with diagram of pie charts. This PPT slide can be used to prepare presentations for profit growth report and also for financial data analysis. You can download finance PowerPoint template to prepare awesome presentations.
Mountain Chart With Social Media Icons Powerpoint Slides
The above PPT template displays mountain chart with social media icons. This PowerPoint template has been designed to exhibit users of social media. Download this PPT slide to attract the attention of your audience.

Pie Chart For Financial Ratio Analysis Powerpoint Slides
This PPT slide contains graphics of eight stage pie chart. Download this PowerPoint template slide for financial ratio analysis. This diagram is editable you can edit text, color, shade and style as per you need.
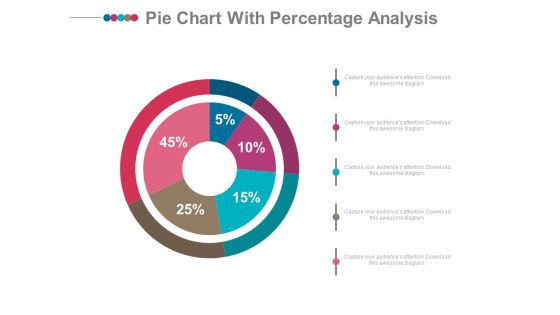
Pie Chart With Financial Data Comparison Powerpoint Slides
Emphatically define your message with our above template which contains graphics of pie chart. This PowerPoint template may be used to display financial data comparison. Grab the attention of your listeners with this slide.
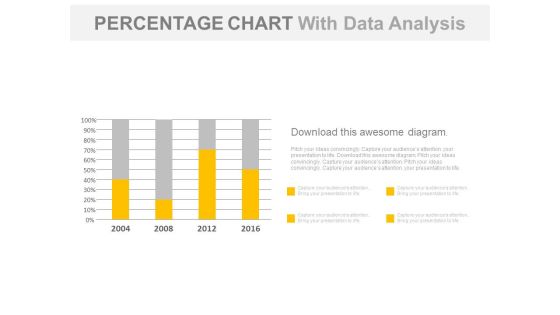
Year Based Chart With Percentage Data Analysis Powerpoint Slides
Our above business slide contains year based statistical chart. This PowerPoint template can be used to display percentage data analysis. Capture the attention of your audience with this slide.
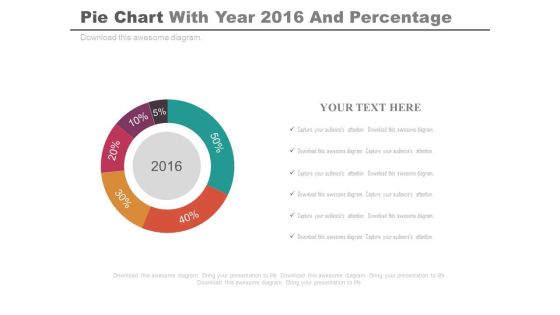
Pie Chart For Projected Profit Of 2016 Powerpoint Slides
Our above PPT slide displays graphics of Pie chart. This PowerPoint template may be used to display projected profit report of 2016. Download this template to leave permanent impression on your audience.

Circle Chart With Man And Woman Ratio Comparison Powerpoint Slides
This PowerPoint template has been designed with graphics of circle chart. You may download this PPT slide to depict man and woman ratio analysis. Add this slide to your presentation and impress your superiors.
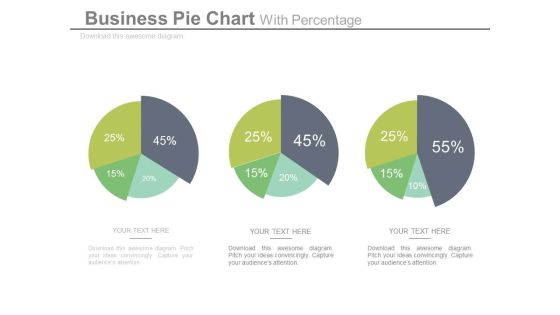
Pie Charts For Relative Comparison Study Powerpoint Slides
This power point template illustrates diagram of three pie charts with percentage values. This business slide can be used for relative comparison study. Present your views and ideas with this impressive slide.
Market Trends Chart With Percentage And Icons Powerpoint Slides
This PowerPoint template has been designed with graphics of chart with percentage values and icons. This PowerPoint template may be used to market trends and financial analysis. Prove the viability of your ideas using this impressive slide.

Break Point Chart For Quality Analysis Powerpoint Slide Show
This is a break point chart for quality analysis powerpoint slide show. This is a one stage process. The stages in this process are total variable costs, fixed costs, quality sold.
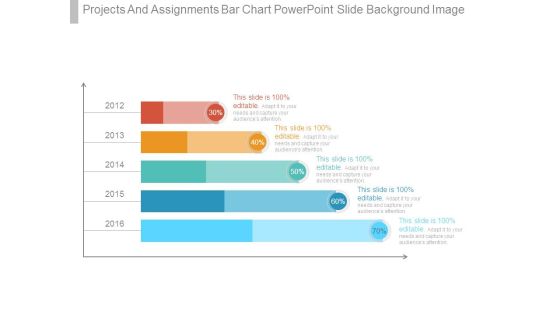
Projects And Assignments Bar Chart Powerpoint Slide Background Image
This is a projects and assignments bar chart powerpoint slide background image. This is a five stage process. The stages in this process are finance, presentation, business, strategy, marketing.

Volume High Low Close Chart Ppt PowerPoint Presentation Gallery Shapes
This is a volume high low close chart ppt powerpoint presentation gallery shapes. This is a five stage process. The stages in this process are high, volume, low, close, finance.
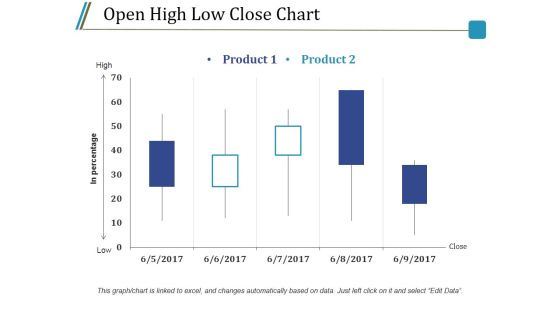
Open High Low Close Chart Ppt PowerPoint Presentation Styles Model
This is a open high low close chart ppt powerpoint presentation styles model. This is a five stage process. The stages in this process are product, high, low, in percentage, close.

Open High Low Close Chart Ppt PowerPoint Presentation Professional Inspiration
This is a open high low close chart ppt powerpoint presentation professional inspiration. This is a five stage process. The stages in this process are high, low, close, business, finance.

Donut Pie Chart Ppt PowerPoint Presentation Show Graphics Download
This is a donut pie chart ppt powerpoint presentation show graphics download. This is a three stage process. The stages in this process are percentage, finance, donut, business, marketing.
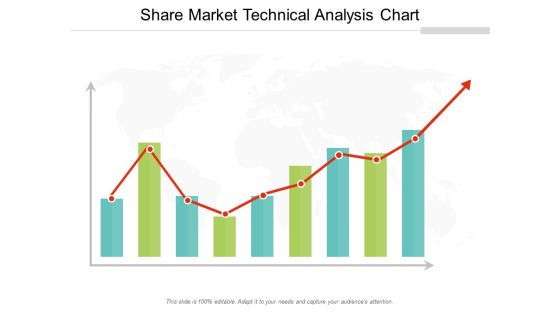
Share Market Technical Analysis Chart Ppt Powerpoint Presentation Professional Rules
This is a share market technical analysis chart ppt powerpoint presentation professional rules. This is a three stage process. The stages in this process are stock market, financial market, bull market.

Stock Chart Finance Analysis Ppt Powerpoint Presentation Ideas Portrait
This is a stock chart finance analysis ppt powerpoint presentation ideas portrait. This is a three stage process. The stages in this process are finance, marketing, management, investment, strategy.

Pie Chart Finance Ppt PowerPoint Presentation Infographics Mockup
This is a pie chart finance ppt powerpoint presentation infographics mockup . This is a four stage process. The stages in this process are finance, marketing, management, investment, analysis.
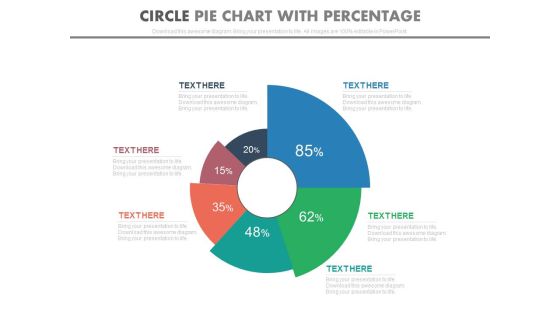
Pie Chart With Increasing Percentage Values Powerpoint Slides
This PowerPoint template has been designed with diagram of pie chart with increasing percentage values. This PPT slide can be used to prepare presentations for profit growth report and also for financial data analysis. You can download finance PowerPoint template to prepare awesome presentations.

Three Teams Skill Analysis Comparison Chart Powerpoint Slides
Create visually stunning and define your PPT presentations in a unique and inspiring manner using our above template. It contains graphics of comparison chart. This business slide helps to display teams skill analysis. Deliver amazing presentations to mesmerize your audience by using this PPT slide design.

Battery Chart With Percentage Values For Comparison PowerPoint Slides
This year?s sales has matched up with your expectations. Now match this slide with your presentation to show the same. Show your company?s performance or business growth with this four staged battery chart PowerPoint template. With this slide, you can easily convince your colleagues how your company gave a tremendous growth over the years or months. Perfect illustration to show that the targets are achieved. This PPT template is easy to edit. You can choose the color of your choice. Your colleagues are already impressed with the sales growth. Now impress others and choose this PPT innovative designed template.

Circle Chart With Percentage Value Analysis Powerpoint Slides
This PowerPoint template has been designed with circular process diagram. This business diagram helps to exhibit financial process control and analysis. Use this diagram to visually support your content.
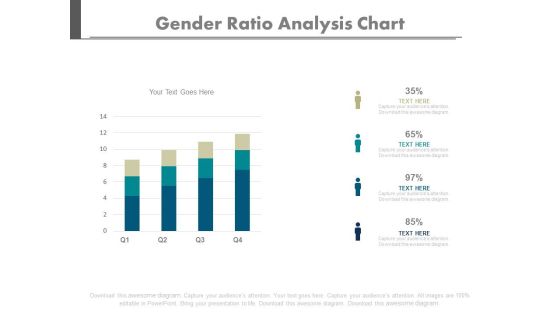
Four Bars Gender Population Ratio Chart Powerpoint Slides
Create dynamic presentations with our creative template of bar graph. This diagram may be used to present gender population. Download this template to leave permanent impression on your audience.

Business Cycle Diagram Books Stacked Sales Diagram
Document The Process On Our Business Cycle Diagram Books Stacked Sales Diagram Powerpoint Templates. Make A Record Of Every Detail. Satiate Desires With Our Business Cycle Diagram Books Stacked Sales Diagram Powerpoint Templates. Give Them All They Want And More.
Fours Stages Event Plan With Icons Ppt PowerPoint Presentation Infographics Display
This is a fours stages event plan with icons ppt powerpoint presentation infographics display. This is a four stage process. The stages in this process are project management, event management, event planning.
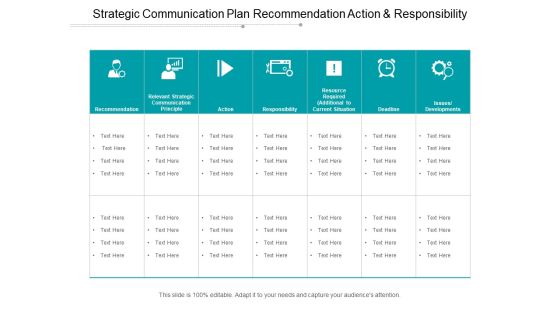
Strategic Communication Plan Recommendation Action And Responsibility Ppt PowerPoint Presentation Example
This is a strategic communication plan recommendation action and responsibility ppt powerpoint presentation example. This is a seven stage process. The stages in this process are internal communications strategy, internal communications plan, internal communications approach.
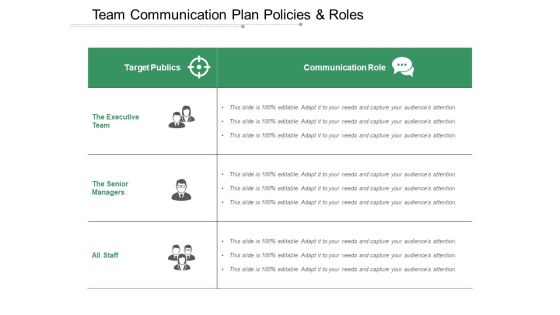
Team Communication Plan Policies And Roles Ppt PowerPoint Presentation Infographic Template Backgrounds
This is a team communication plan policies and roles ppt powerpoint presentation infographic template backgrounds. This is a three stage process. The stages in this process are internal communications strategy, internal communications plan, internal communications approach.

Cloud Adoption Blueprint Development Planning Performance And Scalability Optimization Ppt PowerPoint Presentation Model Clipart
This is a cloud adoption blueprint development planning performance and scalability optimization ppt powerpoint presentation model clipart. This is a four stage process. The stages in this process are cloud strategy, cloud planning, cloud management.
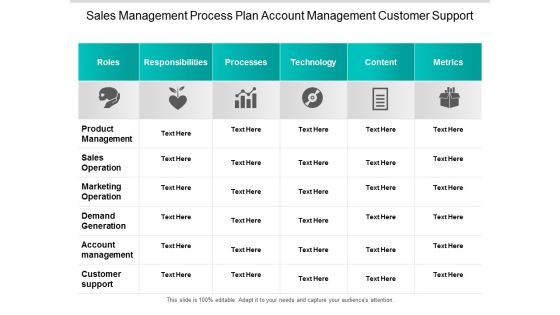
Sales Management Process Plan Account Management Customer Support Ppt Powerpoint Presentation Summary Design Templates
This is a sales management process plan account management customer support ppt powerpoint presentation summary design templates. This is a six stage process. The stages in this process are enablement plan, enablement strategy, enablement idea.

30 60 90 Days Business Activities Plan Ppt PowerPoint Presentation Inspiration Microsoft
This is a 30 60 90 days business activities plan ppt powerpoint presentation inspiration microsoft. This is a three stage process. The stages in this process are 30 60 90 project management strategy, 30 60 90 project development plan, 32 60 90 project management plan.
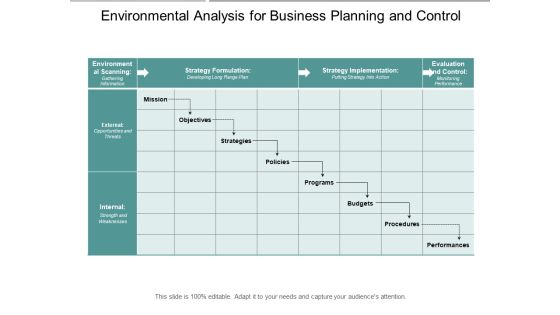
Environmental Analysis For Business Planning And Control Ppt PowerPoint Presentation Infographics Slide Portrait
This is a environmental analysis for business planning and control ppt powerpoint presentation infographics slide portrait. This is a three stage process. The stages in this process are environmental scan, environmental study, environmental examine.
Environmental Planning And Research Vector Icon Ppt PowerPoint Presentation Inspiration Example
This is a environmental planning and research vector icon ppt powerpoint presentation inspiration example. This is a four stage process. The stages in this process are environmental scan, environmental study, environmental examine.
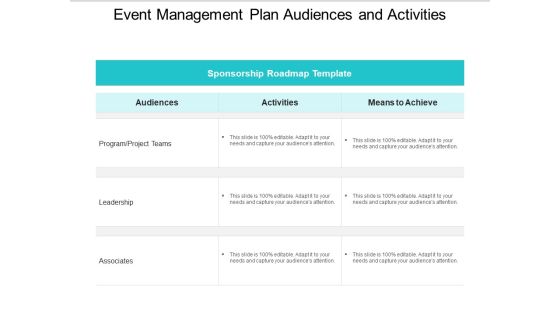
Event Management Plan Audiences And Activities Ppt PowerPoint Presentation Visual Aids Ideas
This is a event management plan audiences and activities ppt powerpoint presentation visual aids ideas. This is a three stage process. The stages in this process are sponsorship roadmap template, sponsorship timeline template, sponsorship linear process template.
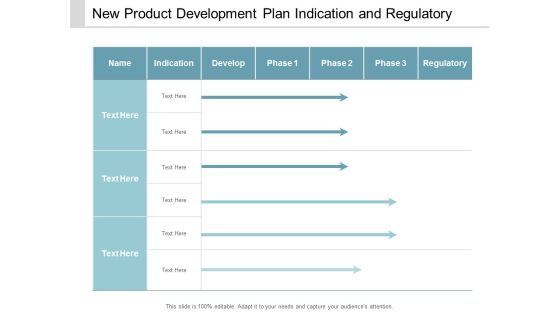
New Product Development Plan Indication And Regulatory Ppt Powerpoint Presentation Ideas Design Ideas
This is a new product development plan indication and regulatory ppt powerpoint presentation ideas design ideas. This is a three stage process. The stages in this process are product development pipeline, product development line, product development channel.

Action Implementation Plan Who When Status Ppt Powerpoint Presentation Model Background Image
This is a action implementation plan who when status ppt powerpoint presentation model background image. This is a five stage process. The stages in this process are implementation process, implementation procedure, implementation cycle.

Business Strategy Implementation Plan Persons Responsible And Status Ppt Powerpoint Presentation Pictures Designs Download
This is a business strategy implementation plan persons responsible and status ppt powerpoint presentation pictures designs download. This is a five stage process. The stages in this process are implementation process, implementation procedure, implementation cycle.
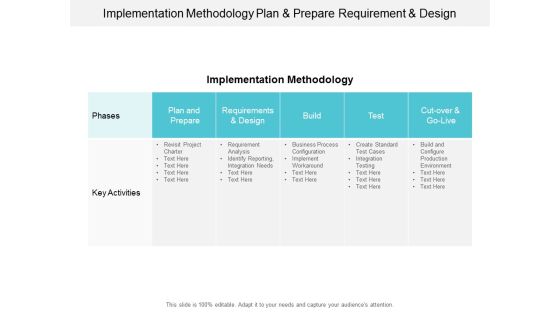
Implementation Methodology Plan And Prepare Requirement And Design Ppt Powerpoint Presentation Ideas File Formats
This is a implementation methodology plan and prepare requirement and design ppt powerpoint presentation ideas file formats. This is a five stage process. The stages in this process are implementation process, implementation procedure, implementation cycle.
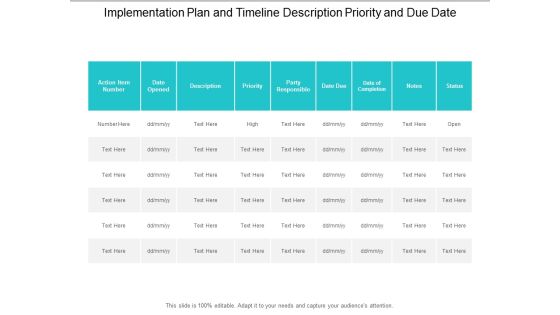
Implementation Plan And Timeline Description Priority And Due Date Ppt Powerpoint Presentation Model Graphics Download
This is a implementation plan and timeline description priority and due date ppt powerpoint presentation model graphics download. This is a nine stage process. The stages in this process are implementation process, implementation procedure, implementation cycle.
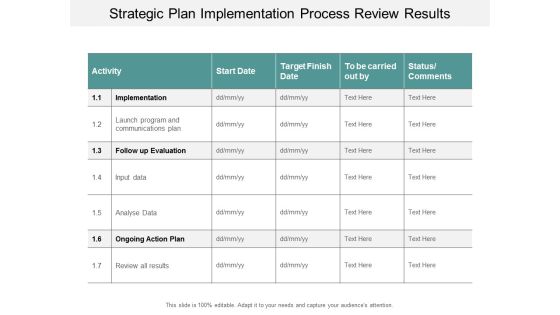
Strategic Plan Implementation Process Review Results Ppt Powerpoint Presentation Inspiration Graphic Tips
This is a strategic plan implementation process review results ppt powerpoint presentation inspiration graphic tips. This is a seven stage process. The stages in this process are implementation process, implementation procedure, implementation cycle.
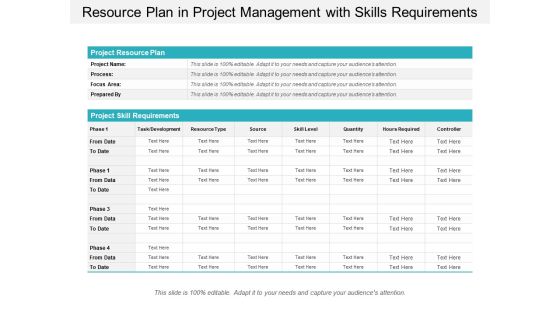
Resource Plan In Project Management With Skills Requirements Ppt Powerpoint Presentation Professional Deck
This is a resource plan in project management with skills requirements ppt powerpoint presentation professional deck. This is a four stage process. The stages in this process are resource management, wealth management, capital management.
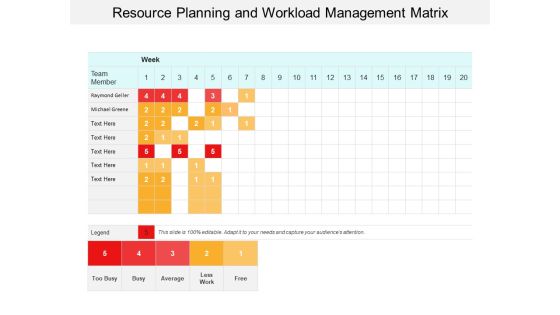
Resource Planning And Workload Management Matrix Ppt Powerpoint Presentation Styles Graphics Download
This is a resource planning and workload management matrix ppt powerpoint presentation styles graphics download. This is a five stage process. The stages in this process are resource management, wealth management, capital management.


 Continue with Email
 Sign up for an account
 Home
Home