2 Features

Comparison Ppt PowerPoint Presentation Styles Graphics
This is a comparison ppt powerpoint presentation styles graphics. This is a two stage process. The stages in this process are business, marketing, timeline, compare, management.
Highlights Ppt PowerPoint Presentation Icon Infographics
This is a highlights ppt powerpoint presentation icon infographics. This is a five stage process. The stages in this process are countries, stores worldwide, total revenue, associates, monthly website visitors.

Strategy Diagram 6 Staged Financial Highlight Diagram Business Cycle Diagram
Double Your Chances With Our Strategy Diagram 6 Staged Financial Highlight Diagram Business Cycle Diagram Powerpoint Templates. The Value Of Your Thoughts Will Increase Two-Fold. Charm The Audience With Your Thoughts. Add Our Strategy Diagram 6 Staged Financial Highlight Diagram Business Cycle Diagram Powerpoint Templates And They Will Be Dotty For You.
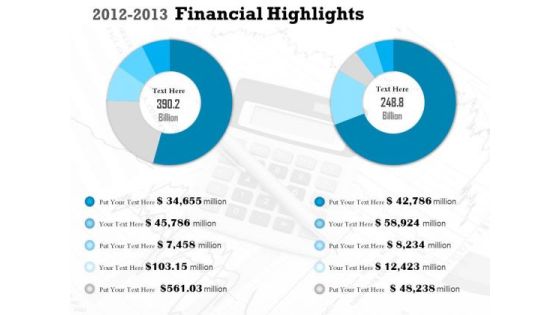
Mba Models And Frameworks 2012 2013 Financial Highlights Consulting Diagram
Get Out Of The Dock With Our MBA Models And Frameworks 2012 2013 Financial Highlights Consulting Diagram Powerpoint Templates. Your Mind Will Be Set Free.

Key Highlights Ppt PowerPoint Presentation Gallery Background Images
This is a key highlights ppt powerpoint presentation gallery background images. This is a eight stage process. The stages in this process are average roce, certified welders, countries, leader in automobile, years.

Comparison Ppt PowerPoint Presentation Infographics Example File
This is a comparison ppt powerpoint presentation infographics example file. This is a three stage process. The stages in this process are minimum, medium, maximum, financial, comparison.

Comparison Ppt PowerPoint Presentation Layouts Background Images
This is a comparison ppt powerpoint presentation layouts background images. This is a three stage process. The stages in this process are minimum, medium, maximum, comparison, percentage.

Percentage Charts For Statistical Comparison Powerpoint Slides
This PowerPoint template has been chart of percentage values. You may download this diagram for statistical comparison and analysis. Add this PPT slide to your presentation and impress your superiors.

Pricing Comparison Table For Analysis Powerpoint Slides
This PowerPoint template has been designed with pricing comparison table. This PowerPoint template may be used to present pricing strategy. Prove the viability of your ideas using this impressive slide.
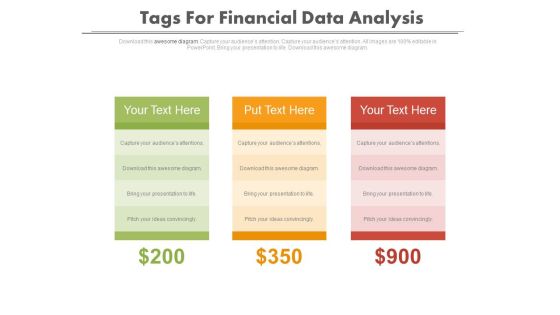
Tags For Financial Data Comparison Powerpoint Slides
Graphic of three text tag with dollar values has been used to design this power point template. This diagram may be used for financial data comparison. Use this diagram to build a professional presentation.

Comparison Ppt PowerPoint Presentation Slides Structure
This is a comparison ppt powerpoint presentation slides structure. This is a three stage process. The stages in this process are pc users in, laptop users in, mobile users in, technology, years.

Consulting Diagram Comparison Chart With Eight Steps Marketing Diagram
Dominate Proceedings With Your Ideas. Our Consulting Diagram Comparison Chart With Eight Steps Marketing Diagram Powerpoint Templates Will Empower Your Thoughts.

Marketing Diagram Comparison Chart Business Design Business Cycle Diagram
Get Out Of The Dock With Our Marketing Diagram Comparison Chart Business Design Business Cycle Diagram Powerpoint Templates. Your Mind Will Be Set Free.
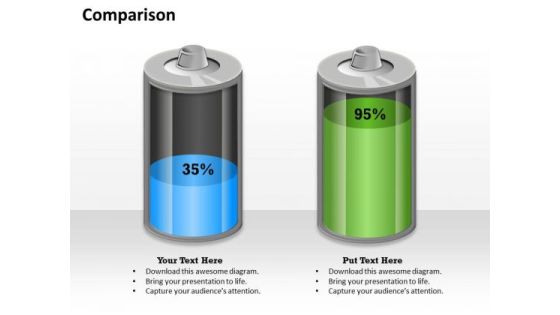
Business Cycle Diagram Percentage Comparison Business Design Strategy Diagram
Get Out Of The Dock With Our Business Cycle Diagram Percentage Comparison Business Design Strategy Diagram Powerpoint Templates. Your Mind Will Be Set Free.
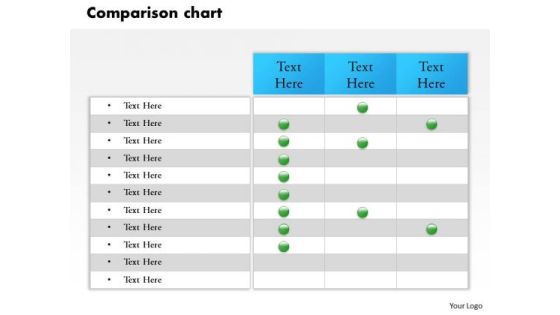
Business Cycle Diagram Product Description And Comparison Chart Sales Diagram
Document Your Views On Our Business Cycle Diagram Product Description And Comparison Chart Sales Diagram Powerpoint Templates. They Will Create A Strong Impression.

Business Diagram Comparison Chart And Business Report Consulting Diagram
Document The Process On Our Business Diagram Comparison Chart And Business Report Consulting Diagram Powerpoint Templates. Make A Record Of Every Detail.

Business Diagram Comparison Of Work Information Strategic Management
Our Business Diagram Comparison Of Work Information Strategic Management Powerpoint Templates Team Are A Dogged Lot. They Keep At It Till They Get It Right.

Business Framework Model Comparison Chart Of Business Product Business Diagram
Put In A Dollop Of Our Business Framework Model Comparison Chart Of Business Product Business Diagram Powerpoint Templates. Give Your Thoughts A Distinctive Flavor.

Business Framework Model Product Comparison Business Chart Marketing Diagram
Doll Up Your Thoughts With Our Business Framework Model Product Comparison Business Chart Marketing Diagram Powerpoint Templates. They Will Make A Pretty Picture.

Consulting Diagram Comparison Chart For Effective Reports Business Cycle Diagram
Establish The Dominance Of Your Ideas. Our Consulting Diagram Comparison Chart For Effective Reports Business Cycle Diagram Powerpoint Templates Will Put Them On Top.
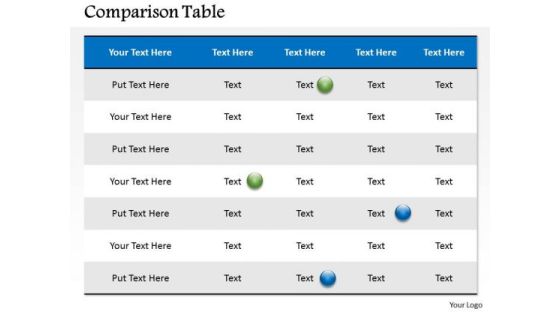
Marketing Diagram Comparison Table For Business Data Sales Diagram
Establish Your Dominion With Our Marketing Diagram Comparison Table For Business Data Sales Diagram Powerpoint Templates. Rule The Stage With Your Thoughts.
Strategic Management Comparison Chart Business Design Sales Diagram
Open Up Doors That Lead To Success. Our Strategic Management Comparison Chart Business Design Sales Diagram Powerpoint Templates Provide The Handles.
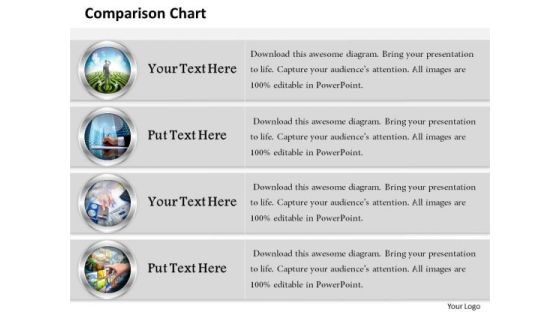
Strategic Management Comparison Chart With Pictures Business Diagram
Deliver The Right Dose With Our Strategic Management Comparison Chart With Pictures Business Diagram Powerpoint Templates. Your Ideas Will Get The Correct Illumination.

Strategic Management Comparison Table Of Business Information Sales Diagram
Our Strategic Management Comparison Table Of Business Information Sales Diagram Powerpoint Templates Deliver At Your Doorstep. Let Them In For A Wonderful Experience.
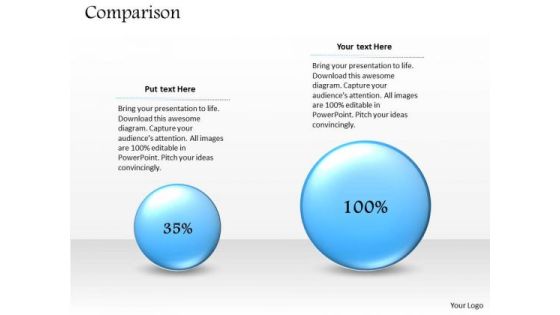
Strategic Management Percentage Comparison Business Layout Business Diagram
Knock On The Door To Success With Our Strategic Management Percentage Comparison Business Layout Business Diagram Powerpoint Templates. Be Assured Of Gaining Entry.
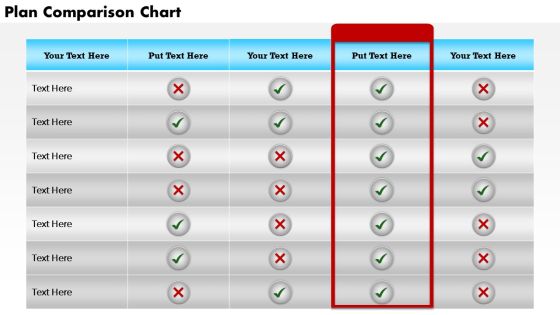
Strategic Management Plan Description And Comparison Chart Marketing Diagram
Connect The Dots With Our Strategic Management Plan Description And Comparison Chart Marketing Diagram Powerpoint Templates. Watch The Whole Picture Clearly Emerge.
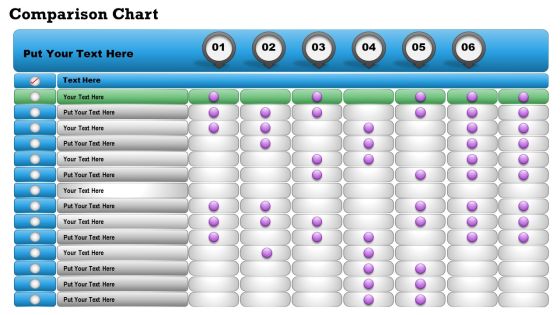
Strategy Diagram Comparison Chart For Business Data Consulting Diagram
Double Up Our Strategy Diagram Comparison Chart For Business Data Consulting Diagram Powerpoint Templates With Your Thoughts. They Will Make An Awesome Pair.
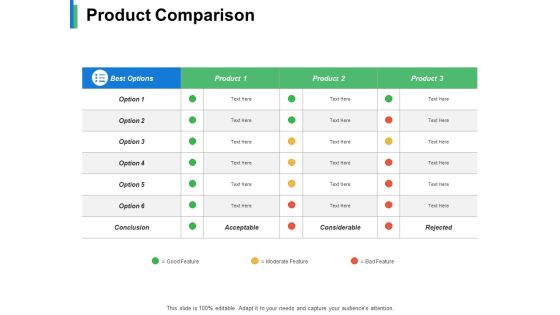
Product Comparison Ppt PowerPoint Presentation Show Layout Ideas
This is a product comparison ppt powerpoint presentation show layout ideas. This is a three stage process. The stages in this process are business, management, marketing, strategy, sales.
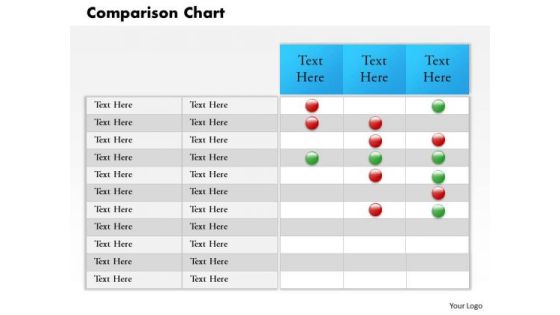
Business Framework Model Comparison Chart And Business Report Strategy Diagram
Analyze Ailments On Our Business Framework Model Comparison Chart And Business Report Strategy Diagram Powerpoint Templates. Bring Out The Thinking Doctor In You. Dock Your Thoughts With Our Business Framework Model Comparison Chart And Business Report Strategy Diagram Powerpoint Templates. They Will Launch Them Into Orbit.

Business Cycle Diagram Data Driven Comparison Chart Business Diagram
Analyze Ailments On Our Business Cycle Diagram Data Driven Comparison Chart Business Diagram Powerpoint Templates. Bring Out The Thinking Doctor In You. Dock Your Thoughts With Our Business Cycle Diagram Data Driven Comparison Chart Business Diagram Powerpoint Templates. They Will Launch Them Into Orbit.
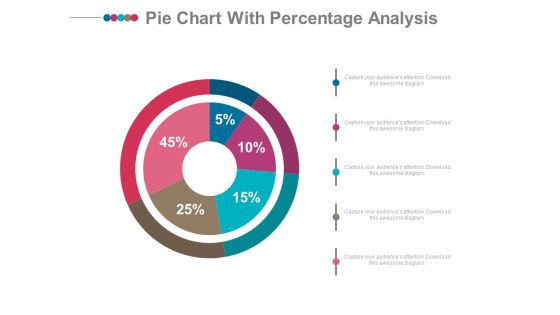
Pie Chart With Financial Data Comparison Powerpoint Slides
Emphatically define your message with our above template which contains graphics of pie chart. This PowerPoint template may be used to display financial data comparison. Grab the attention of your listeners with this slide.

Test Tubes With Percentage Data For Comparison Powerpoint Slides
This PowerPoint template has been designed with test tubes and percentage data. You may download this PPT slide to display data comparison and analysis. Add this slide to your presentation and impress your superiors.
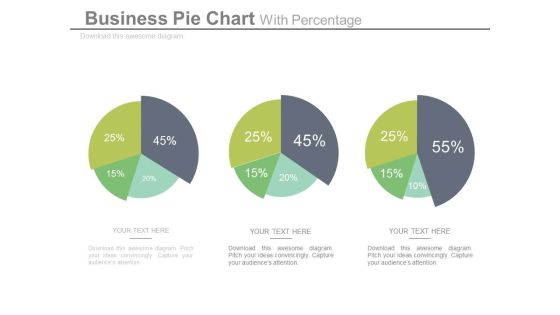
Pie Charts For Relative Comparison Study Powerpoint Slides
This power point template illustrates diagram of three pie charts with percentage values. This business slide can be used for relative comparison study. Present your views and ideas with this impressive slide.

Pay For Performance Comparison Table Ppt PowerPoint Presentation Inspiration Show
This is a pay for performance comparison table ppt powerpoint presentation inspiration show. This is a three stage process. The stages in this process are business, compare, management, strategy, analysis, table.

Product Comparison Data Bar Graph Ppt Powerpoint Presentation Slides Show
This is a product comparison data bar graph ppt powerpoint presentation slides show. This is a four stage process. The stages in this process are data presentation, content presentation, information presentation.

Three Teams Skill Analysis Comparison Chart Powerpoint Slides
Create visually stunning and define your PPT presentations in a unique and inspiring manner using our above template. It contains graphics of comparison chart. This business slide helps to display teams skill analysis. Deliver amazing presentations to mesmerize your audience by using this PPT slide design.

Battery Chart With Percentage Values For Comparison PowerPoint Slides
This year?s sales has matched up with your expectations. Now match this slide with your presentation to show the same. Show your company?s performance or business growth with this four staged battery chart PowerPoint template. With this slide, you can easily convince your colleagues how your company gave a tremendous growth over the years or months. Perfect illustration to show that the targets are achieved. This PPT template is easy to edit. You can choose the color of your choice. Your colleagues are already impressed with the sales growth. Now impress others and choose this PPT innovative designed template.

Circle Chart With Man And Woman Ratio Comparison Powerpoint Slides
This PowerPoint template has been designed with graphics of circle chart. You may download this PPT slide to depict man and woman ratio analysis. Add this slide to your presentation and impress your superiors.

Business Framework Model Comparison Chart Of Economic Situation Mba Models And Frameworks
Get The Domestics Right With Our Business Framework Model Comparison Chart Of Economic Situation MBA Models And Frameworks Powerpoint Templates. Create The Base For Thoughts To Grow.

Mba Models And Frameworks Comparison Design With Yes No Marketing Diagram
Your Listeners Will Never Doodle. Our MBA Models And Frameworks Comparison Design With Yes No Marketing Diagram Powerpoint Templates Will Hold Their Concentration.
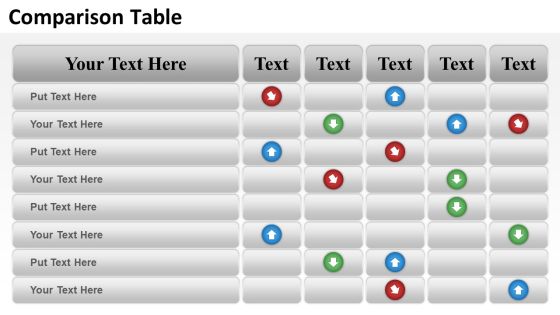
Mba Models And Frameworks Comparison Table Of Business Data Business Diagram
Be A Donor Of Great Ideas. Display Your Charity On Our MBA Models And Frameworks Comparison Table Of Business Data Business Diagram Powerpoint Templates.
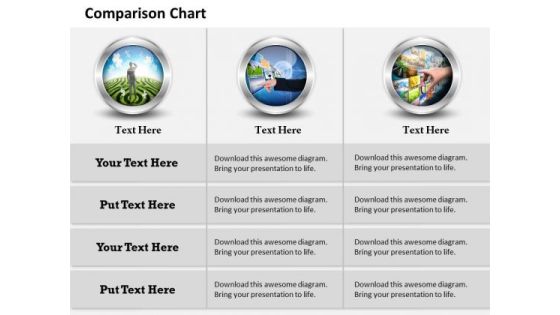
Strategic Management Comparison Chart Of Business Information Mba Models And Frameworks
Our Strategic Management Comparison Chart Of Business Information MBA Models And Frameworks Powerpoint Templates Abhor Doodling. They Never Let The Interest Flag.
Twitter Google Plus Facebook Social Media Powerpoint Slides
This professional slide contains graphics of Twitter, Google plus and Face book social media logos. You may use this chart for comparison of social media sites. Add this slide to your presentation and impress your superiors.

Pay For Performance Comparison Table Ppt PowerPoint Presentation Outline Design Templates
This is a pay for performance comparison table ppt powerpoint presentation outline design templates. This is a three stage process. The stages in this process are business, management, table, planning, strategy.

3D Bar Chart For Percentage Values Comparison Ppt PowerPoint Presentation Professional Visual Aids
This is a 3d bar chart for percentage values comparison ppt powerpoint presentation professional visual aids. This is a five stage process. The stages in this process are art, colouring, paint brush.

Data Comparison And Analysis Chart Ppt Powerpoint Presentation File Background Images
This is a data comparison and analysis chart ppt powerpoint presentation file background images. This is a four stage process. The stages in this process are data presentation, content presentation, information presentation.
Percentage Value Comparison Pie Chart Icon Ppt PowerPoint Presentation Model Clipart Images
This is a percentage value comparison pie chart icon ppt powerpoint presentation model clipart images. This is a three stage process. The stages in this process are percentage icon, dividend icon, portion icon.

Sales Kpi Performance Summary Ppt PowerPoint Presentation Infographic Template Elements
This is a sales kpi performance summary ppt powerpoint presentation infographic template elements. This is a seven stage process. The stages in this process are revenue comparison, quantity comparison, product sales mix, regional sales mix, budget.

New Product Introduction Ppt PowerPoint Presentation Professional Brochure
This is a new product introduction ppt powerpoint presentation professional brochure. This is a two stage process. The stages in this process are explain the product idea in brief, product details, explain the product idea in detail for e.g. requirement of the product, technology used, benefits.
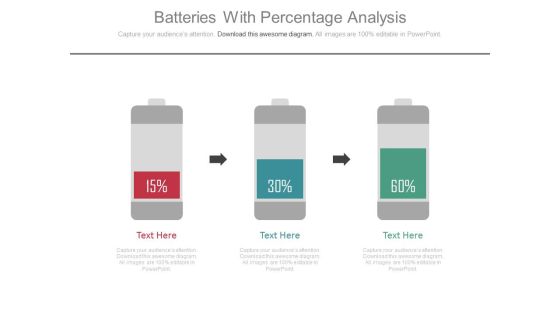
Three Batteries As Growth Steps Powerpoint Slides
This PowerPoint template has been designed with graphics of three batteries. Download this PPT slide for data comparisons or it may be used to display growth steps. Add this slide to your presentation and impress your superiors.
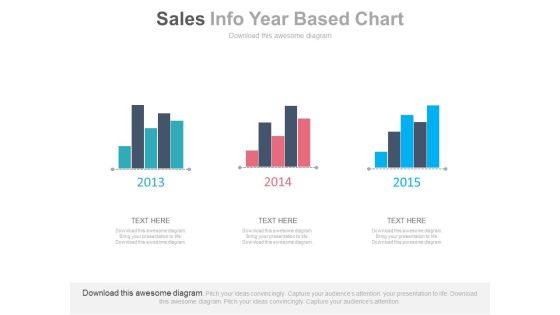
Three Years Sales Data Bar Graph Powerpoint Slides
This PowerPoint template has been designed with bar charts. This business slide may be used to display three years sales data for comparison. Present your views and ideas with this impressive design.
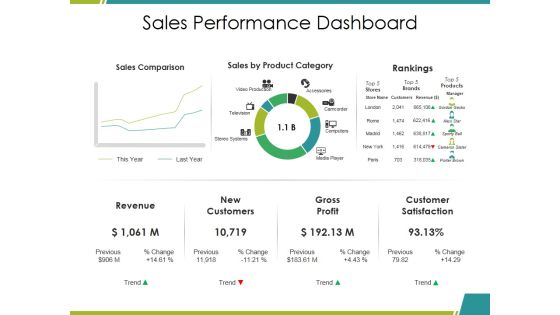
Sales Performance Dashboard Ppt PowerPoint Presentation Infographics Mockup
This is a sales performance dashboard ppt powerpoint presentation infographics mockup. This is a three stage process. The stages in this process are sales comparison, sales by product category, rankings, revenue, gross profit.

Before And After Business Strategy Ppt PowerPoint Presentation Model Graphics
This is a before and after business strategy ppt powerpoint presentation model graphics. This is a eight stage process. The stages in this process are before vs after, comparison, compare.

Revenue Projections Example Chart Powerpoint Ideas
This is a revenue projections example chart powerpoint ideas. This is a eleven stage process. The stages in this process are brand paid search, non branded paid search, direct load, brand organic search, non brand organic, inbound free links, affiliates, display, comparison shopping, display retargeting, email.

Three Tags For Performance Management Articles Powerpoint Slides
This slide has been creatively designed to get you the best response for your presentation. This slide can be used for various purposes. While this slide can be used for graphically present a comparison between different variants of the same product, it can also be used to compare different products as well. Use this professionally made slide to demonstrate a sequence or a planned or proposed sequence to your audience. The slide is completely customizable and you can add colors, font and icons of your choice as per your needs and convenience. The slide can be used to explain a step that occurs in 3 steps.

Four Triangles In Progressive Order Powerpoint Slides
The multicolored triangles in this slide can be used for various purposes. The differently sized triangles can be used by a company or an organization to present their growth over the years. The triangles can also be used to portray a comparison between different products or services being offered by a business and the increasing size can portray the added advantages of opting for the next package. The numbers inside the triangles can be used to demonstrate progressive steps involved in a process or a procedure. It can also be used to depict ways to get closer or to achieve a target. The triangles can effectively represent the departments as per their workload or importance.
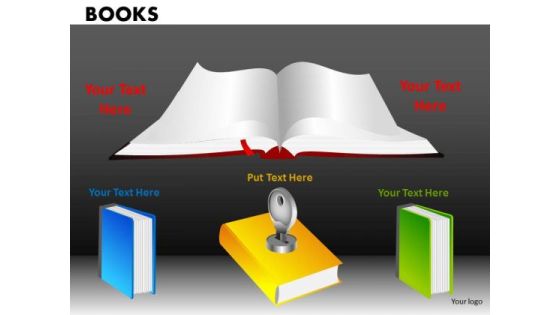
Strategy Diagram Books Consulting Diagram
Highlight Your Drive With Our Strategy Diagram Books Consulting Diagram Powerpoint Templates. Prove The Fact That You Have Control. Go The Distance With Our Strategy Diagram Books Consulting Diagram Powerpoint Templates. Maintain The Pace Till The End.
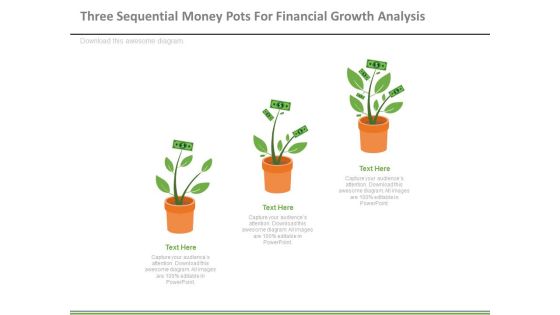
Money Plants For Financial Growth Analysis Powerpoint Slides
This PowerPoint slide contains graphics of three money plants. This professional slide may be used to display ideas for financial growth. Use this template to highlight to make impressive presentations.

Business Review And Performance Assessment Dashboards Ppt PowerPoint Presentation Infographics Show
This is a business review and performance assessment dashboards ppt powerpoint presentation infographics show. This is a four stage process. The stages in this process are year in review, yearly highlights, countdowns.

Key Elements For Successful Goal Achievement Ppt Powerpoint Presentation Show Microsoft
This is a key elements for successful goal achievement ppt powerpoint presentation show microsoft. This is a three stage process. The stages in this process are eys for success, keys for achievement, highlights for success.
 Home
Home