 AI PPT Maker
 Templates
 PPT Bundles
 Design Services
 Business PPTs
 Business Plan
 Management
 Strategy
 Introduction PPT
 Roadmap
 Self Introduction
 Timelines
 Process
 Marketing
 Agenda
 Technology
 Medical
 Startup Business Plan
 Cyber Security
 Dashboards
 SWOT
SWOT Proposals
 Education
 Pitch Deck
 Digital Marketing
 KPIs
KPIs Project Management
 Product Management
 Artificial Intelligence
 Target Market
 Communication
 Supply Chain
 Google Slides
 Research Services
 One Pagers
 All Categories
4
Welcome to our assortment of Most Popular PowerPoint templates that are designed to assist you show your creative side and innovation your sphere. Planning and Innovation are two of the most important aspects of an emerging business. This section includes the designs that you require in your day to day presentations. Every day there are hundreds or even thousands of PowerPoint presentations created on various subjects such as business, medical, sales and marketing.
SHOW
- 60
- 120
- 180
DISPLAYING: 60 of 191 Item(s)
Page


Persuade your audience using this Measuring Product Performance Using Client Health Score Icon Graphics PDF. This PPT design covers four stages, thus making it a great tool to use. It also caters to a variety of topics including Measuring Product Performance, Using Client Health, Score Icon. Download this PPT design now to present a convincing pitch that not only emphasizes the topic but also showcases your presentation skills.


Persuade your audience using this Client Health Score Measurement Scale Icon Themes PDF. This PPT design covers four stages, thus making it a great tool to use. It also caters to a variety of topics including Client Health Score, Measurement Scale Icon. Download this PPT design now to present a convincing pitch that not only emphasizes the topic but also showcases your presentation skills.
Persuade your audience using this Customer Effort Score Indicator Icon To Measure Required Actions Ppt File Sample PDF. This PPT design covers four stages, thus making it a great tool to use. It also caters to a variety of topics including Customer, Effort Score Indicator, Icon To Measure, Required Actions. Download this PPT design now to present a convincing pitch that not only emphasizes the topic but also showcases your presentation skills.


Presenting Yearly Schedule Planner Icon With Event Date And Time Clipart PDF to dispense important information. This template comprises Four stages. It also presents valuable insights into the topics including Planner Icon, Event Date And Time. This is a completely customizable PowerPoint theme that can be put to use immediately. So, download it and address the topic impactfully.


Persuade your audience using this Disaster Threat Severity Assessment Icon Ppt Show Slides PDF. This PPT design covers four stages, thus making it a great tool to use. It also caters to a variety of topics including Disaster Threat, Severity Assessment, Icon. Download this PPT design now to present a convincing pitch that not only emphasizes the topic but also showcases your presentation skills.


Persuade your audience using this Satisfaction Rate Icon For Customer Service Metrics Summary PDF. This PPT design covers four stages, thus making it a great tool to use. It also caters to a variety of topics including Satisfaction Rate Icon, Customer Service Metrics. Download this PPT design now to present a convincing pitch that not only emphasizes the topic but also showcases your presentation skills.
Persuade your audience using this Network Service Assessment Icon To Measure Web Speed Pictures PDF. This PPT design covers four stages, thus making it a great tool to use. It also caters to a variety of topics including Network Service Assessment Icon To Measure Web Speed. Download this PPT design now to present a convincing pitch that not only emphasizes the topic but also showcases your presentation skills.
Presenting navigation compass icon depicting northeastern region direction ideas pdf to dispense important information. This template comprises four stages. It also presents valuable insights into the topics including navigation compass icon depicting northeastern region direction. This is a completely customizable PowerPoint theme that can be put to use immediately. So, download it and address the topic impactfully.


Presenting compass navigating northeastern region direction graphics pdf to dispense important information. This template comprises four stages. It also presents valuable insights into the topics including compass navigating northeastern region direction. This is a completely customizable PowerPoint theme that can be put to use immediately. So, download it and address the topic impactfully.
Presenting sprint iteration process icon for application development ppt powerpoint presentation gallery deck pdf to dispense important information. This template comprises four stages. It also presents valuable insights into the topics including sprint iteration process icon for application development. This is a completely customizable PowerPoint theme that can be put to use immediately. So, download it and address the topic impactfully.


This is a subscription based business model for new ventures dashboard ppt ideas show pdf template with various stages. Focus and dispense information on four stages using this creative set, that comes with editable features. It contains large content boxes to add your information on topics like dashboard. You can also showcase facts, figures, and other relevant content using this PPT layout. Grab it now.


Presenting software funding elevator pitch deck dashboard ppt professional portfolio pdf to provide visual cues and insights. Share and navigate important information on four stages that need your due attention. This template can be used to pitch topics like dashboard. In addtion, this PPT design contains high resolution images, graphics, etc, that are easily editable and available for immediate download.


Mentioned slide shows monthly performance of current and forecasted performance of advanced product designing tools. Here the performance impact is measured by the number of prototypes developed and accepted. Presenting information technology transformation impact of using advanced inventory management methods background pdf to provide visual cues and insights. Share and navigate important information on four stages that need your due attention. This template can be used to pitch topics like current performance, forecasted performance, developed. In addtion, this PPT design contains high resolution images, graphics, etc, that are easily editable and available for immediate download.


Mentioned slide shows monthly performance of current and forecasted performance of advanced product designing tools. Here the performance impact is measured by the number of prototypes developed and accepted. This is a information technology transformation impact of using advanced inventory management methods time guidelines pdf template with various stages. Focus and dispense information on four stages using this creative set, that comes with editable features. It contains large content boxes to add your information on topics like average manufacturing cycle, average order cycle time, inventory management. You can also showcase facts, figures, and other relevant content using this PPT layout. Grab it now.


Presenting business overview ppt slides dashboard ppt slides designs pdf to provide visual cues and insights. Share and navigate important information on four stages that need your due attention. This template can be used to pitch topics like dashboard. In addtion, this PPT design contains high resolution images, graphics, etc, that are easily editable and available for immediate download.
Presenting time management in project planning vector icon ppt powerpoint presentation file outfit pdf to dispense important information. This template comprises four stages. It also presents valuable insights into the topics including time management in project planning vector icon. This is a completely customizable PowerPoint theme that can be put to use immediately. So, download it and address the topic impactfully.
Persuade your audience using this picture of scooter dashboard with fuel gauge ppt powerpoint presentation file icon pdf. This PPT design covers four stages, thus making it a great tool to use. It also caters to a variety of topics including picture of scooter dashboard with fuel gauge. Download this PPT design now to present a convincing pitch that not only emphasizes the topic but also showcases your presentation skills.
Persuade your audience using this fuel meter vector icon ppt powerpoint presentation professional examples pdf. This PPT design covers four stages, thus making it a great tool to use. It also caters to a variety of topics including fuel meter vector icon. Download this PPT design now to present a convincing pitch that not only emphasizes the topic but also showcases your presentation skills.


Persuade your audience using this picture of pocket watch dial ppt powerpoint presentation gallery demonstration pdf. This PPT design covers four stages, thus making it a great tool to use. It also caters to a variety of topics including picture of pocket watch dial. Download this PPT design now to present a convincing pitch that not only emphasizes the topic but also showcases your presentation skills.
Presenting daylight time measurement vector icon ppt powerpoint presentation file infographics pdf to dispense important information. This template comprises four stages. It also presents valuable insights into the topics including daylight time measurement vector icon. This is a completely customizable PowerPoint theme that can be put to use immediately. So, download it and address the topic impactfully.
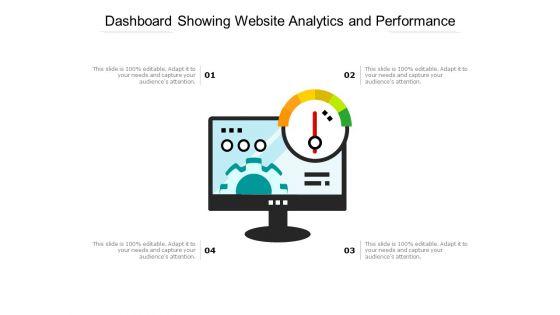
Persuade your audience using this dashboard showing website analytics and performance ppt powerpoint presentation portfolio inspiration pdf. This PPT design covers four stages, thus making it a great tool to use. It also caters to a variety of topics including dashboard showing website analytics and performance. Download this PPT design now to present a convincing pitch that not only emphasizes the topic but also showcases your presentation skills.


Presenting dashboard showing business performance assessment ppt powerpoint presentation portfolio design templates pdf to dispense important information. This template comprises four stages. It also presents valuable insights into the topics including dashboard showing business performance assessment. This is a completely customizable PowerPoint theme that can be put to use immediately. So, download it and address the topic impactfully.


Persuade your audience using this four stages in risk management process ppt powerpoint presentation professional grid pdf. This PPT design covers four stages, thus making it a great tool to use. It also caters to a variety of topics including hazard description, community assets identification, risk analysis, vulnerability summary. Download this PPT design now to present a convincing pitch that not only emphasizes the topic but also showcases your presentation skills.
Presenting this set of slides with name tea break time in office vector icon ppt powerpoint presentation gallery inspiration pdf. This is a four stage process. The stages in this process are tea break time in office vector icon. This is a completely editable PowerPoint presentation and is available for immediate download. Download now and impress your audience.
Presenting this set of slides with name coffee break at workplace vector icon ppt powerpoint presentation file backgrounds pdf. This is a four stage process. The stages in this process are coffee break at workplace vector icon. This is a completely editable PowerPoint presentation and is available for immediate download. Download now and impress your audience.


Presenting this set of slides with name four steps of business process improvement ppt powerpoint presentation file graphics example pdf. This is a four stage process. The stages in this process are four steps of business process improvement. This is a completely editable PowerPoint presentation and is available for immediate download. Download now and impress your audience.


Presenting this set of slides with name four steps linear process with arrows ppt powerpoint presentation file clipart pdf. This is a four stage process. The stages in this process are four steps linear process with arrows. This is a completely editable PowerPoint presentation and is available for immediate download. Download now and impress your audience.


Presenting this set of slides with name four factors of time management ppt powerpoint presentation gallery microsoft pdf. This is a four stage process. The stages in this process are four factors of time management. This is a completely editable PowerPoint presentation and is available for immediate download. Download now and impress your audience.
Presenting this set of slides with name speedometer dashboard vector icon ppt powerpoint presentation file designs download pdf. This is a four stage process. The stages in this process are speedometer dashboard vector icon. This is a completely editable PowerPoint presentation and is available for immediate download. Download now and impress your audience.


Presenting this set of slides with name four stages of return investment model engagement ppt powerpoint presentation inspiration layout ideas. This is a four stage process. The stages in this process are dashboard, marketing, management, investment, analysis. This is a completely editable PowerPoint presentation and is available for immediate download. Download now and impress your audience.


Presenting this set of slides with name four stages of return investment model ppt powerpoint presentation pictures background image. This is a four stage process. The stages in this process are dashboard, marketing, process, management, planning. This is a completely editable PowerPoint presentation and is available for immediate download. Download now and impress your audience.


SHOW
- 60
- 120
- 180
DISPLAYING: 60 of 191 Item(s)
Page