 AI PPT Maker
 Templates
 PPT Bundles
 Design Services
 Business PPTs
 Business Plan
 Management
 Strategy
 Introduction PPT
 Roadmap
 Self Introduction
 Timelines
 Process
 Marketing
 Agenda
 Technology
 Medical
 Startup Business Plan
 Cyber Security
 Dashboards
 SWOT
SWOT Proposals
 Education
 Pitch Deck
 Digital Marketing
 KPIs
KPIs Project Management
 Product Management
 Artificial Intelligence
 Target Market
 Communication
 Supply Chain
 Google Slides
 Research Services
 One Pagers
 All Categories
Charts and Graphs
Welcome to our assortment of Most Popular PowerPoint templates that are designed to assist you show your creative side and innovation your sphere. Planning and Innovation are two of the most important aspects of an emerging business. This section includes the designs that you require in your day to day presentations. Every day there are hundreds or even thousands of PowerPoint presentations created on various subjects such as business, medical, sales and marketing.
SHOW
- 60
- 120
- 180
DISPLAYING: 60 of 10000 Item(s)
Page


The following slide highlights the companys audience demographics distribution based on people age and gender to make business strategy for target market. Want to ace your presentation in front of a live audience Our Website Visitors Data Marketing Research Services Management Business Download Pdf can help you do that by engaging all the users towards you. Slidegeeks experts have put their efforts and expertise into creating these impeccable powerpoint presentations so that you can communicate your ideas clearly. Moreover, all the templates are customizable, and easy-to-edit and downloadable. Use these for both personal and commercial use.


The following slide depicts the employees working in Pureprofile. It shows total employee count, employee retention, employee consideration and employee satisfaction score. Slidegeeks has constructed Our Employees Marketing Research Services Management Business Themes Pdf after conducting extensive research and examination. These presentation templates are constantly being generated and modified based on user preferences and critiques from editors. Here, you will find the most attractive templates for a range of purposes while taking into account ratings and remarks from users regarding the content. This is an excellent jumping-off point to explore our content and will give new users an insight into our top-notch PowerPoint Templates.


The following slide highlights the profit and margin from business operations for a time period of 6 years. It also provides key insights for the operating income data. The Operating Profit And Margin Marketing Research Services Management Business Pictures Pdf is a compilation of the most recent design trends as a series of slides. It is suitable for any subject or industry presentation, containing attractive visuals and photo spots for businesses to clearly express their messages. This template contains a variety of slides for the user to input data, such as structures to contrast two elements, bullet points, and slides for written information. Slidegeeks is prepared to create an impression.


The following slide highlights the companys net income and profit margin from all operations. It shows net income data from 2016 to 2021 to showcase growth in income. The best PPT templates are a great way to save time, energy, and resources. Slidegeeks have 100 percent editable powerpoint slides making them incredibly versatile. With these quality presentation templates, you can create a captivating and memorable presentation by combining visually appealing slides and effectively communicating your message. Download Operating Expense Marketing Research Services Management Business Formats Pdf from Slidegeeks and deliver a wonderful presentation.
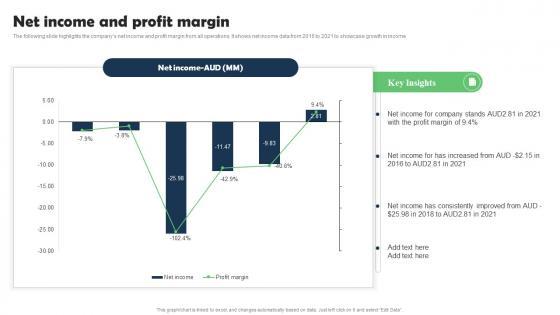
The following slide highlights the companys net income and profit margin from all operations. It shows net income data from 2016 to 2021 to showcase growth in income. Explore a selection of the finest Net Income And Profit Marketing Research Services Management Business Information Pdf here. With a plethora of professionally designed and pre-made slide templates, you can quickly and easily find the right one for your upcoming presentation. You can use our Net Income And Profit Marketing Research Services Management Business Information Pdf to effectively convey your message to a wider audience. Slidegeeks has done a lot of research before preparing these presentation templates. The content can be personalized and the slides are highly editable. Grab templates today from Slidegeeks.


The following slide highlights the historical revenue of Pureprofile from all of its operations. It also describes revenue CAGR and revenue growth over a time period of 6 years. Formulating a presentation can take up a lot of effort and time, so the content and message should always be the primary focus. The visuals of the PowerPoint can enhance the presenters message, so our Historical Revenue Marketing Research Services Management Business Slides Pdf was created to help save time. Instead of worrying about the design, the presenter can concentrate on the message while our designers work on creating the ideal templates for whatever situation is needed. Slidegeeks has experts for everything from amazing designs to valuable content, we have put everything into Historical Revenue Marketing Research Services Management Business Slides Pdf


The following slide highlights the yearly gross profit from 2016 to 2021. it illustrates the changes in profit and margin along with the reasons for the increase or decrease. Make sure to capture your audiences attention in your business displays with our gratis customizable Gross Profit And Margin Marketing Research Services Management Business Background Pdf. These are great for business strategies, office conferences, capital raising or task suggestions. If you desire to acquire more customers for your tech business and ensure they stay satisfied, create your own sales presentation with these plain slides.


This slide illustrates a graph of EBITDA in AUD and margin in percentage for Pureprofile company showing growth trend in last six years from 2016 to 2021. It also showcases key insights for EBITDA. Whether you have daily or monthly meetings, a brilliant presentation is necessary. EBITDA And Margin Marketing Research Services Management Business Information Pdf can be your best option for delivering a presentation. Represent everything in detail using EBITDA And Margin Marketing Research Services Management Business Information Pdf and make yourself stand out in meetings. The template is versatile and follows a structure that will cater to your requirements. All the templates prepared by Slidegeeks are easy to download and edit. Our research experts have taken care of the corporate themes as well. So, give it a try and see the results.


The slide showcases the balance sheet and cash flow statement of last six years to represent the current financial position of the organization. Boost your pitch with our creative Balance Sheet And Cash Flow Marketing Research Services Management Business Designs Pdf. Deliver an awe-inspiring pitch that will mesmerize everyone. Using these presentation templates you will surely catch everyones attention. You can browse the ppts collection on our website. We have researchers who are experts at creating the right content for the templates. So you do not have to invest time in any additional work. Just grab the template now and use them.


This slide talks about the ways in which Amazon uses artificial intelligence to provide personalized recommendations. These ways include Amazon Alexa, Amazon GO, etc. The purpose of this slide is to illustrate how recommendation engine has elevated the sales of Amazon. Find a pre-designed and impeccable Recommendation Techniques Introduction To Recommender System Used By Amazon Demonstration PDF. The templates can ace your presentation without additional effort. You can download these easy-to-edit presentation templates to make your presentation stand out from others. So, what are you waiting for Download the template from Slidegeeks today and give a unique touch to your presentation.


This slide talks about the evolution of Netflix after efficiently utilizing the concept of movie recommendation. This slide also depicts the increase in the number of Netflix subscribers from 2013 to 2023. Are you searching for a Recommendation Techniques Evolution Of Recommender System Used By Netflix Designs PDF that is uncluttered, straightforward, and original Its easy to edit, and you can change the colors to suit your personal or business branding. For a presentation that expresses how much effort you have put in, this template is ideal With all of its features, including tables, diagrams, statistics, and lists, its perfect for a business plan presentation. Make your ideas more appealing with these professional slides. Download Recommendation Techniques Evolution Of Recommender System Used By Netflix Designs PDF from Slidegeeks today.


The following slide highlights the major challenges faced by an organization in executing training and development program to enhance productivity and retain top talent. The graph constitutes of major causes such as insufficient time, lack of resources, costly process etc. Showcasing this set of slides titled Major Challenges In Growth And Development Program Guidelines PDF. The topics addressed in these templates are Major Challenges In Growth, Development Program. All the content presented in this PPT design is completely editable. Download it and make adjustments in color, background, font etc. as per your unique business setting.


The following slide highlights the kpas of employee training and development program to evaluate its effectiveness. It includes elements such as program efficiency, workforce satisfaction score, net promoter score, recommended learning courses etc. Pitch your topic with ease and precision using this Growth And Development Program Analysis With KPI Dashboard Structure PDF. This layout presents information on Analysis With KPI Dashboard, Growth And Development Program. It is also available for immediate download and adjustment. So, changes can be made in the color, design, graphics or any other component to create a unique layout.


This slide showcases dashboard to track impact of diversity training on workplace management. Key metrics included here are gender distribution level, hire by gender, ethinicity distribution, promotion rate, termination rate etc. Pitch your topic with ease and precision using this Dashboard To Track Impact Of Extensive Diversity Training On Workplace Management Portrait PDF. This layout presents information on Dashboard To Track Impact, Extensive Diversity Training, Workplace Management. It is also available for immediate download and adjustment. So, changes can be made in the color, design, graphics or any other component to create a unique layout.
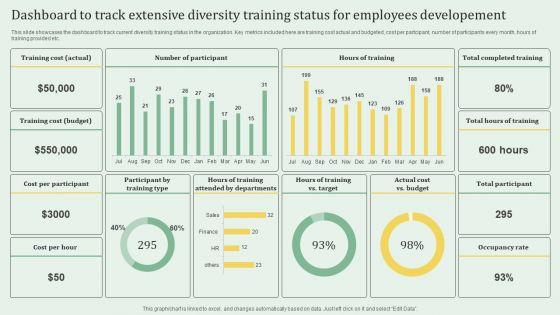

This slide showcases the dashboard to track current diversity training status in the organization. Key metrics included here are training cost actual and budgeted, cost per partcipant, number of participants every month, hours of training provided etc. Showcasing this set of slides titled Dashboard To Track Extensive Diversity Training Status For Employees Developement Elements PDF. The topics addressed in these templates are Training Cost, Budget, Occupancy Rate. All the content presented in this PPT design is completely editable. Download it and make adjustments in color, background, font etc. as per your unique business setting.


The following slide highlights dashboard for accounting and finance automation. It includes components such as bank balance, accounts receivable, accounts payable, income, expenses, overdue amount, overdue invoices, over time accounts receivable and payable, invoice anticipated details by customers etc. Pitch your topic with ease and precision using this Online Bookkeeping And Finance Automation Dashboard Topics PDF. This layout presents information on Online Bookkeeping, Finance Automation Dashboard. It is also available for immediate download and adjustment. So, changes can be made in the color, design, graphics or any other component to create a unique layout.


The following slide highlights accounting automation statistics to improve efficiency and productivity. It includes components such as top automated services used for accounting firms, firms undertaking cloud-based finance and accounting software according to size, major accounting firms in the USA etc. Pitch your topic with ease and precision using this Key Statistics Associated With Bookkeeping Automation Demonstration PDF. This layout presents information on Key Statistics Associated, Bookkeeping Automation. It is also available for immediate download and adjustment. So, changes can be made in the color, design, graphics or any other component to create a unique layout.


The following slide highlights major challenges faced by finance and accounting automation. It includes challenges such as lack of time, team skillset, expensive, complicated process, data misuse, investment, maintenance, experimentation, incorrect installation etc. Showcasing this set of slides titled Key Finance And Bookkeeping Automation Challenges Professional PDF. The topics addressed in these templates are Burdens Organization, Investment, Consistent Security Procedures. All the content presented in this PPT design is completely editable. Download it and make adjustments in color, background, font etc. as per your unique business setting.


The following slide highlights automation of finance and accounting activities using software. It includes tasks such as external reporting and financial controlling, cash disbursement, revenue management, tax, general accounting and analysis, general accounting operations, treasury, risk management etc. Pitch your topic with ease and precision using this Degree Of Bookkeeping And Finance Activities Automation Graphics PDF. This layout presents information on Tax Automation, Business Intelligence, Revenue Management. It is also available for immediate download and adjustment. So, changes can be made in the color, design, graphics or any other component to create a unique layout.


The following slide highlights dashboard for accounts payable automation. It includes components such as purchase order invoices, approval pending, approved, invoice status, processed status, total invoice scanned, top 5 exceptions etc. Showcasing this set of slides titled Bookkeeping Payable Automation Invoice Processing Dashboard Summary PDF. The topics addressed in these templates are Processor Productivity, Bookkeeping Payable Automation, Invoice Processing Dashboard. All the content presented in this PPT design is completely editable. Download it and make adjustments in color, background, font etc. as per your unique business setting.
The following slide highlights implementation of cloud storage performance tracking dashboard to improve innovation, to attain faster time to market. It includes components such as pinned folders, storage usage, recently used files, documents, images, videos, music, fonts, projects etc. Showcasing this set of slides titled Tracking Performance Of Cloud Storage Deployment Dashboard Portrait PDF. The topics addressed in these templates are Storage Usage, Dashboard, Tracking. All the content presented in this PPT design is completely editable. Download it and make adjustments in color, background, font etc. as per your unique business setting.
The following slide highlights cloud implementation expenditure dashboard to determine overspend, unused resources, plan future costs, available discounts, customization options etc. It includes components such as cloud native, software, departments, cost centre etc. Pitch your topic with ease and precision using this Tracking Expenditure Incurred On Cloud Deployment Dashboard Download PDF. This layout presents information on Dashboard, Tracking, Deployment. It is also available for immediate download and adjustment. So, changes can be made in the color, design, graphics or any other component to create a unique layout.


Showcasing this set of slides titled Big Data Analytics Procedure To Increase Efficiency Icon Sample PDF. The topics addressed in these templates are Big Data Analytics, Procedure, Increase Efficiency. All the content presented in this PPT design is completely editable. Download it and make adjustments in color, background, font etc. as per your unique business setting.


This slide provides marketing intelligence report of architecture, construction and real estate with the purpose of communicating the result of automation in the industry. Key elements consist of factors, driving growth, factors, enhancing customers, experience, metrics of success etc. Showcasing this set of slides titled Strategic Marketing Analysis And Planning Report For Architecture And Real Estate Slides PDF. The topics addressed in these templates are Factors Driving Growth, Metrics Success, Factors Enhancing Customer Experience. All the content presented in this PPT design is completely editable. Download it and make adjustments in color, background, font etc. as per your unique business setting.


Following slide presents a marketing intelligence dashboard, which can be used to track the effectiveness of advertisement campaign and take necessary actions for improvement. The key performance indicators were total revenue, marketing spend etc. Showcasing this set of slides titled Strategic Marketing Analysis And Planning Dashboard To Track Campaign Effectiveness Summary PDF. The topics addressed in these templates are Marketing Spend, Conversion Rate, Return Investment. All the content presented in this PPT design is completely editable. Download it and make adjustments in color, background, font etc. as per your unique business setting.


The following dashboard depicts the application of marketing intelligence in the field of healthcare, which will be used by clinical laboratories, hospitals and private institutions to track the effectiveness of marketing campaigns. Key performance indicators are total convergence, cost per conversion, referral form filled by patients, patient request etc. Showcasing this set of slides titled Healthcare Strategic Marketing Analysis And Planning Kpi Dashboard Elements PDF. The topics addressed in these templates are Quarterly Conversion Breakdown, Annual Conversion Breakdown, Patient Request. All the content presented in this PPT design is completely editable. Download it and make adjustments in color, background, font etc. as per your unique business setting.
This slide highlights the KPI dashboard to track progress for digital media and PR relations. The purpose of this slide is to help the manager track the success of digital media and PR strategies employed for increasing brand awareness. Showcasing this set of slides titled Dashboard For Tracking Digital Media Outreach Strategy Formats PDF. The topics addressed in these templates are Social Media Posts, Press Releases Issued, Blogs Published . All the content presented in this PPT design is completely editable. Download it and make adjustments in color, background, font etc. as per your unique business setting.


The purpose of this dashboard is to summarize the results of Business market research and competitor analysis conducted by marketing manager to gather customer feedback. Key performance metrics include demographics, brand recall, net promoter score and company ratings. Showcasing this set of slides titled Usiness Marketing Research And Competitor Analysis Dashboard Sample PDF. The topics addressed in these templates are Brand Recall, Demographics, Net Promoter Score. All the content presented in this PPT design is completely editable. Download it and make adjustments in color, background, font etc. as per your unique business setting.


The purpose of this slide is to summarize the results of business market research survey conducted by marketing manager to collect customer feedback. Results provided are related to user description and user experience. Showcasing this set of slides titled Marketing Research Dashboard For Customer Feedback Analysis Introduction PDF. The topics addressed in these templates are Age Category, User Location, User Experience . All the content presented in this PPT design is completely editable. Download it and make adjustments in color, background, font etc. as per your unique business setting.


Following slide consists of a dashboard which can be used for conducting market research of customer demographics in order to strategize accordingly. The key performance metrics include customer gender, education level, technology adopters and brand innovators. Showcasing this set of slides titled Marketing Research Dashboard For Customer Demographics Guidelines PDF. The topics addressed in these templates are Customer Gender, Technology Adopters, Education Level. All the content presented in this PPT design is completely editable. Download it and make adjustments in color, background, font etc. as per your unique business setting.


The following slide showcases statistical data for strategic brand loyalty and management to track customer engagement and buying decisions. It includes components such as level of customer loyalty to brands, reasons for developing brand loyalty, customers response to new brands etc. Showcasing this set of slides titled Strategic Brand Loyalty And Governance Statistics Clipart PDF. The topics addressed in these templates are Customer Loyalty Brands, Customers Response Brands, Reasons Developing Brand Loyalty. All the content presented in this PPT design is completely editable. Download it and make adjustments in color, background, font etc. as per your unique business setting.


The following slide highlights strategy for brand management to support companies to improve revenue, brand recognition etc. It includes components such as customers, campaigns, customer value, demographic breakdown, brand mentions, advertising, web conversion rate, loan to value, customer acquisition cost etc. Pitch your topic with ease and precision using this Dashboard For Brand Marketing Governance Strategy Portrait PDF. This layout presents information on Brand, Customers, Campaigns. It is also available for immediate download and adjustment. So, changes can be made in the color, design, graphics or any other component to create a unique layout.


Following slide showcases impact of robotic process automation on real estate business activities which can lead to future organisational growth. It includes key components such as account consolidation, refund management, coupon management, payment correction, and accounts modification. Showcasing this set of slides titled AI Property Impact On Real Estate Property Management Brochure PDF. The topics addressed in these templates are Impact Robotic Process Automation, Highlight General Ledge, Notifications Accounts Management. All the content presented in this PPT design is completely editable. Download it and make adjustments in color, background, font etc. as per your unique business setting.


Boost your confidence and team morale with this well-structured Stages Of Growth Ppt PowerPoint Presentation Complete Deck With Slides. This prefabricated set gives a voice to your presentation because of its well-researched content and graphics. Our experts have added all the components very carefully, thus helping you deliver great presentations with a single click. Not only that, it contains a set of seventeen slides that are designed using the right visuals, graphics, etc. Various topics can be discussed, and effective brainstorming sessions can be conducted using the wide variety of slides added in this complete deck. Apart from this, our PPT design contains clear instructions to help you restructure your presentations and create multiple variations. The color, format, design anything can be modified as deemed fit by the user. Not only this, it is available for immediate download. So, grab it now.


Improve your presentation delivery using this Advantages Of Organization Change Administration Ppt PowerPoint Presentation Complete Deck With Slides. Support your business vision and objectives using this well-structured PPT deck. This template offers a great starting point for delivering beautifully designed presentations on the topic of your choice. Comprising forteen this professionally designed template is all you need to host discussion and meetings with collaborators. Each slide is self-explanatory and equipped with high-quality graphics that can be adjusted to your needs. Therefore, you will face no difficulty in portraying your desired content using this PPT slideshow. This PowerPoint slideshow contains every important element that you need for a great pitch. It is not only editable but also available for immediate download and utilization. The color, font size, background, shapes everything can be modified to create your unique presentation layout. Therefore, download it now.


Improve your presentation delivery using this Big Data Analytics Procedure Ppt PowerPoint Presentation Complete Deck With Slides. Support your business vision and objectives using this well-structured PPT deck. This template offers a great starting point for delivering beautifully designed presentations on the topic of your choice. Comprising twenty this professionally designed template is all you need to host discussion and meetings with collaborators. Each slide is self-explanatory and equipped with high-quality graphics that can be adjusted to your needs. Therefore, you will face no difficulty in portraying your desired content using this PPT slideshow. This PowerPoint slideshow contains every important element that you need for a great pitch. It is not only editable but also available for immediate download and utilization. The color, font size, background, shapes everything can be modified to create your unique presentation layout. Therefore, download it now.
This slide showcases sports team and brand engagement tracking dashboard. It provides details about owned channels, operated channels, images, videos, hashtags, image content, video content, etc. Do you have to make sure that everyone on your team knows about any specific topic I yes, then you should give Fitness Product Promotion Campaigns Sports Team And Brand Engagement Tracking Dashboard Designs PDF a try. Our experts have put a lot of knowledge and effort into creating this impeccable Fitness Product Promotion Campaigns Sports Team And Brand Engagement Tracking Dashboard Designs PDF. You can use this template for your upcoming presentations, as the slides are perfect to represent even the tiniest detail. You can download these templates from the Slidegeeks website and these are easy to edit. So grab these today


This slide showcases major impact of sports marketing strategies on overall stakeholder engagement. It provides details about repeated store visit, brand awareness, brand recall, employee engagement, sports sponsorship, etc. There are so many reasons you need a Fitness Product Promotion Campaigns Sports Marketing Strategies Impact Engagement Analysis Clipart PDF. The first reason is you can not spend time making everything from scratch, Thus, Slidegeeks has made presentation templates for you too. You can easily download these templates from our website easily.


This slide showcases major impact of sports marketing strategies on brands target audience. It provides details about generation-Z, millennials, baby boomers, generation-Y, eSports campaigns, social media content, etc. Want to ace your presentation in front of a live audience Our Fitness Product Promotion Campaigns Sports Marketing Strategies Impact Audience Analysis Pictures PDF can help you do that by engaging all the users towards you. Slidegeeks experts have put their efforts and expertise into creating these impeccable powerpoint presentations so that you can communicate your ideas clearly. Moreover, all the templates are customizable, and easy-to-edit and downloadable. Use these for both personal and commercial use.


This slide showcases sports influencer marketing which can guide athleisure brands to increase awareness. It provides details about brand partnership appeal, professional athletes, sports teams, sports fans, curated products, etc. Slidegeeks is one of the best resources for PowerPoint templates. You can download easily and regulate Fitness Product Promotion Campaigns Sports Influencer Marketing For Enhanced Awareness Diagrams PDF for your personal presentations from our wonderful collection. A few clicks is all it takes to discover and get the most relevant and appropriate templates. Use our Templates to add a unique zing and appeal to your presentation and meetings. All the slides are easy to edit and you can use them even for advertisement purposes.


This slide showcases cost analysis which can help brand managers in calculating overall budget for sports marketing campaigns. It provides details about media rights, digital media, sponsorships, eSports endorsement, etc. Create an editable Fitness Product Promotion Campaigns Measuring Overall Budget For Sports Marketing Campaigns Pictures PDF that communicates your idea and engages your audience. Whether you are presenting a business or an educational presentation, pre-designed presentation templates help save time. Fitness Product Promotion Campaigns Measuring Overall Budget For Sports Marketing Campaigns Pictures PDF is highly customizable and very easy to edit, covering many different styles from creative to business presentations. Slidegeeks has creative team members who have crafted amazing templates. So, go and get them without any delay.


This slide showcases ideal customer analysis and sample persona which can be used by companies focusing on sports marketing. It provides details about age, occupation, locality, goals, behavior, personality, favorite brands, etc. Boost your pitch with our creative Fitness Product Promotion Campaigns Ideal Customer For Marketing Through Sports Graphics PDF. Deliver an awe-inspiring pitch that will mesmerize everyone. Using these presentation templates you will surely catch everyones attention. You can browse the ppts collection on our website. We have researchers who are experts at creating the right content for the templates. So you do not have to invest time in any additional work. Just grab the template now and use them.


This slide showcases eSports market overview with its future revenue projections and growth drivers. It provides details about sponsorship, advertising, merchandise, online gaming, mobile gaming, smartphones, advertising, etc. Find a pre-designed and impeccable Fitness Product Promotion Campaigns Esports Market Overview Forecasts And Growth Drivers Rules PDF. The templates can ace your presentation without additional effort. You can download these easy-to-edit presentation templates to make your presentation stand out from others. So, what are you waiting for Download the template from Slidegeeks today and give a unique touch to your presentation.


This slide showcases a report presenting results of software system test execution to improve performance and functionality. It includes key components such as passed, blocked, retest, failed, ID, title, priority, assigned person and status. Showcasing this set of slides titled Software System Testing Outcome Reporting Infographics PDF. The topics addressed in these templates are Application Responsiveness, Application Performance, Security. All the content presented in this PPT design is completely editable. Download it and make adjustments in color, background, font etc. as per your unique business setting.


This slide showcases a report presenting results of social media survey to identify customers engagement on social media. It includes key elements such as popular social media platforms, people having access to smartphone, etc. Showcasing this set of slides titled Social Media Survey Outcome Reporting Download PDF. The topics addressed in these templates are Social Media Engagement Analysis, Responses Received, Social Media Channels. All the content presented in this PPT design is completely editable. Download it and make adjustments in color, background, font etc. as per your unique business setting.


This slide showcases a report presenting results of product market research survey to collect customer feedback about new product. It includes key elements such as ingredient desire result, new product concept survey and demographic response. Showcasing this set of slides titled Product Target Market Research Survey Outcome Reporting Dashboard Portrait PDF. The topics addressed in these templates are Uniqueness, Problem, Effectiveness. All the content presented in this PPT design is completely editable. Download it and make adjustments in color, background, font etc. as per your unique business setting.
This slide showcases a report showing monthly results financial performance to ensure constant revenue growth. It includes key components such as gross profit margin, operating expenses ratio, operating profit margin, net profit margin, earning before interest and taxes, etc. Showcasing this set of slides titled Monthly Financial Performance Outcome Reporting Icons PDF. The topics addressed in these templates are Operating Expenses, Income Statement, Operating Expenses Ratio. All the content presented in this PPT design is completely editable. Download it and make adjustments in color, background, font etc. as per your unique business setting.


This slide highlights a report showing results of SEO marketing performance to formulate effective promotional strategy. It includes key elements such as sessions from organic marketing, conversion rate from organic marketing, conversions from organic marketing, etc. Showcasing this set of slides titled Marketing SEO Performance Outcome Reporting Background PDF. The topics addressed in these templates are Organic Marketing, Top Search Engines, Organic Marketing. All the content presented in this PPT design is completely editable. Download it and make adjustments in color, background, font etc. as per your unique business setting.


This slide showcases a report showing results of IT software testing to analyze project performance. It includes key components such as days t delivery, development, test, release date, total defects, major defects, builds, test activities, total test runs, execution time, etc. Showcasing this set of slides titled IT Project Performance Outcome Reporting Template PDF. The topics addressed in these templates are Test Activities, Builds, Project Performance. All the content presented in this PPT design is completely editable. Download it and make adjustments in color, background, font etc. as per your unique business setting.


This slide presents a report highlighting results of employee satisfaction survey to reduce turnover and increase productivity. It includes key elements such as employee satisfaction results and employee engagement trends. Showcasing this set of slides titled Employee Satisfaction Survey Outcome Reporting Sample PDF. The topics addressed in these templates are Engagement Rate, Employee Engagement Trends, Employee Satisfaction Results. All the content presented in this PPT design is completely editable. Download it and make adjustments in color, background, font etc. as per your unique business setting.


This slide showcases a report presenting results of customer satisfaction survey to identify service improvement areas. It includes key elements such as service satisfaction level, customer business type, recommendation likeliness and service improvement areas. Showcasing this set of slides titled Customer Satisfaction Survey Outcome Reporting Portrait PDF. The topics addressed in these templates are Service Improvements Areas, Customer Business Type, Service Satisfaction. All the content presented in this PPT design is completely editable. Download it and make adjustments in color, background, font etc. as per your unique business setting.


This slide showcases a report presenting results of application test execution to improve performance and functionality. It includes key components such as summary, status, components, requirements, executions and passed executions. Showcasing this set of slides titled Application Test Execution Outcome Reporting To Improve Performance Sample PDF. The topics addressed in these templates are Login Attempts, Creating Confirmation, Email Requires Retesting. All the content presented in this PPT design is completely editable. Download it and make adjustments in color, background, font etc. as per your unique business setting.


This slide showcases a report for analyzing and measuring performance of funds to making effective investment decision making. It includes key components such as portfolio asset allocation, investment growth and returns. Pitch your topic with ease and precision using this Investment Performance Analysis And Management Report Sample PDF. This layout presents information on Portfolio Assets Allocation, Investment Growth, Returns. It is also available for immediate download and adjustment. So, changes can be made in the color, design, graphics or any other component to create a unique layout.
This slide showcases a dashboard to track and supervise funds performance for portfolio balancing . it includes key components such as amount invested in funds, number of invested funds, rate of return, annual investments and rating wise investments. Pitch your topic with ease and precision using this Investment Fund Performance Tracking Dashboard Microsoft PDF. This layout presents information on Amount Invented Funds, Rate Return, Rating Wise Investments. It is also available for immediate download and adjustment. So, changes can be made in the color, design, graphics or any other component to create a unique layout.


This slide showcases a dashboard for analyzing and measuring performance of funds to make effective investment decision. It includes key components such as total invested amount, stocks, bonds, crypto, top funds, diversification and dividend. Pitch your topic with ease and precision using this Investment Fund Performance Analysis Dashboard Professional PDF. This layout presents information on Diversification, Invested Value, Bonds. It is also available for immediate download and adjustment. So, changes can be made in the color, design, graphics or any other component to create a unique layout.


This slide presents statistical data showing allocation of investment fund and performance analysis to identify portfolio adjustment needs. It includes key components such as funds, amount invested, annual rate of returns, KPIs to measure and current price. Pitch your topic with ease and precision using this Investment Fund Allocation And Performance Analysis Designs PDF. This layout presents information on Amount Invested, Annual Rate Return, Current Price. It is also available for immediate download and adjustment. So, changes can be made in the color, design, graphics or any other component to create a unique layout.
This slide presents a report highlighting performance of returns from investments in multiple funds to analyze and measure portfolio. It includes key components such as annual returns of funds, corporate bonds, equity, cash and market mood index and G-sec. Pitch your topic with ease and precision using this Investment Annual Returns Performance Report Icons PDF. This layout presents information on Cash, Quity, Corporate Bonds. It is also available for immediate download and adjustment. So, changes can be made in the color, design, graphics or any other component to create a unique layout.


This slide highlights a statistical data showing performance of investment funds for developing financial growth plan. It includes key components such as global equities, aggressive, growth, balanced, moderate, conservative and cash. Pitch your topic with ease and precision using this Investment Annual Performance Report Pictures PDF. This layout presents information on Low Interest Rates, Wage Subsidies, Returns Due Market Drop. It is also available for immediate download and adjustment. So, changes can be made in the color, design, graphics or any other component to create a unique layout.


This slide showcases a statistical data highlighting performance of balanced funds to measure and analyze returns on investments . It includes key components such as returns in 1 year, returns in 3 years and returns in 5 years. Pitch your topic with ease and precision using this Balanced Investment Annual Returns Performance Chart Designs PDF. This layout presents information on Balanced Investment, Annual Returns, Performance Chart. It is also available for immediate download and adjustment. So, changes can be made in the color, design, graphics or any other component to create a unique layout.


The following slide displays industry snapshot for display advertising in company to identify future growth opportunities. It includes details about top contenders, geographical analysis, etc. Showcasing this set of slides titled Display Online Ad Campaigning Industry Report For Organization Structure PDF. The topics addressed in these templates are Growth Analysis, Geographical Analysis, Biggest Growth Contributing. All the content presented in this PPT design is completely editable. Download it and make adjustments in color, background, font etc. as per your unique business setting.
SHOW
- 60
- 120
- 180
DISPLAYING: 60 of 10000 Item(s)
Page